

Abstract
Purpose
To examine the age and gender-specific trends of schedule II opioid use among California residents, with special reference to multiple provider users (“doctor shoppers”).
Methods
Utilizing data from the California Prescription Drug Monitoring Program, we examined age and gender-specific trends of Schedule II opioid use during calendar years 1999–2007. Specifically, we analyzed: 1) the prevalence of Schedule II opioid users among California’s population, and 2) the proportion of these opioid users who were doctor shoppers (defined as an individual who used more than five different prescribers for all schedule II opioids he/she obtained in a calendar year).
Results
Among all age and gender groups, the prevalence of Schedule II opioid users in California increased by 150%–280% and the prevalence of doctor shoppers among users increased by 111%–213% over nine years. The prevalence of opioid users was lowest among 18–44 year-old males (1.25%) and highest among 65 years and older females (5.31%) by 2007. The prevalence of doctor shoppers was approximately 1.4% among those up to age 64 and 0.5% among those 65 years and older. The gender difference in doctor shoppers among all age groups was negligible. On average, the cumulative morphine-equivalent amount of Schedule II opioid per individual obtained per year was three- to six-fold higher for doctor shoppers than for the general population across different age and gender groups.
Conclusions
Age and gender differences in opioid use were relatively small, while the trends for use of opioids and multiple providers grew at a disquieting rate.
Keywords: Age, gender, opioid prescription, doctor shopping, prevalence, California
INTRODUCTION
Prescription opioid abuse and diversion is part of a public health crisis in the United States that includes addiction and death from overdose (1). “Doctor shopping” is one of the most common methods by which prescription opioids are being diverted (2). The term refers to a scenario whereby a patient seeks prescriptions from multiple providers without revealing to each prescriber that other sources are involved. This practice has led to financial losses for insurance companies due to fraudulent prescriptions and related medical services (2, 3). According to one report from the Government Accountability Office (GAO), about 170,000 Medicare recipients “shopped” for doctors for potentially dangerous amounts of drugs (mainly opioids) at a cost of $148 million in 2008 (3). But beyond the taxpayer burden, increasing evidence shows that doctor shopping has played a role in inadvertent opioid overdose death (1, 2, 4, 5). A better understanding of the epidemiology of doctor shopping, including its prevalence and time trend, is necessary for developing effective strategies to control problems originating through this mechanism.
To prevent and detect drug abuse and diversion, many states have established Prescription Drug Monitoring Programs (PDMPs) (6) that collect exhaustive prescription information on dispensed pharmaceutical controlled substances in a state. A PDMP database identifies multiple providers and pharmacists and has been increasingly used to document this phenomenon. Doctor shopping and pharmacy shopping have been defined using a variety of cut-off points for classifying a patient as having potential controlled substance misuse or mismanagement that would warrant further evaluation (4, 7–12). For instance, Gilson et al. examined California’s PDMP data and reported that approximately 10% of all opioid prescriptions dispensed over 2000–2006 were consistent with a multiple provider episode (MPE). In addition, they detected escalating monthly trends in the number of MPEs involving 9 types of opioids during a period in which the prescribing of these medications increased in California. In this study, the MPE was defined as involving >1 prescriber and >1 pharmacy within a 30-day window for the same medication (13). Because one individual can use more than one type of opioid and thereby contribute to more than one MPE in the same month, it is not known whether the number of distinct doctor shoppers increased and how the change in the number of doctor shoppers are related to the change in the California population or prescription opioid recipients. In examining this data from the perspective of the patient who engaged in MPEs, the association of age and gender with doctor shopping for prescription opioids has been characterized (4, 10, 11, 14). Specifically, the incidence rate of new prescriber use for opioid prescriptions generally declines as age increases (11, 14). In addition, males have a lower incidence rate of using multiple prescribers than females (4, 10, 14). However, to our knowledge, there are no published reports on the magnitude of doctor shopping among age or gender subpopulations.
To inform the public on the prevalence of doctor shoppers and opioid users in California, our research group was granted access by the California Department of Justice (DOJ) to de-identify and analyze their PDMP database during an nine year period between 1999 and 2007. The details of this process were reported previously (11). We were thus able to examine the trends in the prevalence of schedule II opioid users and doctor shoppers in California and analyze this information in terms of age and gender groups.
METHODS
Data source
This descriptive study used 1999–2007 archival data from the California PDMP, the Controlled Substance Utilization Review and Evaluation System (CURES). This database is operated under the auspices of the California DOJ. All California doctors and pharmacies are mandated to report to the DOJ about the controlled substances prescribed or dispensed. Schedule II opioid prescribing and dispensing have been monitored since 1939 when California’s version of a PDMP was established. CURES monitors 7 types of schedule II opioids including transdermal fentanyl, and oral medications such as hydromorphone, levorphanol, meperidine, methadone, morphine, and oxycodone. In 1998, an electronic controlled substance surveillance system replaced the original paper-based system. Pharmacists input the drug name, quantity, dosage, and date of the transaction at the point of disbursement into the CURES database. In addition, the patient’s name, date of birth, gender, and address are transmitted, as are the prescriber and pharmacy identities utilizing Drug Enforcement Administration (DEA) registration numbers. To ensure confidentiality and anonymity of the information, the CURES data for this study underwent de-identification as previously described (11).
Inclusion and exclusion criteria
Schedule II opioid prescriptions that were provided to 18–100 year old California residents in the CURES database in each calendar year from 1999 to 2007 were deemed suitable for this study. Prescriptions for the 7 types of schedule II opioids were queried. Both long- and short-acting formulations of morphine and oxycodone were included. The address of the prescription recipient was used to demarcate in-state residents from all others who were disqualified so that prevalences could be calculated. Data was excluded if a prescription was: (1) incomplete with respect to the age, gender and prescriber information; (2) implausible, e.g., a duplicate prescription with the same formulation recorded for the same time period; (3) a commercial transaction whereby the prescription was written for more than 700 pills or 50 patches in a given 30-day period (based on personal communication with the manager of the CURES database in the California Department of Justice); (4) for medications not suggestive of standard delivery systems employed by most chronic pain individuals (e.g., rectal suppositories, intravenous preparations, syrups, solutions, etc.); (5) for use of medication by age groups normally not associated with chronic pain or obtaining medications through office use interactions.
Definition of doctor shopper
The medical literature has characterized doctor shopping using different definitions. Individuals visiting more than one provider and/or pharmacy for opioids during a specified period of time provides the basis for this characterization. The period of time diverges from one month to one year (3, 7, 8, 11). Wilsey et al.’s study recommended a cutoff of 6 or more physicians over a year in identifying doctor shopper (10). Based on that, we defined a doctor shopper as an individual who used more than five prescribers for same schedule of opioids in one calendar year. We did not restrict the number of pharmacies used or limit this definition to the same type of opioid.
Statistical analysis
This study examined the yearly trends of: 1) the prevalence of Schedule II opioid users among the California resident population, 2) the prevalence of doctor shoppers among Schedule II opioid users, 3) the proportion of Schedule II opioid prescriptions and morphine-equivalent amount dispensed to doctor shoppers. Every patient who received at least one Schedule II opioid prescription within a calendar year was counted as a single distinct prevalent user. Every patient who used more than five different prescribers for any schedule II opioid obtained within a calendar year was counted as a single distinct prevalent doctor shopper. The prevalence of opioid users was calculated using California resident population estimates obtained on July 1st of each year (15). The amount of morphine-equivalents for opioids was calculated using established conversion factors (16). All trends were examined by age and gender groups. Based on previous published research on opiod use for chronic pain (17), patients were classified to 5 age groups: 18–34 y, 35–44 y, 45–64 y, 65–74 y, and 75+ y. Initial data exploration showed that 18–34y and 35–44y groups, 65–74y and 75+y groups, had similar trends in almost all of the outcome measure respectively. Also, in one of our previous study we found that the incidence rate of new prescriber use for prescription opioids were quite similar for the 18–34 and 35–44 year groups (14). Thus finally 3 age groups were used: 18–44 y, 45–64 y and 65+ y. The percent change in prevalence between 1999 and 2007 was described as relative change using 1999 measurements as a baseline. For instance, an increase of prevalence from 1% to 3% would be calculated as a 200% increase, rather than a 2% increase. This study also compared doctor shoppers to the general opioid user population with regard to the mean number of prescriptions and the mean cumulative amount of morphine-equivalents obtained by an individual in a year.
The Institutional Review Board of the University of California at Davis and the Veterans Administration Northern California Health Care System Research and Development Committee granted approvals to conduct this research.
RESULTS
Overall, the population of California opioid recipients and doctor shoppers expanded considerably over the nine years. In 1999, there were 201,117 schedule II opioid recipients and 0.46% (n=919) were doctor shoppers. In 2007, there were 725,577 schedule II opioid recipients in California and 1.18% (n=8,587) were doctor shoppers. Similarly, the opioid consumption in California experienced a dramatic increase. In 1999, a total of 697,707 schedule II prescriptions encompassing 1,600 kg of morphine-equivalent opioids were prescribed in the state. In aggregate, doctor shoppers obtained 49 kg comprising 3.06% of the total amount. By 2007, there were a total of 3,260,824 schedule II opioid prescriptions comprised of 8,400 kg morphine-equivalents. During this year, doctor shoppers received 440 kg (5.24%) (Figure 1).
Figure 1.
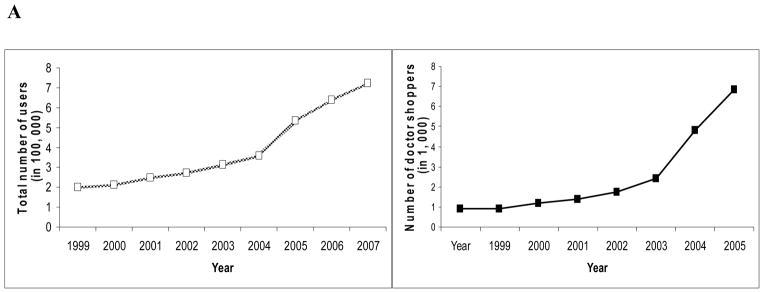


Trends in Schedule II opioid use of and doctor shopping for Schedule II opioid prescriptions in California, 1999–2007. (A) Number of general adult users and doctor shoppers for Schedule II opioid prescriptions in California, 1999–2007. (B) Number of Schedule II opioid prescriptions dispensed to general adult recipients and doctor shoppers in California, 1999–2007. C) Morphine-equivalent Schedule II opioid amount dispensed to general adult recipients and doctor shoppers in California, 1999–2007.
Trends of prevalence of opioid users
Over the nine years from 1999–2007 the population size in California increased by 11%. To describe the trends of schedule II opioid use within each age and gender group after accounting for the increase of population size, the one-year periodic prevalence of schedule II opioid users among the adult population was examined for each calendar year during the study period. Notably, the prevalence was lower among males than females and lower among younger individuals than older individuals each year. The prevalence over years for each age and gender group followed the same pattern: gradually rising from 1999 to 2004 and then increasing more dramatically from 2005 to 2007. Overall, the prevalence increased by 150% to 280% for different age and gender populations, with the prevalence among 18–44y females having increased the most and that among 65+ year old males the least. The prevalence was as low as 1.25% among 18–44y male populations and as high as 5.31% among 65+y female populations in 2007 in California. (Figure 2)
Figure 2.
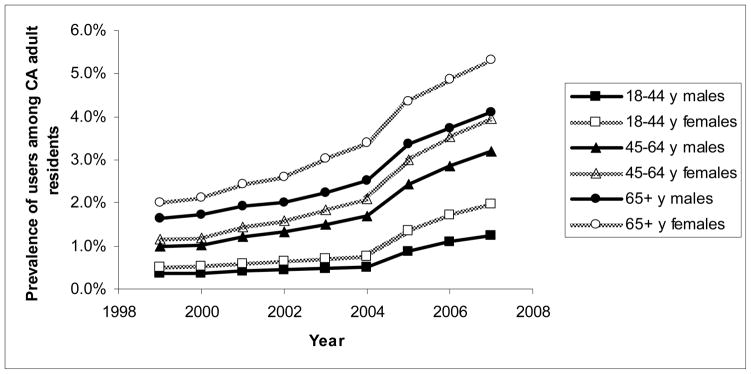
Trends in 1-year period prevalence of schedule II opioid users among the California adult population by age and gender groups from 1999–2007.
Trends of prevalence of doctor shoppers
For each year in California, the prevalence of doctor shoppers among 18–44 year old and 45–64 year old schedule II opioid recipients was similar and more than twice as high as that among the 65+ year old populace. The gender difference in doctor shopper prevalence was minimal. The prevalence of doctor shoppers among all age and gender group schedule II opioid recipients increased over the 9 years, with the prevalence among 65+ year old female recipients increased most (by 213%) and that among 18–44 year old male recipients increased least (111%). The increase also rose more precipitously after 2004. By 2007, the highest prevalence was among 18–44 year old and 45–64 year old male schedule II opioid recipients (approximately 1.4%) and the lowest prevalence was among 65+ year old male and female recipients (approximately 0.5%) (Figure 3).
Figure 3.

Trends in the 1-year periodic prevalence of doctor shoppers among adult schedule II opioid users by age and gender groups from 1999–2007.
Trends of proportion of opioids dispensed to doctor shoppers
For each year in California, the proportion of schedule II opioid prescriptions written to doctor shoppers was higher in younger age groups than in older age groups. There was very little difference between the two genders. The proportion increased over the 9 years for all age-groups and most of the increase occurred after 2004. Comparing the proportion in 2007 to that in 1999, the 18–44 year old female group increased the most (by 248%). By 2007, the 18–44 year old group had the highest proportion of prescriptions written to doctor shoppers (more than 11%), and the 65+ year old group had the lowest proportion of prescriptions written to doctor shoppers (less than 3%) (Figure 4-A).
Figure 4.

Trends in the proportion of schedule II opioid prescriptions and morphine equivalent amount written to doctor shoppers by age and gender groups from 1999–2007. (A) Proportion of schedule II opioid prescriptions written to doctor shoppers. (B) Proportion of opioid amount dispensed to doctor shoppers.
The proportion of schedule II opioid amount dispensed to doctor shoppers followed a similar pattern to the proportion of prescriptions written to doctor shoppers. There was a higher proportion in the young age groups with little difference between genders. As of 2007, the 18–44 year old group had the highest proportion of prescriptions dispensed to doctor shoppers (about 8%), and the 65+ year old group had lowest proportion (about 3%) (Figure 4-B).
The 18–44 year old group had the highest prevalence of doctor shoppers (about 1.4%), they also had the highest proportion of multiple provider prescriptions (about 11%) and the highest opioid-equivalent amount (8%) dispensed. Compared to the other two age groups, the 45–64 year old individuals, including both genders, form the largest sector among either opioid users (approximately 50%) or doctor shoppers (approximately 40%) and obtained largest proportion of the prescriptions and amounts dispended to all users (approximately 50%) and all doctor shoppers (approximately 50%) each year. Figure 5 presents the age and gender distribution of Schedule II opioid recipients and doctor shoppers in 2007 in California.
Figure 5.

The age and gender distribution of (A) Schedule II opioid users and (B) doctor shoppers in 2007 in California.
Comparing doctor shoppers to general opioid users
Table 1 presents the average number of Schedule II opioid prescriptions and the average yearly cumulative morphine-equivalent amount per individual obtained in 2007 for doctor shoppers and general opioid recipients separately. Notably, the mean number of prescriptions per doctor shopper obtained approximately varied from 20 to 30 and the corresponding value for general opioid recipients was approximately from 4 to 5. Similarly, on average, the yearly cumulative amount of morphine-equivalents per doctor shopper obtained varied approximately from 30 g to 63 g and the corresponding amount received by a general recipient ranged approximately from 6 g to 18 g among different age and gender groups. Overall, on average, the number of prescriptions per individual received was approximately 5–9 times higher for doctor shoppers than general opioid recipients, and the cumulative morphine-equivalent amount per individual received was approximately 3–6 times higher for doctor shoppers than general opioid recipients across different age and gender groups.
Table 1.
Comparing doctor shoppers to general Schedule II opioid users with regard to number of prescriptions and morphine equivalent amount (mg) per individual obtained in 2007.
| Per general recipient | Per doctor shopper | Ratio* | ||
|---|---|---|---|---|
| 18–44y males | Number of Rx | 3.7 | 28.7 | 7.7 |
| Amount | 10,999.9 | 63,308.6 | 5.8 | |
| 18–44y females | Number of Rx | 3.4 | 30.2 | 8.8 |
| Amount | 7,753.0 | 46,218.8 | 6.0 | |
| 45–64y males | Number of Rx | 5.4 | 26.4 | 4.9 |
| Amount | 18,527.9 | 60,795.1 | 3.3 | |
| 45–64y females | Number of Rx | 5.3 | 26.1 | 4.9 |
| Amount | 14,950.5 | 48,079.8 | 3.2 | |
| 65+y males | Number of Rx | 3.8 | 21.2 | 5.5 |
| Amount | 6,731.6 | 37,272.8 | 5.5 | |
| 65+y females | Number of Rx | 4.5 | 20.3 | 4.6 |
| Amount | 6,095.7 | 30,617.10 | 5.0 |
Note. Rx: prescriptions.
Ratio= per doctor shopper/per general recipient
DISCUSSION
Using data from the California PDMP, this study examined trends in Schedule II opioid prescribing among all recipients as well as doctor shoppers over the 9 years, 1999–2007. Instead of absolute measures (such as the number of opioid users or the number of doctor shoppers), relative measures (prevalence or proportion) were used to adjust the increase in population size over the 9 years. Also to take into account the possibility of a disproportionate increase in size among different age and gender subpopulation, age and gender specific prevalence or proportion were used as the trend measure. A substantial increase in the Schedule II opioid consumption by both the general population and by doctor shoppers was documented, with a rapid increase occurring after 2004; this pattern was seen across all age and gender groups.
The increase in opioid use in California is consistent with results from insurance claim data (17–20) and Massachusetts PDMP data (8). We speculate that the growth of opioid use may be attributed to several reasons. Of note, the prevalence of chronic pain may have increased due to its long duration. Although statistics on overall chronic pain prevalence are not available, the estimated number of Americans suffering from chronic pain has increased from 34 million in 1990s (21) to 76 million by 2006 (22) and 116 million in more recent times (23). Findings from studies on specific types of pain have also demonstrated an increased prevalence (19, 24, 25). Other changes may have played a role in the increase of opioid use as well.
In the late 1990s, opioid analgesics were included in clinical guidelines for treating chronic non-cancer pain (26, 27). This event may have greatly increased the acceptance of using opioids for chronic pain in the medical community. Also, efforts to improve the knowledge base of prescribers were subsequently put into action. In 2001, California’s legislature required its prescribers to take continuing medical education courses on pain management. In line with this effort, state regulatory policies evolved to reduce prescribers’ fear of disciplinary action when prescribing opioids for patients with a legitimate medical need (28). All of the above factors may have contributed to the gradual increase in schedule II opioid use. We speculate that two policy changes may have led, or at least contributed substantially, to the rapid increase schedule II opioids prescribing after 2004. In 2005, CURES expanded its monitoring from just Schedule II to include Schedule III opioids as well and replaced a multiple copy (triplicate) prescription form with tamper-resistant paper forms. The former may have removed some prescribers’ logic to use only Schedule III opioids though this cannot be verified due to the lack of data for Schedule III prescription in CURES before 2005; the latter negated prescribers’ extra effort previously required to prescribe Schedule II opioids that involve completing multiple copy prescriptions (29). The increase in the number of doctor shoppers may have been a result of increase in opioid use. Although physicians or pharmacists can facilitate doctor shopping, we do not believe it is likely they played a significant role in the increase of doctor shoppers.
By analyzing age and gender groups, we learned that females had a higher prevalence of opioid use than males and older age groups had a higher prevalence than younger groups. These findings are consistent with the age and gender distribution of chronic pain. Previous investigators have shown that the prevalence of chronic pain increases with advancing age and females are more likely to suffer chronic pain than males (30). Contrariwise, the 65+ year old group had the lowest prevalence of doctor shoppers who were dispensed the lowest amount of opioids. The 18–44 year old group had the highest prevalence of doctor shoppers who received the highest opioid amount. Our result is similar to findings from White et al. that the odds of being involved in prescription opioid abuse declined with individual’ age at the first prescription opioid claim, with a peak in the 18–24 year group (9).
Despite the fact that the 65+ year old group of residents had the highest prevalence of opioid use and the 18–44 year old group had the highest prevalence of doctor shoppers, the 45–64 year old group forms the largest sector among both opioid users and doctor shoppers. Such a result is not surprising because this middle age group had a relatively large resident population, a higher prevalence of chronic pain than younger age groups, and called for less concern on safety for prescribing clinicians than 65+ age groups. Thus, to significantly reduce the burden of doctor shopping, this population should be a primary focus.
The contribution of doctor shopping on prescription opioid abuse and diversion remains unclear. According to the 2007 National Survey on Drug Use and Health, among persons 12 years of age and older who used opioids for non-medical purposes in the previous 12 months, about 18% obtained the pain relievers from clinicians’ prescriptions and not through diverted sources (31). But the question of how many individuals among the 18% visited multiple prescribers for their prescription opioids was not queried (31). The CURES data showed that overall 1.18% schedule II opioid users visited more than 5 providers in California in 2007 which is similar to the prevalence (less than 1%) in Massachusetts in 2006 (8). Chronic pain patients may be justified in seeking multiple providers to obtain pain relief given the possibility that some prescribers would not be comfortable with the doses sought by chronic pain patients. Nevertheless, abusers often collect prescription opioids through doctor shopping. On an annual basis, the CURES data illustrate that the mean number of prescriptions and the mean cumulative morphine-equivalent opioid amount per doctor shopper obtained in a year was as high as 6 and 9-fold, respectively, of that per general opioid user obtained. Notably, we compared the doctor shoppers to general schedule II opioid users instead of non-doctor shoppers. The latter should show even larger differences. Of concern in this regard is the increased risk of inadvertent overdose from the use of excessive amounts of opioids (32). Thus, closely monitoring doctor shoppers is necessary not only because it is illegal and economically burdensome but also because it contributes to an ongoing public health crisis. Opioid overdose is now the second leading cause of unintentional death in the United States, second only to motor vehicle crashes (33). As a result, the Centers for Disease Control advocates that state and federal benefits programs should consider strong measures. They recommended that for patients whose use of multiple providers cannot be justified on medical grounds, such programs should consider reimbursing opioid prescription claims from a single designated clinician and a single designated pharmacy (33). Such draconian measures would not be necessary should this problem not be related to a national epidemic. The present study supports the view that doctor shopping is increasing and that those who engage in this activity are obtaining very substantial amounts of opioids. Both of these trends support the CDC position on reigning in multiple provider prescriptions.
This study had several limitations. First of all, past surveillance data were used which was not collected for research so a evaluation of how schedule III opioid use affect schedule II opioid prescribing over the time window of this study cannot be conducted. Secondly, researchers have no control on data’s quality. Although the PDMP reporting is legislatively mandated, incomplete reporting or incorrect inputting might exist. Thirdly, our study could not capture those individual who had shopped doctors through internet or other states, so the actual doctor shoppers measured might have been underestimated. Finally, we have no idea about motivating factors for patients to obtain multiple prescriptions from different doctors. Some of them were prescribed opioids by multiple clinicians in group practice or by a clinician’ assistant which is legitimate. Thus, we were unable to examine the proportion of doctor shoppers who were engaged in illicit activities, i.e., drug abuse and diversion. Instead, we examined the prevalence of doctor shoppers based on specific criteria that was not inclusive of unauthorized or prohibited endeavors. We might have come to different conclusions if we were able to include such information. The availability of real-time access to the CURES database in the recent years (34) should facilitate a physician’s decision-making on opioid prescribing and reduce doctor shopping. It will be interesting to examine the trends of opioid use in California after 2007 to determine if opioid use and doctor shopping continued to increase. Despite the above limitations, this study is population-based with large sample size. PDMP data were used to allow a full describing of doctor shopping relative to opioid use in a state. This is the first study to report the prevalence and trends of doctor shopping in age and gender sub-populations.
In summary, California’s Schedule II opioid use among general recipients and doctor shoppers substantially increased across all age and gender groups during 1999–2007. Differences in the prevalence among age and gender groups were relatively small. Doctor shoppers should be closely monitored to control the risk of overdose.
Key points.
Across all age and gender groups, the Schedule II opioid use and doctor shopping increased substantially during 1999–2007 and most of the increase occurred after 2004.
The prevalence of opioid users was lower among males than females and lower among younger individuals than older individuals. The prevalence was lowest among 18–44 year-old males (1.25%) and highest among 65 years and older females (5.31%) by 2007.
The prevalence of doctor shoppers was approximately 1.4% among those up to age 64 and 0.5% among those 65 years and older by 2007. The gender difference in prevalence of doctor shoppers among all age groups was minimal.
Doctor shoppers should be closely monitored to control the risk of overdose.
Acknowledgments
We gratefully acknowledge funding for this project by the Robert Wood Johnson Foundation. Database architect support was derived through Grant Number UL1 RR024146 from the National Center for Research Resources, a component of the National Institutes of Health (NIH) and NIH Roadmap for Medical Research, and its contents are solely the responsibility of the authors and do not necessarily represent the official view of NCRR or NIH.
Footnotes
Disclosures
None of the authors of the above manuscript has any conflict of interest.
References
- 1.Volkow ND, McLellan TA. Curtailing diversion and abuse of opioid analgesics without jeopardizing pain treatment. JAMA. 2011;305(13):1346–7. doi: 10.1001/jama.2011.369. [DOI] [PubMed] [Google Scholar]
- 2.National drug intelligence center. National Drug Threat Assessment 2009. Johnstown, Pennsylvania: 2008. [Google Scholar]
- 3.Government Accountability Office. Medicare Part D: Instances of Questionable Access to Prescription Drugs. 2011. [Google Scholar]
- 4.Hall AJ, Logan JE, Toblin RL, Kaplan JA, Kraner JC, Bixler D, et al. Patterns of abuse among unintentional pharmaceutical overdose fatalities. JAMA. 2008;300(22):2613–20. doi: 10.1001/jama.2008.802. [DOI] [PubMed] [Google Scholar]
- 5.Martyres RF, Clode D, Burns JM. Seeking drugs or seeking help? Escalating “doctor shopping” by young heroin users before fatal overdose. Med J Aust. 2004;180(5):211–4. doi: 10.5694/j.1326-5377.2004.tb05887.x. [DOI] [PubMed] [Google Scholar]
- 6.Simoni-Wastila L, Tompkins C. Balancing diversion control and medical necessity: the case of prescription drugs with abuse potential. Subst Use Misuse. 2001;36(9–10):1275–96. doi: 10.1081/ja-100106227. [DOI] [PubMed] [Google Scholar]
- 7.Parente ST, Kim SS, Finch MD, Schloff LA, Rector TS, Seifeldin R, et al. Identifying controlled substance patterns of utilization requiring evaluation using administrative claims data. Am J Manag Care. 2004;10(11 Pt 1):783–90. [PubMed] [Google Scholar]
- 8.Katz N, Panas L, Kim M, Audet AD, Bilansky A, Eadie J, et al. Usefulness of prescription monitoring programs for surveillance--analysis of Schedule II opioid prescription data in Massachusetts, 1996–2006. Pharmacoepidemiol Drug Saf. 2010;19(2):115–23. doi: 10.1002/pds.1878. [DOI] [PubMed] [Google Scholar]
- 9.White AG, Birnbaum HG, Schiller M, Tang J, Katz NP. Analytic models to identify patients at risk for prescription opioid abuse. Am J Manag Care. 2009;15(12):897–906. [PubMed] [Google Scholar]
- 10.Wilsey BL, Fishman SM, Gilson AM, Casamalhuapa C, Baxi H, Lin TC, et al. An analysis of the number of multiple prescribers for opioids utilizing data from the California Prescription Monitoring Program. Pharmacoepidemiol Drug Saf. 2011;20(12):1262–8. doi: 10.1002/pds.2129. [DOI] [PMC free article] [PubMed] [Google Scholar]
- 11.Wilsey BL, Fishman SM, Gilson AM, Casamalhuapa C, Baxi H, Zhang H, et al. Profiling multiple provider prescribing of opioids, benzodiazepines, stimulants, and anorectics. Drug Alcohol Depend. 2010;112(1–2):99–106. doi: 10.1016/j.drugalcdep.2010.05.007. [DOI] [PubMed] [Google Scholar]
- 12.Peirce GL, Smith MJ, Abate MA, Halverson J. Doctor and pharmacy shopping for controlled substances. Med Care. 2012;50(6):494–500. doi: 10.1097/MLR.0b013e31824ebd81. [DOI] [PubMed] [Google Scholar]
- 13.Gilson AM, Fishman SM, Wilsey BL, Casamalhuapa C, Baxi H. Time Series Analysis of California’s Prescription Monitoring Program: Impact on Prescribing and Multiple Provider Episodes. J Pain. 2012;13(2):103–11. doi: 10.1016/j.jpain.2011.09.006. [DOI] [PMC free article] [PubMed] [Google Scholar]
- 14.Han H, Kass PH, Wilsey BL, Li CS. Individual and county-level factors associated with use of multiple prescribers and multiple pharmacies to obtain opioid prescriptions in California. PLoS One. 2012;7(9):e46246. doi: 10.1371/journal.pone.0046246. [DOI] [PMC free article] [PubMed] [Google Scholar]
- 15.Population Division of U.S. Census Bureau. State Single Year of Age and Sex Population Estimates: April 1, 2000 to July 1, 2009 - RESIDENT. 2010. [Google Scholar]
- 16.Korff MV, Saunders K, Thomas Ray G, Boudreau D, Campbell C, Merrill J, et al. De facto long-term opioid therapy for noncancer pain. Clin J Pain. 2008;24(6):521–7. doi: 10.1097/AJP.0b013e318169d03b. [DOI] [PMC free article] [PubMed] [Google Scholar]
- 17.Campbell CI, Weisner C, Leresche L, Ray GT, Saunders K, Sullivan MD, et al. Age and gender trends in long-term opioid analgesic use for noncancer pain. Am J Public Health. 2010;100(12):2541–7. doi: 10.2105/AJPH.2009.180646. [DOI] [PMC free article] [PubMed] [Google Scholar]
- 18.Franklin GM, Mai J, Wickizer T, Turner JA, Fulton-Kehoe D, Grant L. Opioid dosing trends and mortality in Washington State workers’ compensation, 1996–2002. Am J Ind Med. 2005;48(2):91–9. doi: 10.1002/ajim.20191. [DOI] [PubMed] [Google Scholar]
- 19.Sullivan MD, Edlund MJ, Fan MY, Devries A, Brennan Braden J, Martin BC. Trends in use of opioids for non-cancer pain conditions 2000–2005 in commercial and Medicaid insurance plans: the TROUP study. Pain. 2008;138(2):440–9. doi: 10.1016/j.pain.2008.04.027. [DOI] [PMC free article] [PubMed] [Google Scholar]
- 20.Boudreau D, Von Korff M, Rutter CM, Saunders K, Ray GT, Sullivan MD, et al. Trends in long-term opioid therapy for chronic non-cancer pain. Pharmacoepidemiol Drug Saf. 2009;18(12):1166–75. doi: 10.1002/pds.1833. [DOI] [PMC free article] [PubMed] [Google Scholar]
- 21.American Chronic Pain Association. Coping with Chronic Pain. 1995. [Google Scholar]
- 22.National Center for Health Statistics. Health, United States. Special Feature on Pain With Chartbook on Trends in the Health of Americans 2006. 2006. [PubMed] [Google Scholar]
- 23.Institute of Medicine. Relieving Pain in America: A Blueprint for Transforming Prevention, Care, Education, and Research. Washington, DC: The National Academies Press; 2011. [PubMed] [Google Scholar]
- 24.Freburger JK, Holmes GM, Agans RP, Jackman AM, Darter JD, Wallace AS, et al. The rising prevalence of chronic low back pain. Arch Intern Med. 2009;169(3):251–8. doi: 10.1001/archinternmed.2008.543. [DOI] [PMC free article] [PubMed] [Google Scholar]
- 25.Braden JB, Fan MY, Edlund MJ, Martin BC, DeVries A, Sullivan MD. Trends in use of opioids by noncancer pain type 2000–2005 among Arkansas Medicaid and HealthCore enrollees: results from the TROUP study. J Pain. 2008;9(11):1026–35. doi: 10.1016/j.jpain.2008.06.002. [DOI] [PMC free article] [PubMed] [Google Scholar]
- 26.American Academy of Pain Medicine and American Pain Society. The use of opioids for the treatment of chronic pain. A consensus statement from the American Academy of Pain Medicine and the American Pain Society. Clin J Pain. 1997;13(1):6–8. [PubMed] [Google Scholar]
- 27.American Society of Anesthesiologists. Practice guidelines for chronic pain management. A report by the American Society of Anesthesiologists Task Force on Pain Management, Chronic Pain Section. Anesthesiology. 1997;86(4):995–1004. [PubMed] [Google Scholar]
- 28.Medical Board of California. Guidelines for Prescribing Controlled Substances for Pain (Adopted unanimously by the Medical Board on July 29, 1994 and August 1, 2003. 2003. [Google Scholar]
- 29.The Board of Pharmacy of California. Prescribing and Dispensing Controlled Substance Prescription Forms (Timeline for Major Changes to California Prescribing Laws) [Google Scholar]
- 30.Helme Robert D, Gibson Stephen J. 8 Pain in Older People. In: Crombie IK, editor. Epidemiology of Pain. Seattle, WA: IASP Press; 1999. pp. 103–112. [Google Scholar]
- 31.Substance Abuse and Mental Health Services Administration OoAS. Results from the 2007 National Survey on Drug Use and Health: National Findings. Rockville, MD: 2008. [Google Scholar]
- 32.Dunn KM, Saunders KW, Rutter CM, Banta-Green CJ, Merrill JO, Sullivan MD, et al. Opioid prescriptions for chronic pain and overdose: a cohort study. Ann Intern Med. 2010;152(2):85–92. doi: 10.1059/0003-4819-152-2-201001190-00006. [DOI] [PMC free article] [PubMed] [Google Scholar]
- 33.National Center for Injury Prevention and Control CfDCaP. Unintentional drug poisoning in the United States. 2010. [Google Scholar]
- 34.Lacy Gareth. News Release: Brown To Launch Online Technology To Fight Prescription Drug Abuse. 2008. [Google Scholar]