

Abstract
Studies of oxidative damage during the progression of Alzheimer’s disease (AD) suggest its central role in disease pathogenesis. To investigate levels of nucleic acid oxidation in both early and late stages of AD, levels of multiple base adducts were quantified in nuclear and mitochondrial DNA from the superior and middle temporal gyri (SMTG), inferior parietal lobule (IPL), and cerebellum (CER) of age-matched normal control subjects, subjects with mild cognitive impairment, preclinical AD, late-stage AD, and non-AD neurological disorders (diseased control; DC) using gas chromatography/mass spectrometry. Median levels of multiple DNA adducts in nuclear and mitochondrial DNA were significantly (P ≤ 0.05) elevated in the SMTG, IPL, and CER in multiple stages of AD and in DC subjects. Elevated levels of fapyguanine and fapyadenine in mitochondrial DNA suggest a hypoxic environment early in the progression of AD and in DC subjects. Overall, these data suggest that oxidative damage is an early event not only in the pathogenesis of AD, but is also present in neurodegenerative diseases in general.
Keywords: nuclear DNA, mitochondrial DNA, mild cognitive impairment, preclinical Alzheimer’s disease, Alzheimer’s disease, neurodegenerative diseases
Alzheimer’s disease (AD) is characterized by an insidious onset and progressive cognitive decline (reviewed in (Yaari and Corey-Bloom, 2007)). Altered cellular biomolecules and processes in early and late stages of AD include altered gene expression, increased protein oxidation, altered enzymatic activity, formation of nucleic acid adducts, and lipid peroxidation (reviewed in (Markesbery, 1997; Moreira et al., 2005; Smith et al., 2000)). Although multiple hypotheses have been proposed to explain the progression of AD, no single hypothesis to date can explain both the clinical and pathological features of this multi-faceted disease.
One hypothesis of particular interest, the oxidative damage hypothesis, is an extension of the oxidative stress hypothesis of aging proposed by Harman (Harman, 1956). Increased generation and/or prolonged exposure to reactive oxygen species (ROS) including superoxide(O2·−), hydrogen peroxide (H2O2), hydroxyl radicals (OH·), lipid oxyl or peroxyl radicals (ROO·), singlet oxygen and peroxinitrite (NOOO−) may lead to potentially severe cellular consequences. Although it is unclear if elevated levels of ROS are the result of increased generation or reduced efficiency in elimination, or a combination of both, the resulting interaction of ROS with biomacromolecules may lead to disruption of cellular homeostasis and ultimately cell death.
The oxidative damage hypothesis is thought to play a role in multiple neurodegenerative disease due to the sensitized nature of the brain resulting from its high energy demand and limited antioxidant defense mechanisms compared to other tissues (Markesbery, 1997). Electron leakage during oxidative phosphorylation resulting in formation of the superoxide radical in mitochondria is thought to be the primary source of endogenous free radical generation (Ernster and Schatz, 1981). Increased oxidative damage of mitochondrial DNA (mtDNA) is attributed to the close proximity to ROS generation, the absence of protective histones, and relatively limited repair mechanisms (Ames et al., 1993; Wallace, 1992). Decreased glucose consumption and depletion of cellular energy, noted in the earliest stages of AD, is thought to be a direct result of ROS mediated damage to mitochondria (Arnaiz et al., 2001; Drzezga et al., 2003; Fukuyama et al., 1994). Additional processes including the iron catalyzed Fenton reaction leading to generation of superoxide (Imam et al., 2006) and the Haber-Weiss reaction leading to generation of hydroxyl radicals (Mello Filho and Meneghini, 1984) may also contribute to radical mediated damage.
Multiple lines of research have sought to quantify by-products and identify secondary effects of ROS-mediated damage to biomacromolecules in AD. Collectively these studies suggest that oxidative damage to lipids, proteins, DNA, and RNA may play a role in the pathogenesis of AD. In particular, deoxyribonucleic acids (DNA) including nuclear DNA (nDNA) and mtDNA, are susceptible to hydroxyl radical mediated damage resulting in over 20 potential adducts (Cooke et al., 2003). Oxidation of guanosine at the C8 position results in the formation of 8-hydroxy-2′-deoxyguanosine (8-OHdG), the most commonly studied biomarker of nucleic acid oxidation. Previous studies demonstrate multiple nucleic acid adducts, including increased levels of oxidized guanine in both nDNA and mtDNA in early and late stage AD (de la Monte et al., 2000; Gabbita et al., 1998; Lovell et al., 1999; Lyras et al., 1997; Mecocci et al., 1994; Mecocci et al., 1993; Wang et al., 2006; Wang et al., 2005). Furthermore, protein levels of 8-oxo-guanine glycosylase 1 (OGG1), the primary enzyme responsible for excision of 7, 8-dihydro-8-oxoguanine, were reduced (Iida et al., 2002; Nakabeppu et al., 2004) as were OGG1 activities in AD (Mao et al., 2007; Shao et al., 2008; Weissman et al., 2007).
ROS-mediated damage during the earliest clinical phase of AD, mild cognitive impairment (MCI), and in late-stage AD (LAD) has been widely studied. However, there has been limited study of subjects during the earliest pathological phase of disease progression, preclinical AD (PCAD). Clinically, PCAD subjects were undistinguishable from normal control subjects based on neuropsychology evaluations (Schmitt et al., 2000; Schmitt et al., 2012). However, pathological evaluation revealed pronounced AD associated pathology to an extent that these subjects meet the intermediate or high likelihood criteria for the histopathological diagnosis of AD by National Institute on Aging Reagan Institute (NIA-RI) criteria (Schmitt et al., 2000).
To fully characterize the extent of nucleic acid oxidation in both nDNA and mtDNA during both the early stages and progression of AD, levels of multiple nucleic acid adducts were quantified from two vulnerable brain regions, the superior and middle temporal gyri (SMTG) and inferior parietal lobule (IPL), and a non-vulnerable brain (cerebellum; CER) of subjects with MCI, PCAD, LAD, and age-matched normal control subjects (NC) by gas chromatography mass spectrometry (GC/MS) operated in selective ion monitoring mode. To determine if oxidized damage is specific to AD levels, DNA oxidation was quantified in the same brain regions from diseased control (DC) subjects with either frontotemporal dementia (FTD) or dementia with Lewy bodies (DLB).
Materials and Methods
Brain Specimen Sampling
Short postmortem interval (PMI) autopsy brain specimens were obtained from the Neuropathology Core of the University of Kentucky Alzheimer’s Disease Center (UK-ADC) from 7 subjects with MCI (2 men [M]: 5 women [W]), 14 PCAD subjects (3 M: 11 W), 15 LAD subjects (7 M: 8 W), 6 DLB subjects (4 M: 2 W), 6 FTD subjects (3 M: 3 W), and 15 age-matched NC subjects (4 M: 11 W). The specimens were flash frozen in liquid nitrogen at autopsy and maintained at −80°C until processed for analysis.
All subjects were characterized as previously described (Bradley et al., 2010; Bradley et al., 2012; Lovell et al., 2011) based on existing criteria for MCI (Petersen et al., 1999), PCAD (Schmitt et al., 2000; Schmitt et al., 2012), and LAD (Hyman et al., 2012; Montine et al., 2012). Postmortem DLB pathology was characterized by the presence of ubiquitin and α-synuclein positive Lewy bodies (LB) and by ubiquitin positive Lewy neurites (LN) in a semi-quantitative grading density in paralimbic and neocortical structures. The diagnosis of DLB was made according to the current guidelines proposed by the International Workshop for the Consensus Guidelines for the Clinical and Pathological Diagnosis of DLB (McKeith et al., 2005; McKeith et al., 1996). Postmortem DLB was characterized by symmetric focal atrophy of the frontal and/or temporal lobes, atrophy of the basal ganglia, and loss of pigmentation in the substantia nigra. Hematoxylin and eosin (H&E) staining of the cerebral cortex highlight microvacuolation and neuron loss, whereas immunostaining for α-B-crystallin reveal swollen cortical neurons. Pathological diagnosis of FTD is based on current standards (Cairns et al., 2007; Neary et al., 1998). NP and Braak staging scores were provided by the Neuropathology Core of the UK-ADC. Tissue samples used for analyses were obtained under University of Kentucky Institutional Review Board (IRB) approved protocols.
nDNA Isolation
Tissue samples were prepared as described by Timmons et al. (Timmons et al., 2011). nDNA was isolated from nuclear fractions as described Wang et al. (Wang et al., 2006; Wang et al., 2005) and dissolved in autoclaved distilled/deionized water and the concentration and purity determined using a NanoDrop 1000 Spectrophotometer (NanoDrop, Wilmington, DE, USA).
mtDNA Isolation
Enriched mitochondria were isolated as previously described (Timmons et al., 2011) and mtDNA was isolated as previously described by Wang et al. (Wang et al., 2006; Wang et al., 2005). Isolated mtDNA was dissolved in autoclaved distilled/deionized water and the concentration and purity determined using a NanoDrop 1000 Spectrophotometer.
Western Blotting of Nuclear, Cytoplasmic, and Mitochondrial Isolates
Mitochondrial purity was assessed by Western blot analysis of representative total- (TF), nuclear- (NF), cytosolic- (CF) and mitochondrial- (MF) fractions were probed with anti-lamin B (nuclear Marker; Santa Cruz Biotechnology, Santa Cruz, CA, USA), anti-MAP2 (cytosolic marker; Abcam, Cambridge, MA, USA), and anti-porin (mitochondrial marker; EMD Chemical, Gibbstown, NJ, USA) as previously described (Timmons et al., 2011).
Polymerase Chain Reaction of Mitochondrial DNA and Nuclear DNA
Mitochondrial DNA purity was assessed by PCR amplification of APOE, a nuclear-coded protein and a mitochondria-coded protein NADH dehydrogenase 2 (MT-ND2) in both nDNA and mtDNA (500 ng) using a GoTaq PCR Core System (Promega, 3Madison, WI, USA). Primer sequences utilized were as previously described for APOE by Tsukamoto et al. (Tsukamoto et al., 1993) and MT-ND2 by Dzitoyeva et al. (Dzitoyeva et al., 2012) and were prepared by IDT (Integrated Device Technology, Santa Clara, CA, USA). PCR products were separated on a 2% low-melt agarose gel containing ethidium bromide as previously described (Addya et al., 1997).
nDNA and mtDNA Derivatization
nDNA (200 μg) or mtDNA (10 μg) were prepared for GC/MS analysis as previously described by Wang et al (Wang et al., 2006; Wang et al., 2005). Ten nmol of each stable-labeled internal standard: 8-[8-13C, 7, 9-15N2] hydroxyguanine; 8-[8-13C, 6, 9-diamino-15N2] hydroxyadenine; 5-[2-13C, 1, 3-15N2] hydroxycytosine; [formyl-13C, diamino-15N2] fapyadenine; [formyl-13C, diamino-15N2] fapyguanine were added for quantification of oxidized bases.
Gas Chromatography/Mass Spectrometry (GC/MS) with Selective Ion Monitoring
Derivatized samples were analyzed using an Agilent 7890A gas chromatograph on a HP-5ms capillary column (0.25 mm internal diameter, 0.25 μm film thickness, and 30-m length; Hewlett Packard, Palo Alto, CA, USA) as previously described by Wang et al. (Wang et al., 2006; Wang et al., 2005). Derivatized nitrogenous base spectra were acquired in selective ion monitoring mode at the following m/z ratios: 443 8-[8-13C,7,9-15N2] hydroxyguanine and 440 8-hydroxyguanine (8OHG); 445 [formyl-13C, diamino-15N2] fapyguanine and 442 fapyguanine (FapyG); 355 8-[8-13C,6,9-diamino-15N2] hydroxyadenine and 352 8-hydroxyadenine (8OHA); 357 [formyl-13C, diamino-15N2] fapyadenine and m/z 354 fapyadenine (FapyA); and 331 5-[2-13C,1,3-15N2] hydroxycytosine and m/z 328 5-hydroxycytosine (5OHC). Instrument response plots of integrated peak of stable-labeled analyte signal were determined over a range of 0.5 nmol to 100 nmol per stable labeled isotope standard. The integrated area of each analyte signal was normalized with respect to the integrated area of the corresponding internal standards for all samples and corrected based on instrument response plots for a given internal standard.
Measurement of Aβ1–40 and Aβ1–42 levels
Total levels of Aβ and Aβ1–42 in PBS-soluble, SDS-soluble, and FA-soluble were provided by the Sanders-Brown Center on Aging Amyloid Core as previously described (Beckett et al., 2010; Das et al., 2003; LeVine, 2004; Levites et al., 2006; Murphy, 2007; Weidner et al., 2011) for the SMTG and IPL.
Statistics
All data were tested for normality using the Wilkes-Shapiro test. Levels of oxidized nDNA nucleic acid adducts, mtDNA nucleic acid adducts, and Braak staging scores demonstrated non-normal distributions and were analyzed using the Mann-Whitney U-test and are reported as median values with range. All other data including, age and PMI, demonstrated a normal distribution age and are reported as mean ± standard error of mean (SEM). No significant differences were observed between FTD and DLB subjects and the two neurodegenerative diseases were pooled to create a diseased control (DC) subject pool. All statistical comparisons were carried out using Sigma Plot. Statistical significance was set at p ≤ 0.05 and trending toward significance was set at p ≤ 0.1.
The magnitude of Pearson’s correlation (r) value was determined for levels of nucleic acid adducts and NFT and NP counts, and levels of PBS-, SDS-, and FA- soluble Aβ1–40 and Aβ1–42. Type one errors arising from multiple comparisons per brain region studied were corrected using the Bonferroni method with the corrected p-values being: 0.0045 for SMTG, 0.00625 for IPL, and 0.0045 for CER.
Results
Western blot analysis of representative samples of total- (TF), nuclear- (NF), cytosolic- (CF) and mitochondrial-fractions (MF) for lamin B, a nuclear protein, MAP2, a cytosolic protein, and porin, a mitochondrial transport protein, showed no cross contamination of proteins between the nuclear, cytosolic, and mitochondrial fractions (Fig. 1A, 1B, and 1C). PCR amplification of APOE and MT-ND2 from nDNA and mtDNA from a representative subject in each brain region studied showed APOE was only observed for nDNA fractions (Fig. 1D), whereas MT-ND2 amplification was only detected in mtDNA fractions (Fig. 1E).
Figure 1. Purity of nDNA and mtDNA.
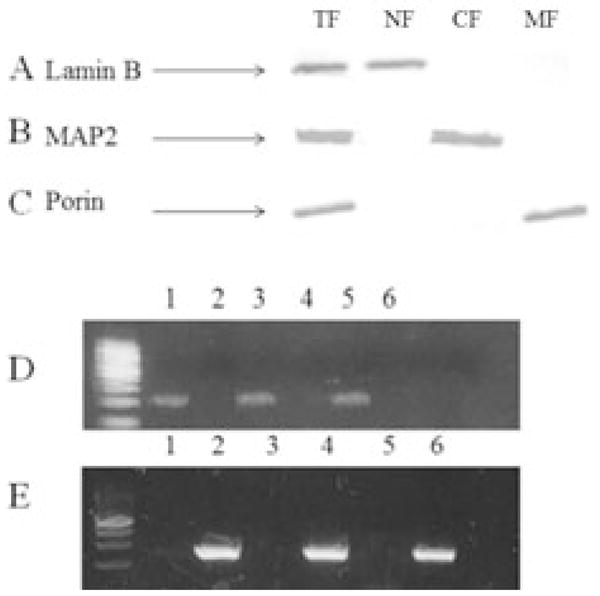
Representative Western blot analysis of total-(TF; Row 1), nuclear- (NF; Row 2), cytosolic- (CF; Row 3), and mitochondrial-fractions (NF; Row 4) probed for Lamin B a nuclear envelope protein (A), MAP2 a microtubular associated protein (B), and Porin a voltage dependent anion channel found on the outer membrane of the mitochondria (C). Representative PCR amplification product of APOE (D) and MT-ND2 (E) of mtDNA (Lane 1) and nDNA (Lane 2) from SMTG, mtDNA (Lane 3) and nDNA (Lane 4) from IPL, mtDNA (Lane 5) and nDNA (Lane 6) from CER.
Subject demographic data are shown in Table 1. There were no significant differences in PMI or age of subjects except for a significant (p < 0.05) increase in the age of PCAD (85.8 ± 1.7 y), MCI subjects (91.0 ± 1.9 y), and NC subjects (86.3 ± 1.4 y) compared to DC subjects (68.9 ± 16.6 y) and a significant increase in the age of MCI subjects compared to LAD subject (80.4 ± 1.4 y). Median Braak staging scores were significantly higher for PCAD (V), MCI (IV), LAD (VI), and DC subjects (II) compared to NC subjects (I).
Table 1.
Subject demographic
| Group | Mean ± SEM age (years) | Sex | Mean ± SEM PMI (h) | Median Braak Score |
|---|---|---|---|---|
| NC | 86.3 ± 1.4 | N=15; 4M, 11W | 2.8 ± 0.2 | I |
| PCAD | 85.8 ± 1.7a | N=14; 3M, 11W | 2.8 ± 0.2 | Vc |
| MCI | 91.0 ± 1.9a,b | N=7; 2M, 5W | 2.6 ± 0.2 | IVc |
| LAD | 80.8 ± 1.4a | N=15; 7M, 8W | 3.6 ± 0.4 | VIc |
| DC | 68.9 ± 4.8 | N=12; 7M, 5W | 3.5 ± 0.4 | IIc |
p < 0.05 compared to DC
p < 0.05 compared to LAD
p ≤ 0.05 compared to NC
NC = age –matched normal control; MCI = mild cognitive impairment; PCAD = preclinical Alzheimer’s disease; LAD = late-stage Alzheimer’s disease; DC = diseased control; PMI=postmortem interval;
Three replicate analyses were performed to determine the dynamic range of internal stable isotope labeled standards. Positive significant correlations were observed between the instrument response and concentration (base level) for each base over a range of 25 μM to 5 mM. In addition, bases were well separated with the following retention times: 8-[8-13C, 7, 9-15N2] hydroxyguanine (r = 0.99; 47.2 min), [formyl-13C, diamino-15N2] fapyguanine (r = 0.99; 42.2 min), 8-[8-13C, 6, 9-diamino-15N2] hydroxyadenine (r = 0.97; 34.6 min), [formyl-13C, diamino-15N2] fapyadenine (r = 0.99; 29.3 min), 5-[2-13C, 1, 3-15N2] hydroxycytosine (r = 0.99; 23.5 min). For quantitative purposes, the dominant daughter ion for each oxidized nucleic acid adduct was monitored. To illustrate the percentage of change, levels of nucleic acid oxidation are expressed levels as median [range] % of NC subjects.
Median levels of oxidized nucleic acids measured in each identifiable stage of AD progression and in DC subjects in nDNA are shown in Table 2. No significant differences in median fold change were detected for FapyA, or 5OHC in SMTG, IPL, or CER.
Table 2.
Levels of Oxidized Nucleic Acid Base Adducts in nuclear DNA expressed as % of NC (Median [Range])
| Brain Region | ||||
|---|---|---|---|---|
|
| ||||
|
|
|
|
|
|
| 8OHG | NC | 100.0 [37.4–337.9] | 100.0 [40.7–184.3] | 100.0 [45.6–126.2] |
| PCAD | 492.8 [118.9–4751.5]** | 605.6 [97.5–1873.3]** | 204.7 [83.1–323.3]** | |
| MCI | 156.1 [78.4–1110.2] | 444.5 [212.7–759.3]** | 89.9 [73.0–110.5] | |
| LAD | 377.5 [101.9–2140.5]** | 107.7 [57.5–1003.5] | 249.3 [72.9–406.0]*** | |
| DC | 219.0 [62.4–2226.7]*** | 105.7 [39.9–352.3] | 419.2 [160.7–928.0]** | |
|
| ||||
| FapyG | NC | 100.0 [57.3–235.0] | 100.0 [71.7–133.8] | 100.0 [28.1–205.4] |
| PCAD | 145.1 [85.0–455.8]* | 106.1 [61.8–286.7] | 105.3 [53.9–225.9] | |
| MCI | 173.6 [59.0–197.6] | 106.8 [30.8–167.5] | 106.6 [71.3–225.0] | |
| LAD | 141.9 [84.3–294.5]* | 91.3 [41.5–169.0] | 110.3 [79.3–214.7] | |
| DC | 100.4 [56.5–245.8] | 93.3 [44.3–172.6] | 134.3 [77.0–177.6] | |
|
| ||||
| 8OHA | NC | 100. [40.2–556.5] | 100.0 [31.2–206.8] | 100.0 [29.0–200.1] |
| PCAD | 329.1 [95.8–1143.6]** | 245.3 [95.1–1572.2]** | 373.5 [60.9–518.6]** | |
| MCI | 119.7 [73.1–171.8] | 308.4 [184.0–398.5]** | 85.0 [22.2–136.0] | |
| LAD | 111.7 [43.9–373.7] | 194.3 [122.6–1469.2]** | 248.3 [44.8–1280.3]*** | |
| DC | 122.0 [58.4–256.4] | 356.0 [124.4–629.6]** | 135.3 [37.5–386.2]** | |
|
| ||||
| FapyA | NC | 100.0 [53.4–149.9] | 100.0 [52.6–343.6] | 100.0 [53.5–212.4] |
| PCAD | 99.0 [58.0–205.5] | 78.1 [29.4–159.2] | 153.4 [86.6–172.8] | |
| MCI | 94.6 [72.8–111.4] | 111.6 [35.7–214.5] | 126.8 [67.6–194.9] | |
| LAD | 106.7 [45.5–210.7] | 104.7 [29.5–158.7] | 129.8 [55.2–174.8] | |
| DC | 134.7 [82.5–241.1] | 77.8 [30.6–146.5] | 157.4 [19.9–228.1] | |
|
| ||||
| 5OHC | NC | 100.0 [48.9–128.1] | 100.0 [64.7–204.3] | 100.0 [46.5–710.0] |
| PCAD | 104.7 [44.9–209.7] | 132.1 [49.2–355.9] | 286.9 [76.2–789.1] | |
| MCI | 85.7 [65.3–110.9] | 164.0 [44.9–345.0] | 187.0 [48.8–789.1] | |
| LAD | 87.2 [59.6–211.7] | 80.4 [56.0–166.1] | 127.9 [61.4–127.9] | |
| DC | 96.6 [44.9–153.4] | 84.4 [34.2–177.9] | 105.4 [29.5–354.1] | |
p ≤ 0.1 compared to NC
p ≤ 0.005 compared to NC
p ≤ 0.05 compared to NC
Significant (p ≤ 0.05) elevations in median levels of 8OHG were detected in SMTG of PCAD, LAD, and DC subjects compared to NC subjects. Although there was no significant difference in median levels of FapyG in the SMTG, levels were trending toward significance (p ≤ 0.1) in PCAD and LAD compared to NC subjects. In contrast, significant (p ≤ 0.05) increases in median levels of 8OHG were detected in intermediate stages of AD progression (PCAD and MCI) but not in LAD or DC subjects compared to NC subjects in the IPL. In the CER, significant (p ≤ 0.05) elevations in levels of 8OHG were detected in PCAD, LAD, and DC subjects, but not MCI subjects, compared to NC subjects. Median levels of FapyG were not significantly different in any disease stage or DC subjects in any brain region studied. However, median levels of FapyG were increased and trending toward significance (p ≤ 0.1) in PCAD and LAD subjects compared to NC subjects in the SMTG. Median levels of 8OHA were significantly (p ≤ 0.005) increased in PCAD subjects compared to NC subjects. In contrast, median levels of 8OHA were significantly (p ≤ 0.05) elevated in all stages of AD progression (PCAD, MCI, and LAD subjects) as well as DC subjects in the IPL compared to NC subjects. Furthermore, median levels of 8OHA were significantly (p ≤ 0.05) elevated in the CER PCAD, LAD, and DC subjects compared to NC subjects.
Median levels of oxidized nucleic acids in each identifiable stage of AD progression and diseased control subjects in mtDNA are shown in Table 3. Significant (p ≤ 0.05) elevations of 8OHG in mtDNA were detected in the SMTG of MCI and LAD subjects and were trending toward significance (p ≤ 0.1) in PCAD or DC subjects compared to NC subjects. In contrast, significant (p ≤ 0.05) elevations of 8OHG in the IPL were detected in PCAD, LAD, and DC subjects, but not MCI subjects, compared to NC subjects. In the CER, significant (p ≤ 0.05) elevations of 8OHG were detected in LAD and DC subjects compared to NC subjects. Significant (p < 0.05) increases in FapyG were more widespread compared to levels of 8OHG. In the SMTG, significantly (p ≤ 0.05) increased levels of FapyG were detected in PCAD, MCI, LAD, and DC subjects compared to NC subjects. In contrast, in the IPL significantly (P ≤ 0.05) elevated levels of FapyG were detected in PCAD, LAD, and DC subjects compared to NC subjects. In the CER significantly (P ≤ 0.05) elevated levels of FapyG were detected in PCAD, MCI, LAD, and DC subjects compared to NC subjects.
Table 3.
Levels of Oxidized Nucleic Acid Base Adducts in mitochondrial DNA expressed as % of NC (Median [Range])
| Brain Region | ||||
|---|---|---|---|---|
|
| ||||
|
|
|
|
|
|
| 8OHG | NC | 100.0 [30.3–144.1] | 100.0 [51.6–194.3] | 100.0 [70.4–176.1] |
| PCAD | 141.2 [84.1–241.8]* | 313.5 [102.1–665.1]** | 86.8 [28.6–353.8] | |
| MCI | 201.3 [119.5–340.1]** | 153.8 [54.0–386.7] | 83.8 [57.7–222.5] | |
| LAD | 182.0 [121.3–295.0]** | 361.2 [209.6–837.9]** | 186.8 [140.9–330.1]** | |
| DC | 132.2 [90.0–327.8]* | 250.1 [56.7–417.8]*** | 376.7 [100.8–976.7]** | |
|
| ||||
| FapyG | NC | 100.0 [90.1–156.2] | 100.0 [79.6–172.7] | 100.0 [53.8–142.1] |
| PCAD | 110.9 [88.0–163.4]*** | 164.6 [75.0–230.7]** | 136.9 [34.8–311.5]*** | |
| MCI | 121.3 [90.1–156.2]** | 138.1 [115.7–157.2] | 187.0 [137.8–214.2]** | |
| LAD | 129.2 [115.6–186.0]** | 192.0 [136.8–272.0]** | 180.0 [117.6–266.8]** | |
| DC | 112.5 [87.2–193.6]*** | 191.4 [164.8–367.7]** | 194.5 [124.3–220.5]** | |
|
| ||||
| 8OHA | NC | 100.0 [65.2–129.5] | 100.0 [36.3–181.0] | 100.0 [73.9–307.2] |
| PCAD | 154.7 [90.9–280.2]** | 319.1 [205.7–415.1]** | 98.4 [55.9–292.2] | |
| MCI | 170.7 [128.0–213.5]** | 293.5 [155.4–372.9]** | 80.9 [56.3–135.6] | |
| LAD | 141.4 [117.9–276.9]** | 537.5 [278.0–651.4]** | 153.7 [103.5–295.5]** | |
| DC | 162.0 [120.5–262.7]** | 532.4 [289.9–693.8]** | 185.2 [121.4–300.4]** | |
|
| ||||
| FapyA | NC | 100.0 [48.5–153.0] | 100.0 [70.3–175.7] | 100.0 [70.3–226.1] |
| PCAD | 127.7 [97.2–177.6]** | 131.8 [109.6–236.6]** | 144.4 [70.6–320.8]* | |
| MCI | 116.9 [70.7–203.1] | 134.0 [87.1–220.8] | 82.7 [45.1–211.2] | |
| LAD | 130.1 [82.1–163.7]** | 158.0 [115.6–219.6]** | 175.3 [140.4–347.0]** | |
| DC | 123.4 [66.0–183.5]* | 145.2 [75.8–212.7]* | 160.1 [93.8–256.8]** | |
|
| ||||
| 5OHC | NC | 100.0 [36.0–130.7] | 100.0 [65.5–201.3] | 100.0 [47.1–256.3] |
| PCAD | 129.9 [96.8–191.5]** | 90.7 [62.2–120.8] | 104.2 [54.4–168.5] | |
| MCI | 113.5 [96.8–143.8] | 121.5 [75.6–260.5] | 87.2 [49.3–104.9] | |
| LAD | 122.5 [90.4–191.8]** | 88.4 [48.4–153.9] | 76.4 [50.9–105.8] | |
| DC | 102.4 [91.5–200.5]* | 95.8 [66.4–169.4] | 107.9 [79.1–129.1] | |
p ≤ 0.1 compared to NC
p ≤ 0.005 compared to NC
p ≤ 0.05 compared to NC
Median levels of 8OHA were significantly (p ≤ 0.05) increased in PCAD, MCI, LAD, and DC subjects compared to NC subjects in both the SMTG and IPL. In the CER, significantly (p ≤ 0.05) increased levels of 8OHA were detected in LAD and DC subjects compared to NC subjects. Median levels of FapyA in the SMTG and the IPL were significantly (p ≤ 0.05) elevated in PCAD and LAD subjects and were trending toward significance (p ≤ 0.1) in DC subjects compared to NC subjects. In the CER, significant (p ≤ 0.05) increases in median levels of FapyG were detected in LAD and DC subjects and were trending toward significance (p ≤ 0.1) in PCAD subjects compared to NC subjects.
Median levels of 5OHC in the SMTG were significantly (p ≤ 0.05) increased in PCAD and LAD subjects and were trending toward significance (p ≤ 0.1) in DC subjects compared to NC subjects. In contrast, median levels of 5OHC were not significantly altered in either the IPL or CER for any of the subjects studied.
In the SMTG there were significant positive correlations between NFT counts and median levels of 8OHG in nDNA (r = 0.482: p = 0.0003), NP counts and median levels of 8OHG in mtDNA (r =0.436: p = 0.003) and FapyG in mtDNA (r = 0.512: p = 0.00003). Median levels of FapyG in mtDNA showed significant positive correlations with both SDS-soluble Aβ1–40 (r = 0.541: p = 0.0008) and SDS-soluble Aβ1–42 (r = 0.525: p = 0.001). Levels of FA-soluble Aβ1–42 showed a significant positive correlation with median levels of 8OHG in nDNA (r = 0.462: p = 0.004).
NFT counts and median levels of fold change of 8OHG (r = 0.349: p = 0.006) and 8OHA (r = 0.473: p = 0.0003) demonstrated significant positive correlations for mtDNA in the IPL. Additionally, there were significant positive correlation between NP counts and median levels of 8OHG (r = 0.335: P = 0.001) and 8OHA (r = 0.505: P = 0.00008) in mtDNA. Median levels of 8OHA in mtDNA showed a positive significant correlation with FA soluble Aβ1–42 (r = 0.636: P = 0.004).
Discussion
Although the study of oxidative damage in AD is extensive, the etiology of the disease remains elusive. Studies are limited by difficulties in early ante-mortem detection and the continuous nature of disease progression, as well as the multiple potential causes underlying progression. In the current study subjects from two distinct intermediate stages, an early pathological stage (PCAD), a likely prodromal stage, and the earliest detectable clinical stage (MCI) were characterized in parallel with LAD subjects across multiple brain regions. Additionally, to access the potential involvement of oxidative damage not only in AD progression, but additional neurodegenerative diseases in general FTD and DLB subjects were included as DC subjects.
We measured oxidized DNA adducts because previous studies showed significant changes between NC subjects and LAD subjects. Furthermore, previous studies showed oxidized thymine, (5, 6-dihydroxythymine) is generally below the minimum detection limit and was therefore not quantified (Gabbita et al., 1998). The current study is the first to quantify levels of multiple oxidized nucleic acids in nDNA and mtDNA throughout the progression of AD as well as in DC subjects (DLB and FTD). While nucleic acid sample pools were analyzed separately, subjects from each group and multiple brain regions were analyzed concurrently minimizing potential biases in analysis. Although levels of nucleic acid adducts were determined from isolates of bulk tissues composed of a mixture of glia, neurons, and vasculature, immunohistochemical studies by Nunomura et al. (Nunomura et al., 1999) demonstrated that 8-hydroxyguanine immunoreactivity was restricted to neurons.
The absence of MAP2 and porin in the lamin B positive nuclear fraction and the presence of porin and lack of lamin B and MAP2 in the mitochondrial fraction suggest limited cross-contamination between nuclear and mitochondrial fractions during isolation. Furthermore, PCR amplification showed APOE was present only in nDNA samples, whereas the MT-ND2 amplification was observed only in mtDNA samples. Collectively the data suggest little to no cross contamination between nDNA and mtDNA.
An early and persistent criticism of nucleic acid adduct quantification by GC/MS the method used in the current study has been the potential to introduce artefactual oxidation during isolation of DNA as well as the preparation of DNA samples (Cadet et al., 2003; Collins et al., 1997; Halliwell and Dizdaroglu, 1992). However, Wang et al. (Wang et al., 2006) demonstrated that levels of oxidized nucleic acids from nDNA and mtDNA were not significantly different in DNA prepared using the phenol based isolation method or a NaI-based ‘salting out’ method consistent with the findings of Rehamn et al. (Rehman et al., 2000). Furthermore, atmospheric oxygen was excluded during nucleic acid derivatization and carried out at room temperature to minimize artefactual oxidation (Dizdaroglu and Gajewski, 1990; Jenner et al., 1998; Rehman et al., 2000).
It has been postulated that MCI, the earliest clinically identifiable stage in AD should be characterized by nucleic acid oxidation as demonstrated by Nunomura et al. who demonstrated increased RNA oxidation in vulnerable neurons of MCI subjects in temporal cortex pyramidal neurons (Nunomura et al., 2012). However, in the current study of bulk tissue when the disease stages are organized by clinical manifestations rather than pathological progression this is not supported. In the current to previous studies the current data showed not significant elevation of nucleic acid oxidation in subjects with MCI. In the SMTG and IPL levels of oxidized nucleic acid base adducts measured in nDNA and mtDNA were significantly increased in PCAD and LAD subjects but not in MCI subjects. The non-significant increase in MCI maybe a factor of limited subjects, as well as a wide range of oxidized nucleic acid base adducts rather than a phenomenon of the decreased oxidation or increased oxidation repair during this stage of AD progression.
Consistent with previous studies (Gabbita et al., 1999; Lovell et al., 1999; Wang et al., 2005) the current data show median levels of multiple oxidized nucleic acid adducts were significantly in LAD brains in both the nuclear and mitochondrial DNA. In general, median levels of 8-hydroxyguanine were the most pronounced marker in both nDNA and mtDNA. While levels of nucleic acid oxidation were observed in early stages of AD compared to NC subjects, levels were not significantly different compared to LAD subjects in either nDNA or mtDNA. These findings suggest DNA oxidation reaches a peak early in AD without significant elevation later in disease. Additionally, nucleic acid oxidation observed in DC subjects was not significantly different compared to levels of oxidation in AD suggesting that oxidation of nucleic acids is a common feature of neurodegenerative disease.
While previous studies have found significant changes in the levels of FapyG and FapyA in nuclear and mitochondrial DNA in MCI and LAD subjects (Wang et al., 2006; Wang et al., 2005) the current study no significant changes in median levels of FapyG or FapyA in nDNA. However, significant elevations of both FapyG and FapyA were observed in each brain region studied in mtDNA. Increased levels of both Fapy forms are suggestive of a hypoxic environment within the mitochondria. However, levels of FapyG and FapyA were also significantly increased or trending toward significance in each brain in DC subjects. Additionally, there was no significant difference in the median levels in any stage of AD progression and DC subjects. Collectively the data suggest that the hypoxic environment maybe a global brain event that is not AD specific.
The current data are inconsistent with the hypothesis that intraneuronal non-oligomeric Aβ peptide may act as an antioxidant as has been previously supported by immunohistochemical studies showing an inverse relationship between levels of intraneuronal non-oligomeric Aβ peptide (Nunomura et al., 2010) and NFT tangle formation (Nunomura et al., 2001). However, in the current study, levels of nucleic acid oxidation from bulk tissue globally failed to distinguish between neurons containing non-oligomeric Aβ peptide and NFTs due to isolation from bulk tissue and may contribute to the discrepancy.
While the cerebellum has long been regarded as an internal control for studies of AD, the loss of Purkinje cells in FTD subjects (Hayashi et al., 2002), and accumulation of α-synuclein in Purkinje cells in DLB subjects (Mori et al., 2003) suggest that the cerebellum may not be immune from oxidative DNA damage. Significant mitochondrial nucleic acid oxidation in the cerebellum, particularly guanine oxidation, observed in DC subjects may be related to decreased glucose metabolism and the corresponding mitochondrial dysfunction observed in FTD and DLB subjects compared to NC subjects (Ishii et al., 1998a; Ishii et al., 1998b).
It remains unclear why we observed a significant elevation in median levels of multiple oxidized nucleic acids in the CER in multiple stages of AD pathogenesis. Contrary to the long held view as the CER being an internal control, several studies suggest that AD associated pathological related changes do occur in the CER. For example, diffuse amyloid plaques have been reported in the molecular layer of the cerebellar cortex of AD subjects (Braak, 1989; Yamaguchi, 1989) (Yamaguchi, 1989) along with a volumetric loss in both the molecular and granular layers (Wegiel, 1999). Furthermore, Thomann et al. (Thomann, 2008) found a poorer cognitive performance was associated with shrinkage of the posterior cerebellar region in AD subjects. Moreover, in a subset of the subjects studied here Bradley et al (Bradley et al., 2012) found that levels of extractable 4-hydroxyhexenal was significantly increased in the CER of LAD subjects compared to age-matched NC subjects. Significant elevations in median levels of nucleic acid oxidation in the cerebellum suggest that oxidative damage may be a global event preceding the formation of plaques and tangles. However, because significant oxidation of nucleic acids was also found in the CER of DC subjects it the phenomenon does not appear to AD specific.
Protein expression and the associated activity of multiple substrate-specific DNA glycosylases involved in the base excision repair of the subjects used in this study have not been directly analyzed. Yet, an age-dependent decrease in glycosylase efficiency has been illustrated (Imam et al., 2006; Szczesny et al., 2004). Specifically, multiple studies have demonstrated decreased efficiency in the activity of 8-oxoguanine-DNA glycosylase (OGG) 1 associated with the progression of AD (Mao et al., 2007; Shao et al., 2008; Weissman et al., 2007).
Furthermore, oxidized guanine may be shielded from repair as demonstrated by Hailer-Morrison et al. who showed 8-oxoguanine substitution in the promoter region of NF-κB enhanced the binding affinity of p50 to such an extent that the 8-oxoguanine adducts were shielded from E. coli Fapy glycosylase and human OGG1 activity (Hailer-Morrison et al., 2003). Ab initio calculations suggest that the presence of a single oxidized guanine in guanine rich regions, such as promoter regions or CpG islands, results in a reduced ionization potential based of surrounding guanine residues guanines (Prat et al., 1998), effectively functioning as a thermodynamic sink (Hutter and Clark, 1996) promoting excessive oxidation. Lu et al. suggested that oxidative damage accumulates preferentially in the promoter regions of several gene families that are typically down-regulated in healthy aging individuals (Lu et al., 2004). Du et al reported that increased oxidative damage of the p62 promoter correlated with decreased expression of p62 in neurodegenerative diseases including AD, FTD, and Pick’s disease (Du et al., 2009b) and in a mouse model of amyloid pathology (Du et al., 2009a).
Additionally, some gene expression is in part modulated by presence of 5mC in promoter regions via recognition of 5mC by the methyl-CpG binding domain (MBD) of methyl-CpG binding proteins (MeCP), leading to the recruitment of histone modifying enzymes. Oxidation products of both guanine and 5mC inhibit binding of the MBD of methyl-CpG binding protein 2 (MeCP2) (Valinluck et al., 2004). Similarly, the presence of 8-hydroxyguanine (8OHG) in oligonucleotides results in decreased methylation suggesting that its presence may also interfere with the activity of the DNA methyltransferase (DNMT) family of proteins (Weitzman et al., 1994). It remains unclear if nucleic acid oxidation preferentially occurs in the promoter sequences or if oxidative damage throughout the genome. However oxidation has been shown to lead to the introduction of mismatched base pairs and transitions (Cysewski and Olinski, 1999), which are precursors of immediate strand breaks (Cullis et al., 1996; Devasagayam et al., 1991) in both nDNA and mtDNA.
Deposited fibrillar Aβ1–42 in NPs of the AD brain was initially proposed as the toxic Aβ-associated event. Previous work by Lovell et al. (Lovell et al., 2009) illustrated a significant positive correlation between levels of 8-hydroxyguanine but not 8-hydroxyadenine quantified in the nDNA of double knock-in transgenic mice expressing human mutations in APP and PS1 genes and amyloid burden. However, more recently oligomeric Aβ1–42 has been suggested as the initial toxic event (Shankar et al., 2008). In the present study, correlation analyses were carried out between median levels of oxidized nucleic acid adducts and neuropathological features associated with AD including NP and NFT counts, along with PBS-, SDS-, and formic acid (FA)- soluble Aβ1–42 and Aβ1–40 in the SMTG and IPL. However, because levels of Aβ and nucleic acid oxidation were not measured using immunohistochemical techniques, the relationships are assessed on a bulk level, rather than on an individual cellular level as previously reported (Nunomura et al., 2001; Nunomura et al., 2010). While multiple significant positive correlations were detected, the associated neuropathological features were region-, nucleic base adduct-, and origin- dependent. For example, median levels of 8OHG in nDNA of SMTG were positively correlated with both NFTs and FA-soluble Aβ1–42, whereas median levels of 8OHG in mtDNA of SMTG were positively correlated with only NPs suggesting a potential relationship between oxidized base adducts and neuropathological features is variable in different fractions. Furthermore, the current study suggests the associations are base dependent. For example, neuropathologic markers and 5OHC were not correlated in any region studied, whereas correlations were detected between levels of 8OHG and multiple regions and substrates. Collectively the data suggest that the oxidative damage occurs prior to and independent of neuropathological events. This finding is consistent with Nunomura et al. (Nunomura et al., 2000) who found multiple markers of oxidative damage were elevated before Aβ deposition in subjects with Down syndrome.
Our data suggest that oxidative damage is an early event during the pathogenesis of AD and occurs prior to both cognitive deficits and significant pathological development. Furthermore, the significantly elevated levels of nucleic acid oxidation reported in MCI and PCAD subjects were comparable to levels detected in the LAD subjects and the detection of significant oxidative damage in DC subjects suggest that nucleic acid oxidative damage is a generalized event in neurodegeneration and is not specific to AD.
Acknowledgments
This research was supported by NIH grants 5P01-AG05119 and P30-AG028383. The authors thank Ms. Sonya Anderson for subject demographic data and Ms. Paula Thomason for editorial assistance.
Footnotes
Conflict of Interest
The authors have no conflicts of interest.
References
- Addya K, Wang YL, Leonard DG. Optimization of Apolipoprotein E Genotyping. Molecular diagnosis: a journal devoted to the understanding of human disease through the clinical application of molecular biology. 1997;2:271–276. doi: 10.1054/MODI00200271. [DOI] [PubMed] [Google Scholar]
- Ames BN, Shigenaga MK, Hagen TM. Oxidants, antioxidants, and the degenerative diseases of aging. Proceedings of the National Academy of Sciences of the United States of America. 1993;90:7915–7922. doi: 10.1073/pnas.90.17.7915. [DOI] [PMC free article] [PubMed] [Google Scholar]
- Arnaiz E, Jelic V, Almkvist O, Wahlund LO, Winblad B, Valind S, Nordberg A. Impaired cerebral glucose metabolism and cognitive functioning predict deterioration in mild cognitive impairment. Neuroreport. 2001;12:851–855. doi: 10.1097/00001756-200103260-00045. [DOI] [PubMed] [Google Scholar]
- Beckett TL, Niedowicz DM, Studzinski CM, Weidner AM, Webb RL, Holler CJ, Ahmed RR, LeVine H, 3rd, Murphy MP. Effects of nonsteroidal anti-inflammatory drugs on amyloid-beta pathology in mouse skeletal muscle. Neurobiology of disease. 2010;39:449–456. doi: 10.1016/j.nbd.2010.05.018. [DOI] [PMC free article] [PubMed] [Google Scholar]
- Braak H, Braak E, Bohl J, Lang W. Alzheimer’s disease: amyloid plaques in the cerebellum. J Neurol Sci. 1989;93:277–287. doi: 10.1016/0022-510x(89)90197-4. [DOI] [PubMed] [Google Scholar]
- Bradley MA, Markesbery WR, Lovell MA. Increased levels of 4- hydroxynonenal and acrolein in the brain in preclinical Alzheimer disease. Free radical biology & medicine. 2010;48:1570–1576. doi: 10.1016/j.freeradbiomed.2010.02.016. [DOI] [PMC free article] [PubMed] [Google Scholar]
- Bradley MA, Xiong-Fister S, Markesbery WR, Lovell MA. Elevated 4- hydroxyhexenal in Alzheimer’s disease (AD) progression. Neurobiology of aging. 2012;33:10. doi: 10.1016/j.neurobiolaging.2010.08.016. [DOI] [PMC free article] [PubMed] [Google Scholar]
- Cadet J, Douki T, Gasparutto D, Ravanat JL. Oxidative damage to DNA: formation, measurement and biochemical features. Mutation research. 2003;531:5–23. doi: 10.1016/j.mrfmmm.2003.09.001. [DOI] [PubMed] [Google Scholar]
- Cairns NJ, Bigio EH, Mackenzie IR, Neumann M, Lee VM, Hatanpaa KJ, White CL, 3rd, Schneider JA, Grinberg LT, Halliday G, et al. Neuropathologic diagnostic and nosologic criteria for frontotemporal lobar degeneration: consensus of the Consortium for Frontotemporal Lobar Degeneration. Acta neuropathologica. 2007;114:5–22. doi: 10.1007/s00401-007-0237-2. [DOI] [PMC free article] [PubMed] [Google Scholar]
- Collins A, Cadet J, Epe B, Gedik C. Problems in the measurement of 8- oxoguanine in human DNA. Report of a workshop, DNA oxidation, held in Aberdeen, UK, 19–21 January, 1997. Carcinogenesis. 1997;18:1833–1836. doi: 10.1093/carcin/18.9.1833. [DOI] [PubMed] [Google Scholar]
- Cooke MS, Evans MD, Dizdaroglu M, Lunec J. Oxidative DNA damage: mechanisms, mutation, and disease. The FASEB journal: official publication of the Federation of American Societies for Experimental Biology. 2003;17:1195–1214. doi: 10.1096/fj.02-0752rev. [DOI] [PubMed] [Google Scholar]
- Cullis PM, Malone ME, Merson-Davies LA. Guanine radical cations are precusors of 7,8-dihydro-8-oxo-2′-deoxyguanosine but are not precusors of immediate strand breaks in DNA. Journal of American Chemical Society. 1996;118:6. [Google Scholar]
- Cysewski P, Olinski R. Theoretical description of the coding potential of diamino-5-formamidopyrimidines. Z Naturforsch C. 1999;54:6. doi: 10.1515/znc-1999-3-414. [DOI] [PubMed] [Google Scholar]
- Das P, Howard V, Loosbrock N, Dickson D, Murphy MP, Golde TE. Amyloid-beta immunization effectively reduces amyloid deposition in FcRgamma−/− knock-out mice. The Journal of neuroscience: the official journal of the Society for Neuroscience. 2003;23:8532–8538. doi: 10.1523/JNEUROSCI.23-24-08532.2003. [DOI] [PMC free article] [PubMed] [Google Scholar]
- de la Monte SM, Luong T, Neely TR, Robinson D, Wands JR. Mitochondrial DNA damage as a mechanism of cell loss in Alzheimer’s disease. Laboratory investigation; a journal of technical methods and pathology. 2000;80:1323–1335. doi: 10.1038/labinvest.3780140. [DOI] [PubMed] [Google Scholar]
- Devasagayam TPA, Steeken S, Maik S, Obendorf W, Schulz WA, Sies H. Formation of 8-hdyroxy(deoxy)guanosine and generation of strand breaks at guanine residues in DNA by singlet oxygen. Journal of American Chemical Society. 1991;30:7. doi: 10.1021/bi00239a029. [DOI] [PubMed] [Google Scholar]
- Dizdaroglu M, Gajewski E. Selected-Ion Mass Spectrometry: Assays of Oxidative DNA Damage. Methods in Enzymology. 1990;186:530–544. doi: 10.1016/0076-6879(90)86147-n. [DOI] [PubMed] [Google Scholar]
- Drzezga A, Lautenschlager N, Siebner H, Riemenschneider M, Willoch F, Minoshima S, Schwaiger M, Kurz A. Cerebral metabolic changes accompanying conversion of mild cognitive impairment into Alzheimer’s disease: a PET follow-up study. European journal of nuclear medicine and molecular imaging. 2003;30:1104–1113. doi: 10.1007/s00259-003-1194-1. [DOI] [PubMed] [Google Scholar]
- Du Y, Wooten MC, Gearing M, Wooten MW. Age-associated oxidative damage to the p62 promoter: implications for Alzheimer disease. Free radical biology & medicine. 2009a;46:492–501. doi: 10.1016/j.freeradbiomed.2008.11.003. [DOI] [PMC free article] [PubMed] [Google Scholar]
- Du Y, Wooten MC, Wooten MW. Oxidative damage to the promoter region of SQSTM/p62 is common to neurodegenerative disease. Neurobiology of disease. 2009b;35:9. doi: 10.1016/j.nbd.2009.05.015. [DOI] [PMC free article] [PubMed] [Google Scholar]
- Dzitoyeva S, Chen H, Manev H. Effect of aging on 5- hydroxymethylcytosine in brain mitochondria. Neurobiology of aging. 2012;33:2881–2891. doi: 10.1016/j.neurobiolaging.2012.02.006. [DOI] [PMC free article] [PubMed] [Google Scholar]
- Ernster L, Schatz G. Mitochondria: a historical review. J Cell Biol. 1981;91:227s–255s. doi: 10.1083/jcb.91.3.227s. [DOI] [PMC free article] [PubMed] [Google Scholar]
- Fukuyama H, Ogawa M, Yamauchi H, Yamaguchi S, Kimura J, Yonekura Y, Konishi J. Altered cerebral energy metabolism in Alzheimer’s disease: a PET study. Journal of nuclear medicine: official publication, Society of Nuclear Medicine. 1994;35:1–6. [PubMed] [Google Scholar]
- Gabbita SP, Aksenov MY, Lovell MA, Markesbery WR. Decrease in peptide methionine sulfoxide reductase in Alzheimer’s disease brain. Journal of neurochemistry. 1999;73:1660–1666. doi: 10.1046/j.1471-4159.1999.0731660.x. [DOI] [PubMed] [Google Scholar]
- Gabbita SP, Lovell MA, Markesbery WR. Increased nuclear DNA oxidation in the brain in Alzheimer’s disease. Journal of neurochemistry. 1998;71:2034–2040. doi: 10.1046/j.1471-4159.1998.71052034.x. [DOI] [PubMed] [Google Scholar]
- Hailer-Morrison MK, Kotler JM, Martin BD, Sugden KD. Oxidized guanine lesions as modulators of gene transcription. Altered p50 binding affinity and repair shielding by 7,8-dihydro-8-oxo-2′deoxyguanosine lesions in the NF-kappaB promoter element. Biochemistry. 2003;42:10. doi: 10.1021/bi034546k. [DOI] [PubMed] [Google Scholar]
- Halliwell B, Dizdaroglu M. The measurement of oxidative damage to DNA by HPLC and GC/MS techniques. Free Rad Res Comms. 1992;16:75–87. doi: 10.3109/10715769209049161. [DOI] [PubMed] [Google Scholar]
- Harman D. Aging: a theory based on free radical and radiation chemistry. J Gerontol. 1956;11:298–300. doi: 10.1093/geronj/11.3.298. [DOI] [PubMed] [Google Scholar]
- Hayashi S, Toyoshima Y, Hasegawa M, Umeda Y, Wakabayashi K, Tokiguchi S, Iwatsubo T, Takahashi H. Late-onset frontotemporal dementia with a novel exon 1 (Arg5His) tau gene mutation. Annals of neurology. 2002;51:525–530. doi: 10.1002/ana.10163. [DOI] [PubMed] [Google Scholar]
- Hutter M, Clark T. On the enhanced stability of the guanine-cytosine pair radical cation. Journal of American Chemical Society. 1996;118:4. [Google Scholar]
- Hyman BT, Phelps CH, Beach TG, Bigio EH, Cairns NJ, Carrillo MC, Dickson DW, Duyckaerts C, Frosch MP, Masliah E, et al. National Institute on Aging-Alzheimer’s Association guidelines for the neuropathologic assessment of Alzheimer’s disease. Alzheimer’s & dementia: the journal of the Alzheimer’s Association. 2012;8:1–13. doi: 10.1016/j.jalz.2011.10.007. [DOI] [PMC free article] [PubMed] [Google Scholar]
- Iida T, Furuta A, Nishioka K, Nakabeppu Y, Iwaki T. Expression of 8- oxoguanine DNA glycosylase is reduced and associated with neurofibrillary tangles in Alzheimer’s disease brain. Acta neuropathologica. 2002;103:20–25. doi: 10.1007/s004010100418. [DOI] [PubMed] [Google Scholar]
- Imam SZ, Karahalil B, Hogue BA, Souza-Pinto NC, Bohr VA. Mitochondrial and nuclear DNA-repair capacity of various brain regions in mouse is altered in an age-dependent manner. Neurobiology of aging. 2006;27:1129–1136. doi: 10.1016/j.neurobiolaging.2005.06.002. [DOI] [PubMed] [Google Scholar]
- Ishii K, Imamura T, Sasaki M, Yamaji S, Sakamoto S, Kitagaki H, Hashimoto M, Hirono N, Shimomura T, Mori E. Regional cerebral glucose metabolism in dementia with Lewy bodies and Alzheimer’s disease. Neurology. 1998a;51:125–130. doi: 10.1212/wnl.51.1.125. [DOI] [PubMed] [Google Scholar]
- Ishii K, Sakamoto S, Sasaki M, Kitagaki H, Yamaji S, Hashimoto M, Imamura T, Shimomura T, Hirono N, Mori E. Cerebral glucose metabolism in patients with frontotemporal dementia. Journal of nuclear medicine: official publication, Society of Nuclear Medicine. 1998b;39:1875–1878. [PubMed] [Google Scholar]
- Jenner A, England TG, Aruoma OI, Halliwell B. Measurement of oxidative DNA damage by gas chromatography-mass spectrometry: ethanethiol prevents artifactual generation of oxidized DNA bases. Biochem J. 1998;331:365–369. doi: 10.1042/bj3310365. [DOI] [PMC free article] [PubMed] [Google Scholar]
- LeVine H., 3rd Alzheimer’s beta-peptide oligomer formation at physiologic concentrations. Analytical biochemistry. 2004;335:81–90. doi: 10.1016/j.ab.2004.08.014. [DOI] [PubMed] [Google Scholar]
- Levites Y, Das P, Price RW, Rochette MJ, Kostura LA, McGowan EM, Murphy MP, Golde TE. Anti-Abeta42- and anti-Abeta40-specific mAbs attenuate amyloid deposition in an Alzheimer disease mouse model. The Journal of clinical investigation. 2006;116:193–201. doi: 10.1172/JCI25410. [DOI] [PMC free article] [PubMed] [Google Scholar]
- Lovell MA, Gabbita SP, Markesbery WR. Increased DNA oxidation and decreased levels of repair products in Alzheimer’s disease ventricular CSF. Journal of neurochemistry. 1999;72:771–776. doi: 10.1046/j.1471-4159.1999.0720771.x. [DOI] [PubMed] [Google Scholar]
- Lovell MA, Soman S, Bradley MA. Oxidatively modified nucleic acids in preclinical Alzheimer’s disease (PCAD) brain. Mech Ageing Dev. 2011;132:443–448. doi: 10.1016/j.mad.2011.08.003. [DOI] [PMC free article] [PubMed] [Google Scholar]
- Lovell MA, Xiong S, Lyubartseva G, Markesbery WR. Organo- selenium (sel-plex) decreases amyloid burden and RNA and DNA oxidative damage in APP/PS1 mice. Free radical biology & medicine. 2009;46:7. doi: 10.1016/j.freeradbiomed.2009.03.008. [DOI] [PMC free article] [PubMed] [Google Scholar]
- Lu T, Pan Y, Kao SY, Li C, Kohane I, Chan J, Yankner BA. Gene regulation and DNA damage in the ageing human brain. Nature. 2004;429:883–891. doi: 10.1038/nature02661. [DOI] [PubMed] [Google Scholar]
- Lyras L, Cairns NJ, Jenner A, Jenner P, Halliwell B. An assessment of oxidative damage to proteins, lipids, and DNA in brain from patients with Alzheimer’s disease. Journal of neurochemistry. 1997;68:2061–2069. doi: 10.1046/j.1471-4159.1997.68052061.x. [DOI] [PubMed] [Google Scholar]
- Mao G, Pan X, Zhu BB, Zhang Y, Yuan F, Huang J, Lovell MA, Lee MP, Markesbery WR, Li GM, et al. Identification and characterization of OGG1 mutations in patients with Alzheimer’s disease. Nucleic acids research. 2007;35:2759–2766. doi: 10.1093/nar/gkm189. [DOI] [PMC free article] [PubMed] [Google Scholar]
- Markesbery WR. Oxidative stress hypothesis in Alzheimer’s disease. Free radical biology & medicine. 1997;23:134–147. doi: 10.1016/s0891-5849(96)00629-6. [DOI] [PubMed] [Google Scholar]
- McKeith IG, Dickson DW, Lowe J, Emre M, O’Brien JT, Feldman H, Cummings J, Duda JE, Lippa C, Perry EK, et al. Diagnosis and management of dementia with Lewy bodies: third report of the DLB Consortium. Neurology. 2005;65:1863–1872. doi: 10.1212/01.wnl.0000187889.17253.b1. [DOI] [PubMed] [Google Scholar]
- McKeith IG, Galasko D, Kosaka K, Perry EK, Dickson DW, Hansen LA, Salmon DP, Lowe J, Mirra SS, Byrne EJ, et al. Consensus guidelines for the clinical and pathologic diagnosis of dementia with Lewy bodies (DLB): report of the consortium on DLB international workshop. Neurology. 1996;47:1113–1124. doi: 10.1212/wnl.47.5.1113. [DOI] [PubMed] [Google Scholar]
- Mecocci P, MacGarvey U, Beal MF. Oxidative damage to mitochondrial DNA is increased in Alzheimer’s disease. Annals of neurology. 1994;36:747–751. doi: 10.1002/ana.410360510. [DOI] [PubMed] [Google Scholar]
- Mecocci P, MacGarvey U, Kaufman AE, Koontz D, Shoffner JM, Wallace DC, Beal MF. Oxidative Damage to Mitochondrial DNA Shows marked Age-dependent Increases in Human Brian. American Neurological Association. 1993;34:609–615. doi: 10.1002/ana.410340416. [DOI] [PubMed] [Google Scholar]
- Mello Filho AC, Meneghini R. In vivo formation of single-strand breaks in DNA by hydrogen peroxide is mediated by the Haber-Weiss reaction. Biochimica et biophysica acta. 1984;781:56–63. doi: 10.1016/0167-4781(84)90123-4. [DOI] [PubMed] [Google Scholar]
- Montine TJ, Phelps CH, Beach TG, Bigio EH, Cairns NJ, Dickson DW, Duyckaerts C, Frosch MP, Masliah E, Mirra SS, et al. National Institute on Aging-Alzheimer’s Association guidelines for the neuropathologic assessment of Alzheimer’s disease: a practical approach. Acta neuropathologica. 2012;123:1–11. doi: 10.1007/s00401-011-0910-3. [DOI] [PMC free article] [PubMed] [Google Scholar]
- Moreira PI, Honda K, Liu Q, Santos MS, Oliveira CR, Aliev G, Nunomura A, Zhu X, Smith MA, Perry G. Oxidative stress: the old enemy in Alzheimer’s disease pathophysiology. Current Alzheimer research. 2005;2:403–408. doi: 10.2174/156720505774330537. [DOI] [PubMed] [Google Scholar]
- Mori F, Piao YS, Hayashi S, Fujiwara H, Hasegawa M, Yoshimoto M, Iwatsubo T, Takahashi H, Wakabayashi K. Alpha-synuclein accumulates in Purkinje cells in Lewy body disease but not in multiple system atrophy. Journal of neuropathology and experimental neurology. 2003;62:812–819. doi: 10.1093/jnen/62.8.812. [DOI] [PubMed] [Google Scholar]
- Murphy MP, Beckett TL, Ding Q, Patel E, Markesbery WR, St Clair DK, LeVine H, III, Keller JN. A-beta solubility and deposition during AD progression and in APP x PS-1 knock-in mice. Neruobiol Dis. 2007;27:301–311. doi: 10.1016/j.nbd.2007.06.002. [DOI] [PubMed] [Google Scholar]
- Nakabeppu Y, Tsuchimoto D, Ichinoe A, Ohno M, Ide Y, Hirano S, Yoshimura D, Tominaga Y, Furuichi M, Sakumi K. Biological significance of the defense mechanisms against oxidative damage in nucleic acids caused by reactive oxygen species: from mitochondria to nuclei. Annals of the New York Academy of Sciences. 2004;1011:101–111. doi: 10.1007/978-3-662-41088-2_11. [DOI] [PubMed] [Google Scholar]
- Neary D, Snowden JS, Gustafson L, Passant U, Stuss D, Black S, Freedman M, Kertesz A, Robert PH, Albert M, et al. Frontotemporal lobar degeneration: a consensus on clinical diagnostic criteria. Neurology. 1998;51:1546–1554. doi: 10.1212/wnl.51.6.1546. [DOI] [PubMed] [Google Scholar]
- Nunomura A, Perry G, Aliev G, Hirai K, Takeda A, Balraj EK, Jones PK, Ghanbari H, Wataya T, Shimohama S, et al. Oxidative damage is the earliest event in Alzheimer disease. Journal of neuropathology and experimental neurology. 2001;60:759–767. doi: 10.1093/jnen/60.8.759. [DOI] [PubMed] [Google Scholar]
- Nunomura A, Perry G, Pappolla MA, Friedland RP, Hirai K, Chiba S, Smith MA. Neuronal oxidative stress precedes amyloid-beta deposition in Down syndrome. Journal of neuropathology and experimental neurology. 2000;59:1011–1017. doi: 10.1093/jnen/59.11.1011. [DOI] [PubMed] [Google Scholar]
- Nunomura A, Perry G, Pappolla MA, Wade R, Hirai K, Chiba S, Smith MA. RNA oxidation is a prominent feature of vulnerable neurons in Alzheimer’s disease. The Journal of neuroscience: the official journal of the Society for Neuroscience. 1999;19:1959–1964. doi: 10.1523/JNEUROSCI.19-06-01959.1999. [DOI] [PMC free article] [PubMed] [Google Scholar]
- Nunomura A, Tamaoki T, Motohashi N, Nakamura M, McKeel DW, Jr, Tabaton M, Lee HG, Smith MA, Perry G, Zhu X. The earliest stage of cognitive impairment in transition from normal aging to Alzheimer disease is marked by prominent RNA oxidation in vulnerable neurons. Journal of neuropathology and experimental neurology. 2012;71:233–241. doi: 10.1097/NEN.0b013e318248e614. [DOI] [PMC free article] [PubMed] [Google Scholar]
- Nunomura A, Tamaoki T, Tanaka K, Motohashi N, Nakamura M, Hayashi T, Yamaguchi H, Shimohama S, Lee HG, Zhu X, et al. Intraneuronal amyloid beta accumulation and oxidative damage to nucleic acids in Alzheimer disease. Neurobiology of disease. 2010;37:731–737. doi: 10.1016/j.nbd.2009.12.012. [DOI] [PMC free article] [PubMed] [Google Scholar]
- Petersen RC, Smith GE, Waring SC, Ivnik RJ, Tangalos EG, Kokmen E. Mild cognitive impairment: clinical characterization and outcome. Archives of neurology. 1999;56:303–308. doi: 10.1001/archneur.56.3.303. [DOI] [PubMed] [Google Scholar]
- Prat F, Houk KN, Foote CS. Effect of guanine stacking on the oxidation of 8-oxoguanine in B-DNA. J Am Chem Soc. 1998;120:845–846. [Google Scholar]
- Rehman A, Jenner A, Halliwell B. Gas Chromatography-Mass Spectrometry Ananlysis of DNA: Optimization of Protocols for Isolation and Analysis of DNA from Human Blood. Methods in Enzymology. 2000;319:401–416. doi: 10.1016/s0076-6879(00)19038-x. [DOI] [PubMed] [Google Scholar]
- Schmitt FA, Davis DG, Wekstein DR, Smith CD, Ashford JW, Markesbery WR. “Preclinical” AD revisited: neuropathology of cognitively normal older adults. Neurology. 2000;55:370–376. doi: 10.1212/wnl.55.3.370. [DOI] [PubMed] [Google Scholar]
- Schmitt FA, Nelson PT, Abner E, Scheff S, Jicha GA, Smith C, Cooper G, Mendiondo M, Danner DD, Van Eldik LJ, et al. University of Kentucky Sanders-Brown healthy brain aging volunteers: donor characteristics, procedures and neuropathology. Current Alzheimer research. 2012;9:724–733. doi: 10.2174/156720512801322591. [DOI] [PMC free article] [PubMed] [Google Scholar]
- Shankar GM, Li S, Mehta TH, Garcia-Munoz A, Shepardson NE, Smith I, Brett FM, Farrell MA, Rowan MJ, Lemere CA, et al. Amyloid-beta protein dimers isolated directly from Alzheimer’s brains impair synaptic plasticity and memory. Nat Med. 2008;14:837–842. doi: 10.1038/nm1782. [DOI] [PMC free article] [PubMed] [Google Scholar]
- Shao C, Xiong S, Li GM, Gu L, Mao G, Markesbery WR, Lovell MA. Altered 8-oxoguanine glycosylase in mild cognitive impairment and late-stage Alzheimer’s disease brain. Free radical biology & medicine. 2008;45:813–819. doi: 10.1016/j.freeradbiomed.2008.06.003. [DOI] [PMC free article] [PubMed] [Google Scholar]
- Smith MA, Rottkamp CA, Nunomura A, Raina AK, Perry G. Oxidative stress in Alzheimer’s disease. Biochimica et biophysica acta. 2000;1502:139–144. doi: 10.1016/s0925-4439(00)00040-5. [DOI] [PubMed] [Google Scholar]
- Szczesny B, Bhakat KK, Mitra S, Boldogh I. Age-dependent modulation of DNA repair enzymes by covalent modification and subcellular distribution. Mech Ageing Dev. 2004;125:755–765. doi: 10.1016/j.mad.2004.07.005. [DOI] [PubMed] [Google Scholar]
- Thomann PA, Schlafer C, Seidl U, Santos VD, Essig M, Schroder J. The cerebellum in mild cognitive impairment and Alzheimer’s disease - a structural MRI study. J Psychiatr Res. 2008;42:1198–1202. doi: 10.1016/j.jpsychires.2007.12.002. [DOI] [PubMed] [Google Scholar]
- Timmons MD, Bradley MA, Lovell MA, Lynn BC. Procedure for the isolation of mitochondria, cytosolic and nuclear material from a single piece of neurological tissue for high-throughput mass spectral analysis. J Neurosci Methods. 2011;197:279–282. doi: 10.1016/j.jneumeth.2011.02.027. [DOI] [PubMed] [Google Scholar]
- Tsukamoto K, Watanabe T, Matsushima T, Kinoshita M, Kato H, Hashimoto Y, Kurokawa K, Teramoto T. Determination by PCR-RFLP of apo E genotype in a Japanese population. The Journal of laboratory and clinical medicine. 1993;121:598–602. [PubMed] [Google Scholar]
- Valinluck V, Tsai HH, Rogstad DK, Burdzy A, Bird A, Sowers LC. Oxidative damage to methyl-CpG sequences inhibits the binding of the methyl-CpG binding domain (MBD) of methyl-CpG binding protein 2 (MeCP2) Nucleic acids research. 2004;32:4100–4108. doi: 10.1093/nar/gkh739. [DOI] [PMC free article] [PubMed] [Google Scholar]
- Wallace DC. Mitochondrial genetics: a paradigm for aging and degenerative diseases? Science. 1992;256:628–632. doi: 10.1126/science.1533953. [DOI] [PubMed] [Google Scholar]
- Wang J, Markesbery WR, Lovell MA. Increased oxidative damage in nuclear and mitochondrial DNA in mild cognitive impairment. Journal of neurochemistry. 2006;96:825–832. doi: 10.1111/j.1471-4159.2005.03615.x. [DOI] [PubMed] [Google Scholar]
- Wang J, Xiong S, Xie C, Markesbery WR, Lovell MA. Increased oxidative damage in nuclear and mitochondrial DNA in Alzheimer’s disease. Journal of neurochemistry. 2005;93:953–962. doi: 10.1111/j.1471-4159.2005.03053.x. [DOI] [PubMed] [Google Scholar]
- Wegiel J, Wisniewski HM, Dziewiathkowski J, Badmajew E, Tarnawski M, Reisberg B, Mlodzik B, De Leon MJ, Miller DC. Cellbellar atropy in Alzheimer’s disease - clinicopathological correlations. Brain Res. 1999;818:41–50. doi: 10.1016/s0006-8993(98)01279-7. [DOI] [PubMed] [Google Scholar]
- Weidner AM, Bradley MA, Beckett TL, Niedowicz DM, Dowling AL, Matveev SV, LeVine H, 3rd, Lovell MA, Murphy MP. RNA oxidation adducts 8-OHG and 8-OHA change with Abeta42 levels in late-stage Alzheimer’s disease. PloS one. 2011;6:e24930. doi: 10.1371/journal.pone.0024930. [DOI] [PMC free article] [PubMed] [Google Scholar]
- Weissman L, Jo DG, Sorensen MM, de Souza-Pinto NC, Markesbery WR, Mattson MP, Bohr VA. Defective DNA base excision repair in brain from individuals with Alzheimer’s disease and amnestic mild cognitive impairment. Nucleic acids research. 2007;35:5545–5555. doi: 10.1093/nar/gkm605. [DOI] [PMC free article] [PubMed] [Google Scholar]
- Weitzman SA, Turk PW, Milkowski DH, Kozlowski K. Free radical adducts induce alterations in DNA cytosine methylation. Proceedings of the National Academy of Sciences of the United States of America. 1994;91:1261–1264. doi: 10.1073/pnas.91.4.1261. [DOI] [PMC free article] [PubMed] [Google Scholar]
- Yaari R, Corey-Bloom J. Alzheimer’s disease. Seminars in neurology. 2007;27:32–41. doi: 10.1055/s-2006-956753. [DOI] [PubMed] [Google Scholar]
- Yamaguchi H, Hirai S, Morimatsu M, Shoji M, Nakazato Y. Diffuse type of senile plaques in the cerebellum of Alzheimer-type dementia demonstrated by beta protein immunostain. Acta Neuropathol. 1989;77:314–319. doi: 10.1007/BF00687584. [DOI] [PubMed] [Google Scholar]