

Abstract
Purpose
The aim of this study is to investigate markers of inflammation and oxidative stress in an early model of diabetic retinopathy, correlate retinal and plasma results and evaluate the influence of treatment by N-acetylcysteine (NAC), a free radical scavenger.
Methods
Four groups were studied: control (C), streptozotocin (STZ)-induced diabetic rats (D), STZ rats following 8 weeks of NAC (DT), and control rats following 8 weeks of NAC (CT). Plasma levels of free 15-F2t-isoprostane (15-F-2t-IsoP), superoxide dismutase (SOD) and tumour necrosis factor-alpha (TNF-α) were obtained. Primary antibodies against macrophages (ED-1), microglia (Ox-42), pericytes (NG-2), endothelial and perivascular cells (IB-4), haem oxygenase 1 (HO-1) and vascular endothelial growth factor (VEGF) were used.
Results
Expression of NG-2 was robust in C, CT, DT, and mild in D. The intensity of IB-4 was higher in D and DT compared with the C and CT. Ox-42 and ED-1 expression was higher in the D than in the DT, C or CT. Expression of VEGF and HO-1 was non-specific across the four groups. Plasma levels of 15-F-2t-IsoP and TNF-α were higher in the D as compared with the C, CT and DT. SOD levels were lower in the D when compared with the C, CT and D.
Conclusions
Macrophage/microglia activation, pericyte loss and endothelial/perivascular cell changes occur early in the pathogenesis of DR. These changes are associated with an increase in plasma markers of oxidative stress and inflammation and are minimized by treatment with NAC. The results suggest that therapies that reduce free radicals will help minimize the early events in diabetic retinopathy in the STZ model.
Keywords: diabetic retinopathy, inflammation, microglia, oxidative stress, pericyte
Introduction
Retinopathy is a leading cause of morbidity in patients with type 1 and type 2 diabetes mellitus, and the most common cause of blindness in middle-aged patients.1 Chronic hyperglycemia is thought to be the primary cause of diabetic retinopathy (DR), as supported by Diabetes Control and Complications Trial and the United Kingdom Prospective Diabetes Study. An understanding of the early pathogenesis of DR can contribute to the prevention and treatment of the disease.
The primary morphological change in the diabetic retina is the loss of pericytes that precedes the formation of acellular capillaries.2 The NG-2 proteoglycan is one of the best available markers for the study of pericytes because of its specificity.3 The loss of pericytes is associated with the formation of retinal capillary microaneurysms, excessive vascular permeability, and an eventual increase in activity of vasoactive substances such as vascular endothelial growth factor (VEGF). Increased VEGF acts as a permeability factor in non-proliferative DR, and causes intraocular neovascularization in proliferative DR.4 Isolectin IB-4 is valuable as a histochemical probe for identifying endothelial cells that form as a result of neovascularization.
Numerous studies have identified both an inflammatory response and oxidative stress as possible factors in the pathogenesis of DR. Yet, the relative contribution of each process is not well understood. In diabetes the retina experiences increased oxidative stress; the hyperglycaemia-induced process of overproduction of superoxide by the mitochondrial electron-transport chain can be considered as a causal link between elevated glucose and the metabolic abnormalities important in the development of diabetic complications.5 However, reactive oxygen species and reactive nitrogenous species are generally transient and hard to analyse, therefore a careful biochemical approach is needed to study the molecules and enzymes involved. Oxidative stress can be detected by measuring free 15-F2t-isoprostane (15-F-2t-IsoP), an accepted index of in vivo oxidative stress-induced lipid peroxidation, or by its effects on enzymatic systems. Haem oxygenase 1 (HO-1) is responsible for haem breakdown to carbon monoxide. Cells respond to oxidative stress by HO-1 expression, and it has been shown to be upregulated in a 6-week model of streptozotocin (STZ)-induced diabetic retina.6 Superoxide dismutase (SOD) is an enzyme which acts as an antioxidant defense system; its overexpression has been shown to protect the retina from increased oxidative damage experienced in diabetic conditions.7
Macrophages and retinal microglia are important mediators of inflammation, and were found to be recruited in animal and human models of DR. Macrophages, which express the antigen ED-1, cause damage to the retina by a number of inflammatory cytokines, the most important one of which is tumour necrosis factor-alpha (TNF-α). TNF-α stimulates leucocyte migration and adherence to the vascular endothelium, and further enhances the macrophage capacity to secrete reactive oxygen intermediates and induces the expression of adhesion proteins on endothelial cells.8 Microglia within the eye and brain, which express the antigen Ox-42, are considered resident macrophages of the central nervous system, and augment local immune responses.9
N-acetylcysteine (NAC), an antioxidant and glutathione precursor, may reduce the damage caused by oxidative stress. NAC has been studied as a single and combination therapy in animal models of DR. NAC’s effects range from inhibiting advanced glycation end-products (AGE) induced increases in VEGF expression and protein kinase C activation10 to preventing hypoxia-induced apoptosis.11 The effects of NAC on the expression of retinal markers of oxidative stress and inflammation remain to be elucidated.
The purpose of this study was to measure the relative expression of immunohistochemical markers of inflammation and oxidative stress in an animal model of early DR, in correlation with plasma markers, and to evaluate the effect of NAC as a potential treatment.
Methods
Animals and induction of diabetes
Male Wistar rats weighing between 200 and 240 g were obtained from Charles River Laboratories Inc., Quebec and allowed to acclimatize to the local vivarium. The rats were housed on 12-h light–dark cycle and were allowed free access to standard laboratory diet and drinking water. The animals were cared for in accordance with the principles and guidelines of the Canadian Council of Animal Care and the ARVO Statement for the Use of Animals in Ophthalmic and Vision Research. Diabetes was induced by a single tail vein injection (under halothane anaesthesia) of STZ (60 mg/kg).12 The rats were considered diabetic and used for the study only if they had hyperglycemia (≥15 mmol/L) at 72 h after STZ injection.
Experimental protocol
Animals were divided into four groups (n = 8 each) that included control (C), control treated (CT), diabetic (D) and diabetic treated (DT) groups. One week after induction of diabetes, NAC was administered to the CT and DT groups in the drinking water for 8 weeks. NAC was dissolved in drinking water and the concentration of NAC was adjusted to give a daily intake of 1.4–1.5 g/kg (average 1.44 ± 0. 06 g/kg/day) in DT rats. This dose of NAC is approximately three times higher than reported in the literature, as NAC given at 0.5 g/kg/day did not completely prevent hyperglycemia-induced oxidative stress.13 Blood samples were collected from the tail at sacrifice, following 5-h fasting, for biochemical measurements.
Tissue preparation
Representative frozen and paraffin-embedded tissue specimens were investigated in 24 eyes from 12 animals. The eyes were processed immediately after death, by enucleation followed by placement in 2% paraformaldehyde for 48 h at 4°C. For frozen tissue specimens, the left eyes were rinsed with phosphate-buffered saline (PBS) and then transferred to 10%, 20% and 30% sucrose in 0.1 M PBS for 3 h at room temperature. Samples were then snap-frozen in Tissue-Tek (Tissue-Tek; Torrance, CA, USA) in liquid nitrogen and stored at −80°C. Frozen tissues were serially sectioned at 6 μm in a Frigocut 2800 N Cryostat (Reichert-Jung; Chicago, IL, USA) at −20°C and thaw-mounted onto glass slides coated with poly-L-lysine. Specimen slides were stored at −20°C until immunohistochemical processing was conducted. For paraffin-embedded tissue specimens, the right eyes were washed extensively in PBS at pH 7.4, embedded in paraffin and oriented sagittally to obtain 6 μm pupil-optic nerve sections.
Immunohistochemistry and microscopy
Frozen slides from the central eye portions were removed from −20°C conditions, and left to dry at room temperature for 20 min. Each section was fixed with room temperature acetone for 5 min. Paraffin slides from the central eye portions were deparaffinzed and rehydrated prior to use. Subsequently, the sections were incubated with proteinase K and TE buffer for 10 min at room temperature, to aid with antigen retrieval. The sections were then blocked for non-specific binding in a solution of 5% normal goat serum and 1% bovine serum albumin (BSA) in PBS for another 30 min. The retinas were transferred to primary antibodies diluted in 0.5% BSA + 0.5% Triton and incubated for 1 h at room temperature and over night at 4°C. The primary antibodies and plant lectin used in this study are shown in Table 1.
Table 1.
Concentration and suppliers of primary antibodies and plant lectin
| Marker | Cell type/process | Concentration | Supplier |
|---|---|---|---|
| Mouse anti HO-1 | Oxidative stress | 1:800 | Stressgen |
| Mouse anti ED-1 | Total macrophage | 1:200 | Serotec |
| Mouse anti Ox-42 | Microglia | 1:300 | Cederlane |
| Rabbit anti NG-2 | Pericyte | 1:100 | La Jolla Institute for Molecular Medicine |
| Isolectin GS-IB4, Alexa Fluor 488 conjugate | Endothelial cell | 1:800 | Molecular Probe |
| Rabbit anti VEGF | Neovascularization | 1:100 | R&D |
VEGF, vascular endothelial growth factor.
Endogenous peroxidase was removed by incubation in a mixture of fresh PBS and 0.1% Triton X-100 (TX-100) for 5 min, and treatment with 0.3% hydrogen peroxide for 15 min. Sections were then incubated in secondary antibodies diluted in 0.1% TX-100 for 1 h at room temperature. Secondary antibodies included Alexa Fluor 488-conjugated donkey anti-mouse F(ab′)2 (1:400, Molecular Probes, Eugene, OR, USA), Alexa Fluor 488–conjugated donkey anti-rabbit F(ab′)2 (1:400, Molecular Probes) and biotinylated horse anti-mouse (1:800; Vector Laboratories, Burlingame, CA, USA). DAPI was used to stain the nuclei in fluorescent sections. The bound biotinylated secondary antibodies were subsequently developed with aminoethyl-carbazole producing a red reaction product (Vector Laboratories) and counterstained with Mayer’s haematoxylin. Positive controls for HO-1 using rabbit retina tissue treated with photodynamic therapy and positive controls for VEGF using lung cancer tissue were designed according to manufacturer’s recommendations. The primary antibody was absent in negative control sections, which were otherwise processed identically. Sections were washed three times for 5 min each in PBS after each step.
Light microscopy was documented with digital images captured with a Nikon CoolPix 990 camera attached to a Nikon Optiphot microscope using 20-100X objective lenses. Flourescence microscopy was undertaken with a Zeiss (LSM 510 META Oberkochen, Germany) 510 laser scanning confocal microscope equipped with a 40× water immersion objective. All digital images were prepared from 512 × 512 pixel originals, with a resolution of 230 × 230 pixels/in. Comparative digital images from diabetic and control samples were captured using identical brightness and contrast settings.
Image analysis
HO-1, ED-1, NG-2 and VEGF immunohistochemistry were analysed qualitatively by visual inspection and characterized as robust, mild or non-specific. Ox-42 and ED-1 immunoreactive cells were counted in retinal sections using a 40× objective lens. Intensity of IB-4 labelling was captured in 3–6 randomly chosen areas per retinal section of 1 mm2 under a 40× objective lens. The image-processing and image-analysis software Image J 1.37 (http://rsb.info.nih.gov/ij/download.html; developed by Wayne Rasband, National Institute of Health, Bethesda, MD, USA), was used to obtain the average intensity of three 3 × 3 pixel areas from each IB-4 stained blood vessel, which best approximates the thickness of small retinal vessels.
Biochemical measurements in plasma
Plasma glucose was analysed using a Glucose Analyzer II (Beckman instruments, USA). Plasma insulin was measured with double antibody-based radioimmunoassay kit (Linco Research Inc., St Charles, MO, USA). Plasma total antioxidant concentration was measured by using a commercially available kit (Calbiochem, San Diego, CA, USA). SOD activity was measured by using a commercially available kit (Cayman Chemical, Ann Arbor, MI, USA) that measures all three types of SOD (Cu/Zn-, Mn- and Fe-SOD) from cytosolic, mitochondrial or extracellular sources. One unit of SOD is defined as the amount of enzyme needed to exhibit 50% dismutation of the superoxide radical. Plasma TNF-α levels were determined by using a commercially available rat TNF-α ELISA kit (Biosource International, Burlington, ON, Canada). Plasma-free 15-F-2t-IsoP, an index of in vivo oxidative stress-induced lipid peroxidation, was measured by using an EIA kit (Cayman Chemical). Plasma samples were purified using Affinity Sorbent/Column (Cayman Chemical) in the presence of 0.01% butylated hydroxytoluene and then processed for analysis of free 15-F2t-IsoP as previously described.14,15
Statistical analysis
Data are presented as mean ± SEM. Two-way analysis of variance (ANOVA) was used for statistical analyses of data obtained between groups, followed by Tukey’s test for multiple comparisons of group means. SEM was chosen over SD in order to accommodate for differences in sample size and in order to allow for comparisons to be drawn between the groups. A threshold of P ≤ 0.05 was set for statistical significance.
Results
General characteristics and effects of NAC treatment
Administration of STZ resulted in characteristic symptoms of diabetes including hyperglycemia, hypoinsulinemia, decreased body weight gain along with increased food and fluid intake when compared with age-matched controls (Table 2). At 72 h after injection of STZ, diabetic rats had higher plasma glucose levels (23.7 ±2.0 mmol/L in D and 24.8 ± 1.6 mmol/L in DT groups) than in control rats (8.0 ± 0.2 mmol/L in C and 8.3 ± 0.3 mmol/L in CT groups). All animals responded to STZ treatment and none of the animals died or were excluded from the study. One week after STZ injection, the plasma insulin levels in group D (0.99 ± 0.31 ng/mL) and group DT (0.96 ± 0.16 ng/mL) were lower compared with the C (2.23 ± 0.18 ng/mL) and CT groups (1.98 ± 0.18 ng/mL). At termination, fluid intake, food consumption and plasma glucose levels were higher in diabetic rats compared with control rats, and treatment with NAC for 8 weeks moderately but significantly attenuated these changes (Table 2). Plasma insulin levels, however, did not improve in the DT group. Body weight in the D group was lower than that in control groups and NAC treatment did not have a significant effect on body weight gain in the DT group.
Table 2.
General characteristics at termination of study
| Parameter | C | CT | D | DT |
|---|---|---|---|---|
| Water intake (mL/kg/day) | 100 ± 10 | 89 ± 3 | 766 ± 50* | 610 ± 30*,** |
| Food Intake (g/kg/day) | 63 ± 1 | 64 ± 1 | 163 ± 7* | 140 ± 5*,** |
| Body weight (g) | 507 ± 8 | 495 ± 14 | 372 ± 20* | 343 ± 14* |
| Plasma glucose (mmol/L) | 8.3 ± 0.1 | 8.3 ± 0.3 | 33.2 ± 1.9* | 27.5 ± 0.9*,** |
| Plasma insulin (ng/mL) | 1.3 ± 0.2 | 1.0 ± 0.1 | 0.2 ± 0.0* | 0.3 ± 0.1* |
P ≤ 0.05 versus C;
P ≤ 0.05 versus D. Values were obtained at termination (9 weeks after STZ injection and 8 weeks of NAC treatment). All values are expressed as mean ± SEM (n = 8 per group). C, control; CT, control+NAC treatment; D, diabetes; DT, diabetes+NAC treatment; NAC, N-acetylcysteine; STZ, streptozotocin.
Retinal markers of oxidative stress and inflammation and Effect of NAC treatment
Ox-42
Ox-42 expression, indicative of microglia, was largely confined to the inner plexiform layer (IPL) and ganglion cell layer (GCL) (Fig. 1). Ox-42 immunoreactive profiles were small, amoeboid or ovoid shaped cell bodies. Processes emanating from the cell bodies were rarely seen. The number of Ox-42 immunoreactive cell bodies per retina was significantly greater in the D group (25.3 ± 1.9) than in the C (10.0 ± 1.5) and CT (9.8 ± 0.8) groups, and was attenuated to levels comparable to the control rats by treatment with NAC in the DT (10.3 ± 1.9) group.
Figure 1.
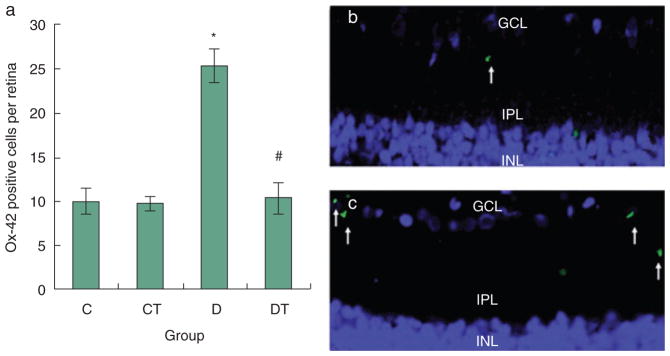
Ox-42 expression in retina (Alexa 488/DAPI). (a) C, CT, D and DT indicate control, control+NAC treatment, diabetes and diabetes+NAC treatment groups, respectively. Results are expressed as mean ± SEM (n = 3 per group; *P ≤ 0.05 vs. C; #P ≤ 0.05 vs. D). Right: representative slides showing immunohistochemical staining of Ox-42 (stained in green as shown by arrows) in the retina. Blue represents DAPI nuclear staining. Slides (b) and (c) represent control and diabetic, respectively. Ox-42 expression is increased in diabetic group as compared with all other groups.
ED-1
ED-1 immunoreactive cell bodies, signifying macrophages, were found spanning the GCL, IPL, inner nuclear layer (INL), outer plexiform layer (OPL), and were particularly prominent in the perivascular space (Fig. 2). Where retinal vessels are identified, macrophages can be seen tracking from these vessels to the IPL. ED-1-positive cells appeared round or pleomorphic with some cells showing thin processes emanating from the cell body. The number of ED-1 positive cell bodies per high power field was significantly higher in the D (21.0 ± 1.0) group as compared with the C (11.0 ± 0.8) and CT (12.1 ± 0.4) groups. Treatment with NAC partially reduced expression in the DT (15.6 ± 0.2) group but not to non-diabetic levels (Fig. 2).
Figure 2.
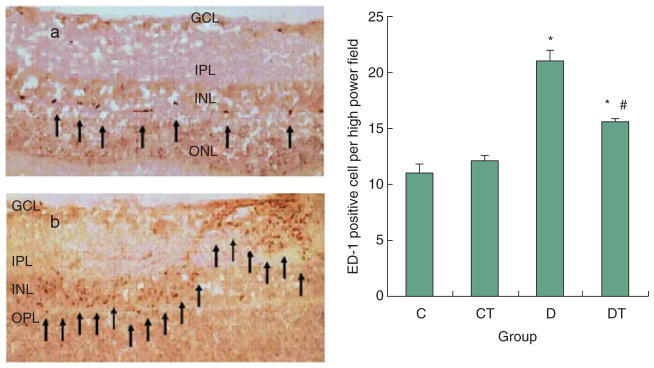
ED-1 expression in retina (AEC/Mayer’s haematoxylin). C, CT, D and DT indicate control, control+NAC treatment, diabetes and diabetes+NAC treatment groups, respectively. Results are expressed as mean ± SEM (n = 2–6 per group; *P ≤ 0.05 vs. C; #P ≤ 0.05 vs. D). Left: representative slides showing immunohistochemical staining of ED-1 (stained in red/brown as shown by arrow) in the retina. Slides (a) and (b) represent control and diabetic respectively. ED-1 expression is increased in diabetic group as compared with all other groups.
NG-2
NG2-positive smooth muscle cells, indicative of pericytes, were localized external to the endothelium surrounding retinal capillaries (Fig. 3). The expression was analysed qualitatively by visual inspection. The expression was attenuated in D group, and robust in C and CT groups. Treatment with NAC improved the expression of NG2 to non-diabetic levels in the DT group (Table 3).
Figure 3.

NG-2 expression in retina (Alexa 488/DAPI). Representative slides showing immunohistochemical staining of NG-2 (stained in green as shown by arrow) in the retina. Blue represents DAPI nuclear staining. Slides (a) and (b) represent controls. Slide (c) represents control+NAC treatment. Slides (d) and (e) represent diabetes. Slide (f) represents diabetic+NAC treated. NG-2 expression is decreased in diabetic group as compared with all other groups.
Table 3.
Summary of retinal findings
| Marker | C | CT | D | DT |
|---|---|---|---|---|
| Ox-42 (positive cells/retina) | 10.0 ± 1.5 | 9.8 ± 0.8 | 25.3 ± 1.9* | 10.3 ± 0.9** |
| ED-1 (positive cells/HPF) | 11.0 ± 0.8 | 12.1 ± 0.4 | 21.0 ± 1.0* | 15.6 ± 0.2*,** |
| IB-4 (average intensity) | 112.4 ± 5.7 | 102.5 ± 4.64 | 194.3 ± 5.2* | 180.7 ± 6.4* |
| NG-2 (qualitative) | Robust | Robust | Mild | Robust |
| HO-1 (qualitative) | Non-specific | |||
| VEGF (qualitative) | Non-specific | |||
P ≤ 0.05 versus C;
P ≤ 0.05 versus D. C, CT, D and DT indicate control, control+NAC treatment, diabetes and diabetes+NAC treatment groups, respectively. All values are expressed as mean ± SEM. NG-2 expression is decreased in diabetic group as compared with all other groups. HO-1 and VEGF expression is non-specific across all four groups. NAC, N-acetylcysteine; VEGF, vascular endothelial growth factor.
IB-4
IB-4 binding, labelling cells within and surrounding blood vessels, was strongest around the retinal capillaries (Fig. 4). The average intensity of IB-4 staining was higher in the D (194.3 ± 5.2) group as compared with the C (112.4 ± 5.7) and CT (102. 5 ± 4.64) groups. Treatment with NAC had an insignificant effect on the intensity of IB-4 staining in the DT (180.7 ± 6.4) group.
Figure 4.

IB-4 expression in retina (Alexa 488). C, CT, D and DT indicate control, control+NAC treatment, diabetes and diabetes+NAC treatment groups, respectively. Results are expressed as mean ± SEM (n = 26–78 per group; *P ≤ 0.05 vs. C) Left: representative slides showing immunohistochemical staining of IB-4 (stained in green as shown by arrow) surrounding retinal vessels. Slides (a) and (b) represent control and diabetic respectively. Intensity of IB-4 staining is increased in D and DT groups, as compared with C and CT groups.
VEGF and HO-1
Expression of VEGF and HO-1 was non-specific in all four groups on visual inspection (Table 3) and not further analysed quantitatively. HO-1 and VEGF are strongly expressed in the control tissue indicated that the non-specific labelling observed for HO-1 and VEGF in the experimental tissue is real, and not artificial owing to technical problems with the antibodies.
Plasma markers of oxidative stress and inflammation and effect of NAC treatment
Plasma levels of free 5-F2t-IsoP were significantly increased in diabetic rats as compared with control rats (Table 4). NAC treatment partially suppressed free 5-F2t-IsoP expression. The plasma total antioxidant concentration was significantly lower in diabetic rats than in control rats, in parallel with a significant reduction in the plasma activity of SOD, a major endogenous antioxidant enzyme. NAC restored plasma total antioxidant concentration and SOD activity in the diabetic rats to levels comparable to those in the control rats. NAC also increased the plasma total antioxidant concentration in control rats (P ≤ 0.05, group CT vs. group C), but did not further increase plasma SOD activity in the control rats. The plasma TNF-α levels were significantly higher in the diabetic rats as compared with the control rats; treatment with NAC significantly lowered TNF-α levels as compared with diabetic rats (Table 4).
Table 4.
Plasma markers of oxidative stress and inflammation
| Parameter | C | CT | D | DT |
|---|---|---|---|---|
| Total antioxidant Concentration (mmol/L) | 1.2 ± 0.1 | 1.6 ± 0.1* | 0.8 ± 0.1* | 1.2 ± 0.1*,** |
| Superoxide dismutase (U/mL) | 4.1 ± 0.1 | 3.5 ± 0.3 | 2.4 ± 0.3* | 3.2 ± 0.2*,** |
| Free 15-F2t-lsoP (pg/mL) | 24 ± 4 | 24 ± 2 | 69 ± 13* | 36 ± 5*,** |
| Tumor necrosis factor alpha (pg/mL) | 6 ± 2 | 7 ± 2 | 16 ± 2* | 8 ± 3*,** |
P ≤ 0.05 or 0.01 versus C.
P ≤ 0.05 versus D. Values were obtained at termination (9 weeks after STZ injection and 8 weeks of NAC treatment). All values are expressed as mean ± SEM (n = 6–8 per group). C, control; CT, control+NAC treatment; D, diabetes; DT, diabetes+NAC treatment; NAC, N-acetylcysteine; STZ, streptozotocin.
Discussion
At 9 weeks of experimental diabetes, our study demonstrated mainly an inflammatory change in the retina, dominated by upregulation of macrophages and microglia, and both inflammatory and oxidative stress changes in the plasma. Although our study did not find HO-1 upregulation in the diabetic retina, an elevation in this enzyme was shown previously in a STZ rat model at 6 weeks of diabetic state.6 It is likely that both oxidative stress and inflammatory response are activated early in the pathogenesis of DR.
A number of antioxidants have been reported in literature to attenuate the retinal changes associated with progression of DR, including stobadine and vitamin E,16 curcumin,17 bucillamine,18 flavonoids,19 troxerutin,20 R-(+)-α-lipoic acid21 and tenilsetam,22 but few studies have examined the effects of these treatments on inflammatory and oxidative changes in both the plasma and retina. In our study, NAC reduced macrophage and microglia counts in the retina, and also minimized pericyte loss. Our finding that the number of inflammatory cells is decreased after reducing oxidative stress systemically with NAC indicates that early prophylactic treatment with anti-oxidants may prevent inflammatory changes in DR. To our knowledge, our study may also represent the earliest evidence of pericyte loss in a STZ-induced rat model of DR, as suggested by the attenuated NG-2 expression in D group. A previous study has demonstrated the same loss at 2.5 months of DR.23 Further studies with TUNEL staining or other markers of apoptosis are needed to confirm pericyte loss.
Reactive oxygen species can act as second messengers for several transcription factors, including nuclear factor KB (NF-KB), which plays a critical role in the activation of multiple genes that contribute to the inflammatory response and end-organ damage in other disease states such as hypertension.24 Indeed, a number of animal treatments, including R-(+)-α-lipoic acid25 and a combination of antioxidants (ascorbic acid, Trolox, dl alpha-tocopherol acetate, NAC, beta-carotene and selenium),26 have been shown to reduce the activation of NF-KB by reducing oxidative stress on the retina.
N-acetylcysteine is able to normalize plasma markers of inflammation and oxidative stress by acting as a free radical scavenger. It has been suggested that interrupting mitochondrial superoxide overproduction would normalize the pathways involved in the development of diabetic complications.27 NAC’s effect in enhancing endogenous SOD activity (Table 4), which may have resulted in part from its capability in attenuating TNF-α-induced reduction of SOD activity in vascular endothelial cells,28 would have increased its antioxidant potential. In addition, the partial ‘glucose-lowering effect’ of NAC (Table 2) may make it a causal therapeutic agent for oxidative stress in diabetes, hence a promising antioxidant in the treatment of ocular and systemic complications of diabetes.
Interestingly, NAC does not reduce the intensity of IB-4 staining, signifying continued endothelial and perivascular cell changes despite treatment. Although abundant, the endothelial and perivascular cells in diabetics are less able to migrate in vivo and to repair of vasculature in ischaemic states.29 As isolectin IB-4 is selective for terminal α-D-galactosyl residues, it is plausible that some endothelial and perivascular cells are becoming glycosylated leading to more binding sites per cell. Future studies with electron microscopic examination of lectin binding sites may be helpful in distinguishing whether the IB-4 intensity changes seen here represent more binding sites per cell or an increase in the number of endothelial and perivascular cells. The latter may indicate an abnormal angiogenic response, which maybe stimulated by a process independent of oxidative stress, leading to more endothelial cells per retinal section. These stimulants may include AGE and their receptor via VEGF,30 renin-angiotensin system30 and erythropoietin.31 Again, we are reminded of the multiple pathways of diabetes that may lead to the microvascular complications ascribed to diabetes mellitus, and the multiple treatment targets that they afford. Different pathogenic processes may be targeted at different stages of the disease.
Despite using NAC three times higher than reported in the literature, our study shows NAC as a promising agent for the reduction of inflammatory and oxidative changes associated with ocular and systemic complications of diabetes. Although the higher dose of NAC is well tolerated in rats, more studies are needed to determine its safety in humans.
Acknowledgments
The work was supported by the Canadian Institute for Health Research (CIHR) (JAM) and Heart and Stroke Foundation of BC and Yukon Program Grant (JHM). The UBC Faculty of Medicine Summer Student Research Program (GYT) and the CIHR/Rx and D HRF Health Research Foundation Fellowship Program (ZX) also provided funding for this work.
References
- 1.Klein R, Klein BE. Diabetes in America, Diabetes Data compiled 1984. National Diabetes Data Group. Washington, DC: United States Government Printing Office; 1985. Vision Disorders in Diabetes. NM Pub. No. 85-1468. [Google Scholar]
- 2.Hammes HP. Pericytes and the pathogenesis of diabetic retinopathy [Review] Horm Metab Res. 2005;37 (Suppl 1):39–43. doi: 10.1055/s-2005-861361. [DOI] [PubMed] [Google Scholar]
- 3.Ozerdem U, Grako KA, Dahlin-Huppe K, Monosov E, Stallcup WB. NG2 proteoglycan is expressed exclusively by mural cells during vascular morphogenesis. Dev Dyn. 2001;222:218–27. doi: 10.1002/dvdy.1200. [DOI] [PubMed] [Google Scholar]
- 4.Witmer AN, Vrensen GF, Van Noorden CJ, Schlingemann RO. Vascular endothelial growth factors and angiogenesis in eye disease [Review] Prog Retin Eye Res. 2003;22:1–29. doi: 10.1016/s1350-9462(02)00043-5. [DOI] [PubMed] [Google Scholar]
- 5.Nishikawa T, Edelstein D, Du XL, et al. Normalizing mitochondrial superoxide production blocks three pathways of hyperglycaemic damage. Nature. 2000;404:787–90. doi: 10.1038/35008121. [DOI] [PubMed] [Google Scholar]
- 6.Cukiernik M, Mukherjee S, Downey D, Chakabarti S. Heme oxygenase in the retina in diabetes. Curr Eye Res. 2003;27:301–8. doi: 10.1076/ceyr.27.5.301.17227. [DOI] [PubMed] [Google Scholar]
- 7.Kowluru RA, Kowluru V, Xiong Y, Ho YS. Overexpression of mitochondrial superoxide dismutase in mice protects the retina from diabetes-induced oxidative stress. Free Radic Biol Med. 2006;41:1191–6. doi: 10.1016/j.freeradbiomed.2006.01.012. [DOI] [PubMed] [Google Scholar]
- 8.Schroder S, Palinski W, Schmid-Schonbein GW. Activated monocytes and granulocytes, capillary nonperfusion, and neovascularization in diabetic retinopathy. Am J Pathol. 1991;139:81–100. [PMC free article] [PubMed] [Google Scholar]
- 9.Chen L, Yang P, Kijlstra A. Distribution, markers, and functions of retinal microglia [Review] Ocul Immunol Inflamm. 2002;10:27–39. doi: 10.1076/ocii.10.1.27.10328. [DOI] [PubMed] [Google Scholar]
- 10.Mamputu JC, Renier G. Advanced glycation end products increase, through a protein kinase C-dependent pathway, vascular endothelial growth factor expression in retinal endothelial cells. Inhibitory effect of gliclazide. J Diabetes Complications. 2002;16:284–93. doi: 10.1016/s1056-8727(01)00229-x. [DOI] [PubMed] [Google Scholar]
- 11.Castillo M, Bellot JL, García-Cabanes C, Miquel J, Orts A, Palmero M. Effects of hypoxia on retinal pigmented epithelium cells: protection by antioxidants. Ophthalmic Res. 2002;34:338–42. doi: 10.1159/000067050. [DOI] [PubMed] [Google Scholar]
- 12.Shinoda K, Rejdak R, Schuettauf F, et al. Early electroretinographic features of streptozotocin-induced diabetic retinopathy. Clin Experiment Ophthalmol. 2007;35:847–54. doi: 10.1111/j.1442-9071.2007.01607.x. [DOI] [PubMed] [Google Scholar]
- 13.Fiordaliso F, Bianchi R, Staszewsky L, et al. Antioxidant treatment attenuates hyperglycemia-induced cardiomyocyte deathinrats. J Mol Cell Cardiol. 2004;37:959–68. doi: 10.1016/j.yjmcc.2004.07.008. [DOI] [PubMed] [Google Scholar]
- 14.Ansley DM, Xia Z, Dhaliwal BS. The relationship between plasma free 15-F2t-isoprostane concentration and early postoperative cardiac depression following warm heart surgery. J Thorac Cardiovasc Surg. 2003;126:1222–3. doi: 10.1016/s0022-5223(03)00794-3. [DOI] [PubMed] [Google Scholar]
- 15.Xia Z, Godin DV, Ansley DM. Propofol enhances ischemic tolerance of middle-aged rat hearts: effects on 15-F(2t)-isoprostane formation and tissue antioxidant capacity. Cardiovasc Res. 2003;59:113–21. doi: 10.1016/s0008-6363(03)00351-1. [DOI] [PubMed] [Google Scholar]
- 16.Yulek F, Or M, Ozogul C, et al. Effects of stobadine and vitamin E in diabetes-induced retinal abnormalities: involvement of oxidative stress. Arch Med Res. 2007;38:503–11. doi: 10.1016/j.arcmed.2007.02.006. [DOI] [PubMed] [Google Scholar]
- 17.Kowluru RA, Kanwar M. Effects of curcumin on retinal oxidative stress and inflammation in diabetes. Nutr Metab (Lond) 2007;4:8. doi: 10.1186/1743-7075-4-8. [DOI] [PMC free article] [PubMed] [Google Scholar]
- 18.Mori F, Takahashi J, Nagaoka T, Abiko T, Hikichi T, Yoshida A. Inhibitory effect of bucillamine on the increased leukocyte entrapment in the retinal microcirculation of diabetic rats. Jpn J Ophthalmol. 2006;50:377–9. doi: 10.1007/s10384-005-0322-9. [DOI] [PubMed] [Google Scholar]
- 19.Maher P, Hanneken A. Flavonoids protect retinal ganglion cells from oxidative stress-induced death. Invest Ophthalmol Vis Sci. 2005;46:4796–803. doi: 10.1167/iovs.05-0397. [DOI] [PubMed] [Google Scholar]
- 20.Chung HK, Choi SM, Ahn BO, Kwak HH, Kim JH, Kim WB. Efficacy of troxerutin on streptozotocin-induced rat model in the early stage of diabetic retinopathy. Arzneimittelforschung. 2005;55:573–80. doi: 10.1055/s-0031-1296907. [DOI] [PubMed] [Google Scholar]
- 21.Lin J, Bierhaus A, Bugert P, et al. Effect of R-(+)-alpha-lipoic acid on experimental diabetic retinopathy. Diabetologia. 2006;49:1089–96. doi: 10.1007/s00125-006-0174-y. [DOI] [PubMed] [Google Scholar]
- 22.Hoffmann J, Alt A, Lin J, et al. Tenilsetam prevents early diabetic retinopathy without correcting pericyte loss. Thromb Haemost. 2006;95:689–95. [PubMed] [Google Scholar]
- 23.Dagher Z, Park YS, Asnaghi V, Hoehn T, Gerhardinger C, Lorenzi M. Studies of rat and human retinas predict a role for the polyol pathway in human diabetic retinopathy. Diabetes. 2004;53:2404–11. doi: 10.2337/diabetes.53.9.2404. [DOI] [PubMed] [Google Scholar]
- 24.Schnackenberg CG. Oxygen radicals in cardiovascular-renal disease [Review] Curr Opin Pharmacol. 2002;2:121–5. doi: 10.1016/s1471-4892(02)00133-9. [DOI] [PubMed] [Google Scholar]
- 25.Lin J, Bierhaus A, Bugert P, et al. Effect of R-(+)-alpha-lipoic acid on experimental diabetic retinopathy. Diabetologia. 2006;49:1089–96. doi: 10.1007/s00125-006-0174-y. [DOI] [PubMed] [Google Scholar]
- 26.Kowluru RA, Koppolu P, Chakrabarti S, Chen S. Diabetes-induced activation of nuclear transcriptional factor in the retina, and its inhibition by antioxidants. Free Radic Res. 2003;37:1169–80. doi: 10.1080/10715760310001604189. [DOI] [PubMed] [Google Scholar]
- 27.Ceriello A. New insights on oxidative stress and diabetic complications may lead to a ‘causal’ antioxidant therapy. Diabetes Care. 2003;26:1589–96. doi: 10.2337/diacare.26.5.1589. [DOI] [PubMed] [Google Scholar]
- 28.Xia Z, Liu M, Wu Y, et al. N-acetylcysteine attenuates TNF-alpha-induced human vascular endothelial cell apoptosis and restores eNOS expression. Eur J Pharmacol. 2006;550:134–42. doi: 10.1016/j.ejphar.2006.08.044. [DOI] [PubMed] [Google Scholar]
- 29.Caballero S, Sengupta N, Afzal A, et al. Ischemic vascular damage can be repaired by healthy, but not diabetic, endothelial progenitor cells. Diabetes. 2007;56:960–7. doi: 10.2337/db06-1254. [DOI] [PMC free article] [PubMed] [Google Scholar]
- 30.Yamagishi SI, Matsui T, Nakamura K, et al. Olmesartan blocks advanced glycation end products (AGEs)-induced angiogenesis in vitro by suppressing receptor for AGEs (RAGE) expression. Microvasc Res. 2008;75:130–4. doi: 10.1016/j.mvr.2007.05.001. [DOI] [PubMed] [Google Scholar]
- 31.Takagi H, Watanabe D, Suzuma K, et al. Novel role of erythropoietin in proliferative diabetic retinopathy. Diabetes Res Clin Pract. 2007;77 (Suppl 1):S62–4. doi: 10.1016/j.diabres.2007.01.035. [DOI] [PubMed] [Google Scholar]