

Abstract
Age related macular degeneration (AMD) is one of the leading causes of blindness in Western society. A hallmark of early stage AMD are drusen, extracellular deposits that accumulate in the outer retina. Advanced glycation endproducts (AGE) accumulate with aging and are linked to several age-related diseases such as Alzheimer’s disease, osteoarthritis, atherosclerosis and AMD. AGE deposits are found in drusen and in Bruch’s membrane of the eye and several studies have suggested its role in promoting oxidative stress, apoptosis and lipofuscin accumulation. Recently, complement activation and chronic inflammation have been implicated in the pathogenesis of AMD. While AGEs have been shown to promote inflammation in other diseases, whether it plays a similar role in AMD is not known. This study investigates the effects of AGE stimulation on pro- and anti-inflammatory pathways in primary culture of human retinal pigment epithelial cells (RPE). Differential gene expression studies revealed a total of 41 up- and 18 down-regulated RPE genes in response to AGE stimulation. These genes fell into three categories as assessed by gene set enrichment analysis (GSEA). The main categories were inflammation (interferon-induced, immune response) and proteasome degradation, followed by caspase signaling. Using suspension array technology, protein levels of secreted cytokines and growth factors were also examined. Anti-inflammatory cytokines including IL10, IL1ra and IL9 were all overexpressed. Pro-inflammatory cytokines including IL4, IL15 and IFN-γ were overexpressed, while other pro-inflammatory cytokines including IL8, MCP1, IP10 were underexpressed after AGE stimulation, suggesting a para-inflammation state of the RPE under these conditions. Levels of mRNA of chemokine, CXCL11, and viperin, RSAD2, were up-regulated and may play a role in driving the inflammatory response via the NF-kB and JAK-STAT pathways. CXCL11 was strongly immunoreactive and associated with drusen in the AMD eye. The pathways and novel genes identified here highlight inflammation as a key response to AGE stimulation in primary culture of human RPE, and identify chemokine CXCL11 as putative novel agent associated with the pathogenesis of AMD.
Keywords: Microarray, Age-related macular degeneration, Vitreous, Pathway analysis, CXCL11
1. Introduction
Age-related macular degeneration (AMD) is a complex multifactorial disease in which aging, genetic and environmental factors all play a role in its pathogenesis. It is the leading cause of irreversible blindness in the elderly [1]. One hallmark of AMD is the presence of macular extracellular deposits called drusen, found between the basal lamina of the retinal pigment epithelium (RPE) and the inner layer of Bruch’s membrane (BM). Proteomic studies revealed that drusen contain proteins associated with the immune response and inflammation (e.g. immunoglobulins), acute phase molecules (e.g. vitronectin, amyloid P, fibrinogen), apolipoproteins, complement factors (e.g. C5, C5b-9), and complement regulatory molecules (clusterin, complement receptor 1). These molecules suggest an inflammatory process associated with drusen, but what activates or triggers the inflammation or the mechanism by which these molecules deposit in drusen remains unknown [2–5].
There is little direct evidence to support a causal relationship between the presence of drusen and AMD disease progression. Nevertheless, it is known that drusen deposits occur in early stage AMD [6,7], and the size and number of drusen are correlated with the risk of vision loss. Drusen are composed of many peptides, some of which are known to be harmful to cells, such as amyloid beta and advanced glycation endproducts. Thus, it seems plausible that drusen, or individual components of drusen, may promote pathological degenerative processes in the RPE [8].
Here we focus on the effects of advanced glycation endproducts (AGE), a constituent of drusen and Bruch’s membrane in the aging retina [6], on gene expression patterns in primary culture of human RPE cells. We hypothesize that AGE stimulation of primary culture of RPE cells will induce pro-inflammatory gene changes. Our studies are the first in primary culture of RPE to validate and extend the studies of AGE stimulation on bovine [7] and mouse [8] RPE as well as RPE cell lines [9,10]. Knowing the effects of AGE stimulation in primary culture of human RPE, arguably a better in vitro model than a cell line, is especially important for translational studies and treatment strategies for AMD that target human genes and their products.
In this study, we identify the cellular pathways activated by AGE stimulation by exploring the changes in the genome wide gene expression patterns, and validated several gene products by suspension array technology. Together with our earlier study on amyloid beta stimulation of RPE in vitro [11], a clearer picture of the in vitro response of primary culture of human RPE cells to drusen components, such as amyloid beta and AGE, is formed and includes activation of pro-inflammatory, proteasome degradation and caspase signaling pathways, all of which trigger important early events in the pathogenesis of AMD [12].
2. Materials and methods
2.1. Cell culture of human RPE cells
Methods for securing human tissue were humane and included proper written informed consent from each participant involved in the study. This study complied with the Declaration of Helsinki and was approved by the Clinical Review Ethics Board of the University of British Columbia. Human fetal donor eyes were used under the guidelines and regulation of the Clinical Research Ethics Board at the University of British Columbia, Vancouver, Canada. Human RPE cells were isolated from fetal donor eye tissues as described previously [11]. The eyes were cut circumferentially, the vitreous removed and the neuroretina gently detached from the RPE cell layer. The choroid/RPE complex was placed in 2% Dispase (Gibco, Madison, WI) in Hanks’ balanced salt solution (HBSS) (Invitrogen) for 25 min at 37 °C. The RPE layer was then removed in fragments and passed through 70-μm and 40-μm nylon mesh filters (Falcon Plastics, Oxnard, CA). Only the fragments that were left behind were retained. After centrifugation at 1500 rpm for 5 min, the fragments were gently dissociated and seeded onto laminin-coated 6-well plates (Falcon Plastics, Oxnard, CA). RPE cells were cultured in Dulbecco’s Modified Eagle’s Medium (DMEM, Gibco BRL, Grand Island, NY) containing 10% fetal bovine serum (FBS, Gibco), 100 μg/ml penicillin (Sigma, St. Louis, MO), 100 μg/ml streptomycin (Sigma) and 2 mM L-glutamine (Invitrogen) at 37 °C in a humidified atmosphere of 95% air and 5% CO2. At confluence, the cells were detached using 0.05% trypsin/0.02% EDTA (Invitrogen), collected by centrifugation and expanded. This study used passage 2–4 cells.
AGEs were obtained by modification of bovine serum albumin (BSA; BioVision) using a Maillard reaction from published protocols [13–17]. Briefly, essential fatty-acid-free grade of BSA especially purified for cell culture application was used to decrease low molecular weight contaminants such as LPS and endotoxin. This BSA was incubated with 0.01873 M glycolaldehyde and phosphate buffered saline (PBS, pH 7.4) under sterile conditions at 37 °C for 7 days. The unbound material was purified by extensive dialysis against PBS. The major AGEs formed are pentosidine and carboxy-methyl lysine (CML). Quantification of pentosidine by HPLC based on this synthesis was previously described [14]. Endotoxin levels in the AGE-BSA were measured by manufacturer to be <0.2 pg/ml. Fluorescence of the AGE was confirmed by fluorescence spectrophotometry using 370 nm excitation/440 nm emission. Glycat-ed AGE-BSA shows a 7000% increase in fluorescence when compared to control (unmodified) BSA.
2.2. Quantification of N(epsilon)–carboxymethyllysine (CML) in AGE-BSA
The quantification of CML level in our samples was performed using CML ELISA kit (Cat#STA-316, Cell Biolabs, INC, San Diego, CA) following manufacturer’s protocol. Briefly, CML-BSA standards, AGE-BSA, and BSA samples (10 μg/ml) are adsorbed onto a 96-well plate overnight at 4 °C. The CML protein adducts present in the sample or standard are probed with an anti-CML antibody, followed by an HRP conjugated secondary antibody. The CML protein adduct content in our sample is determined by comparing with a standard curve that is prepared from CML-BSA standards.
2.3. Cell viability assay
RPE cells (2 × 10⁴ cells/well) were seeded in 200 μl DMEM containing 10% FBS medium on a 96-well culture plate and incubated for 24 h. The medium was then discarded and the cells were washed three times with phosphate buffered saline (PBS). RPE cells were stimulated with a wide range of concentrations of AGE (0.01–100 μg/ml) in 1% FBS in DMEM. After AGE stimulation, RPE cell viability was measured by the addition of 50 μl of 3-(4,5-dimethyl-thiazol-2-yle)-2,5-diphenyltetrazolium bromide (MTT) solution (2 mg/ml) to each well, and incubation at 37 °C for 4 h. Mitochondrial and cytosolic dehydrogenases of living cells reduced the yellow tetrazolium salt (MTT) to a purple formazan dye that was then detected by spectrophotometry. After 4 h, the MTT solution was aspirated and 150 μl of dimethylsulfoxide (DMSO) was added for a period of 20 min. Optical densities of the supernatant were read at 550 nm using a microplate spectrophotometer (Bio-Tek Instruments, Inc., Winooski, VT). Absorbances were normalized to the untreated control cultures that were incubated in 1% FBS DMEM, which represented 100% viability. Two independent experiments in quadruplicate were performed in this study. The data were analyzed using mean ± standard deviation (SD). To facilitate data interpretation, RPE cells grown in DMEM media (without serum) or unmodified BSA served as negative controls, while RPE cells grown in DMEM and 1% FBS served as a standard for normalization.
2.4. AGE stimulation
For stimulation studies, confluent RPE cultures were used. Prior to stimulation, the cells were washed 3 times with PBS. The RPE cells were then treated with AGE (described above) at a concentration of 10 μg/ml for 24 h in 1 ml of DMEM containing 1% FBS. Untreated RPE cells in only DMEM containing 1% FBS were used as an untreated positive control. RPE stimulation with 10 μg/ml of AGE was selected from physiologic level of AGEs in human serum [20] which was estimated to be approximately 8–10 μg/ml of AGE-BSA.
2.5. Microarray and data analysis
The total cellular RNA was isolated from cultured human RPE cells according to manufacturer’s recommendations and as described previously [11] (TRIzol; Invitrogen). RNA samples were then subsequently treated with TURBO DNA-free (Ambion, Streetsville, ON, Canada) to remove any DNA contamination. Quantification of RNA was performed using the NanoDrop ND-1000 spectrophotometer (NanoDrop Products, Thermo Fisher Scientific, Wilmington, DE). Total RNA quality was assessed with the Agilent 2100 bioanalyzer prior to microarray analysis. Samples with a RIN value of greater than or equal to 8.0 were deemed to be acceptable for microarray analysis. Samples were prepared following Agilent’s One-Color Microarray-Based Gene Expression Analysis Low RNA Input Linear Amplification Labeling Kit. An input of 500 ng of total RNA was used to generate Cyanine-3 labeled cRNA and samples were hybridized on Agilent Whole Human Genome Oligo Microarrays (Design ID 014850) (Agilent Technologies, Palo Alto, CA), comprising over 41,000 human gene-coding sequences as probes. Arrays were scanned with the Agilent DNA Microarray Scanner. Data was processed with Agilent Feature Extraction 9.1 and analyzed in Agilent GeneSpring 7.3.1.
Data normalization involved flooring values below 5.0–5.0, and median normalizing to the 50th percentile. To find significantly regulated genes, fold changes between the compared groups and p-values gained from t-test between same groups were calculated. The t-tests were performed on normalized data that had been log transformed and the variances were not assumed to be equal between sample groups. The results represent the mean values from three independent experiments. A list of differentially expressed genes was generated by applying a t-test with a p-value <0.05 between the AGE treated group and the untreated group, and by applying a fold change filter with a cut-off >2.0. Linearization of the data was undertaken by a log2 transformation.
2.6. Real-time quantitative reverse transcription-PCR (qRT-PCR)
Reverse transcription (RT) reactions were carried out for each RNA sample (1 μg) using Superscript III RT reagents (Invitrogen Canada, Burlington, ON, Canada). Real-time PCR was performed with the ABI prism 7300 Sequence Detection System (Applied Bio-systems, Foster City, CA). SYBR Green PCR Master Mix (Applied Bio-systems, Foster City, CA) was used on cDNA samples in 96-well optical plates and analyzed using quantitative RT-PCR methods as previously described [11]. Oligonucleotide primers for all genes of interest, as listed in Table 3, and for housekeeping gene, glycer-aldehyde-3-phosphate dehydrogenase (GAPDH), were designed for real-time PCR using the Primer Express 2.0 software (Applied Bio-systems, Foster City, CA). All primers were purchased from Proligo (Proligo LL, Boulder, CO). Relative quantification of gene expression was performed using the fold change method as described previously [11] and as recommended by the manufacturer of the ABI prism 7300 Sequence Detection System. The relative gene expression was represented by the difference between the normalized values of the experimental samples to that of corresponding sham-controls (ΔΔCt). The 2−ΔΔCt for each product was used to calculate fold changes.
Table 3.
(A) RT-PCR primers for up-regulated genes. (B) RT-PCR primers for down-regulated genes.
| Gene | Forward primer | Reverse primer |
|---|---|---|
| (A) | ||
| CCL5 | CATCTGCCTCCCCATATTCCT | GCGGGCAATGTAGGCAAA |
| CXCL11 | TGGTTACAGTGGAGACATTGACATT | GCTTTACGACACATAGATGCTTTTG |
| IFIT2 | TGGCAAAAGATTGGACTAAGACACT | CCCAGCAATTCAGGTGTTAACA |
| IFIT3 | TGAAGGAGAGCAGTTTGTTGAAGA | ACTGCGGAGGACATCTGTTTG |
| HERC5 | GGGATGAAAGTGCTGAGGAGAAT | ACCCTGTGCAGCTTCTTCAAC |
| OASL | ACCTGAGGATGGAGCAGAGAGT | CCCTGGTCTGGATGGTGAAG |
| BIRC4BP | GAAAGCACCAAGAAGCAAAAACA | TGGGCTTGGGCTCTGACA |
| NCF2 | CAGACCGAAAACCCCAGAGA | CAGGCACAAACCCAAATAGCA |
| GBP4 | GGTTGCTTGTTTTTCGCTTGTAA | CCAACTATGCATCCAACAAAGATCTA |
| PARP14 | CGACTGTGACCAGATAGTGAAGAGA | TTGGAGATGGTGGCATTGC |
| ANGPTL1 | CTGCTGGGAGGTAACGAGATTC | TCAGGTGGTGGCATTAAATCTCT |
| STAT1 | GCTGTCTGAAGGAAGAAAGGAAAA | CCGACTGAGCCTGATTAAATCTC |
| IFIH1 | CCTTCCTCAGATACTGGGACTAACA | TTCTTCAGCTTTGGCTTGCTT |
| TRIM14 | CAGAGAGCAACTTGACATCATGAAT | CGGGCTCCTGGCTGATACT |
| RSAD2 | TGGTGAGGTTCTGCAAAGTAGA | TCACAGGAGATAGCGAGAATGTC |
| (B) | ||
| C8B | CAACCCAGCCATCATCAAAGT | GCAAAATCTGTGGCTGTCACTAGT |
| CALN1 | CATCCCGCACCAGCATTT | GCACAGGCGGCAAAGCT |
| GABRG2 | TCTCTGCTCTGGTGGAGTATGG | TCTTTGTCCTTGCTTGGTTTCC |
| SLC38A4 | GCATTCTCAGAACATCAAACAAAAA | GCAAGACTGAGAGAAGACATTAAATGG |
| GCNT3 | TTCTTGCTTCCCAAATGTCTTCA | GGACCAGGAGGCATAAACCA |
| KLK13 | CAAAGACTCCTGTGAGGGTGACT | GGAGACGATGCCATACAGTGTTC |
| ICOS | CCCTGGCCCTTCAAGATAGC | CATGCAGACAGGAAGTAGAGAAAATATT |
| IL1F8 | TGGCTGGTTCCAGGATAGAGA | TGAACTCAGTCGCATAATGATCTG |
| MASP2 | ATGCCGTCTATGAGCAAAAACA | TCAGGGTGCCCATTCGAAT |
15 up-regulated genes were selected for validation by RT-PCR.
9 down-regulated genes were selected for validation by RT-PCR.
2.7. Western blot analysis
Protein extracts were prepared by lysing AGE-stimulated RPE cells in RIPA buffer (10 mM Tris–HCl [pH 7.4], 150 mM NaCl, 1% deoxycholic acid, 1% Triton X-100, 0.1% SDS, and 1 mM EDTA). Samples were then centrifuged at 14,000g for 25 min at 4 °C. The preparation of SDS–PAGE was performed by casting 10% polyacryl-amide gels for cytokeratin and 15% for CXCL11, as described by Laemmli [21]. Samples were blotted onto Immobilon-P PVDF membrane (Millipore, Bedford, MA) and then stained with Ponceau-S red to assess the quality of the transfer. The membranes were incubated with primary antibodies, directed against either cytokeratin (Monoclonal Anti-Pan Cytokeratin, dilution 1:500; Sigma, Saint Louis, MO) or CXCL11 (I-TAC, dilution 1:500; Santa Cruz Biotechnology, Santa Cruz, CA). Antibody directed against GRB2 (Anti-GRB2, BD Biosciences, San Jose, CA) was used as a standard for checking protein loading. IRDye800 labeled secondary antibody (LI-COR, Rockland Immunochemicals, Gilbertsville, PA) was used for infrared imaging. Membranes were scanned and visualized using the Odyssey Infrared Imaging System developed by LI-COR. The bands were analyzed using Image J (Image J 1.17 software; National Institutes of Health [NIH], Bethesda, MD). Statistical comparisons of western blot data were determined by homoscedastic one-tailed Student’s t-test. Differences were considered statistically significant when p < 0.001.
2.8. Immunohistochemistry
Human eyes were obtained from the Eye Bank of British Columbia, Canada or from Department of Pathology, Vancouver General Hospital. Methods for securing human tissue were in compliance with the Declaration of Helsinki. The protocol was approved by the Clinical Research Ethics Board (CREB) at the University of British Columbia. Eye tissues were 10% formalin fixed and embedded in paraffin to obtain 6 μm sections through the pupil and optic nerve axis. Paraffin sections were deparaffinized and rehydrated by standard procedures. After antigen retrieval in protease K solution (20 μg/ml, pH 8.0) for 10 min at room temperature, sections were blocked with 0.3% H2O2 for 15 min and 3% horse or goat serum for 40 min. Antibodies against AGE (1:125, Clone 6D12, Wako, VA) and CXCL11(1:100, Santa Cruz, CA) were applied as primary antibodies at 4 °C overnight. Primary antibody omission or nonimmune isotype antibodies were used as negative controls. Sections were then incubated in appropriate secondary antibodies and were developed in ABC–AEC system or ABC–VIP system (Vector Laboratories, CA).
2.9. Bio-Plex cytokine assay
Supernatants from stimulated cell cultures were measured for their cytokine content with a Bio-Plex human cytokine assay (Bio-Rad Laboratories, Hercules, CA). The Bio-Plex cytokine assay was designed for quantitative measurement of multiple cytokines using 50 μl of sample in a single well. In our experiments, the pre-mixed multiplex beads of the Bio-Plex human cytokine 27-plex assay (Bio-Rad Cat #M50-0KCAF0Y) and a 3-plex were employed. They included the following cytokines: IL-1β, IL-1rα, IL-2, IL-4, IL-5, IL-6, IL-7, IL-8, IL-9, IL-10, IL-12 (p70), Il-13, IL-17, basic FGF, Eotaxin, G-CSF, GM-CSF, IP-10, IFN-γ, MCP-1 (MCAF), MIP-1α, MIP-1β, PDGF-BB, RANTES, TNF-α, VEGF and MCP-3, TRAIL and SDF-1α. 50 μl of cytokine standards, samples (tissue culture supernatants recovered from treated cells) and blanks (sample matrix only) were incubated with 25 μl of anti-cytokine conjugated beads in 96-well filter plates for 30 min at room temperature, with agitation (1100 rpm for 30 s, then 300 rpm for 30 min). Plates were then washed by vacuum filtration three times with 100 μl of Bio-Plex wash buffer per well, followed by the addition of 25 μl of diluted biotinylated detection antibody. Plates were incubated for 30 min at room temperature with shaking (as described above). After three filter washes (described above), 25 μl of streptavidin–phycoerythrin (SAPE) were added and the plates were incubated for 10 min at room temperature with agitation. Finally, plates were washed by vacuum filtration three times; beads were re-suspended in 125 μl of Bio-Plex assay buffer, and vortexed for 30 s at 1100 rpm and further incubated for 2 min at 300 rpm. Standards, samples and blanks were analyzed using the Bio-Plex 200 Suspension Array System and subsequent raw median fluorescent intensity (MFI) data was captured and analyzed using Bio-Plex Manager software 4.1 (Bio-Rad Laboratories), using a standard low PMT setting. Standard curves were developed using Brendon’s 5 Point logistic regression analysis and a recovery range of 70–130% was established for the determination of a statistically valid standard curve, as per manufacturer’s protocols.
2.10. Gene set enrichment analysis (GSEA)
To test for sets of related genes that might be systematically altered in AGE treated human RPE cells, gene set enrichment analysis (GSEA) was employed as previously described [22,23]. The gene sets were screened against the GSEA-ranked microarray data sets in order to calculate enrichment score (ES), which reflects the degree to which a gene set is overrepresented at the extreme top or bottom of the ranked microarray data set list of genes. A total of 1892 curated gene sets containing genes whose products are involved in specific metabolic and signaling pathways were obtained from pathway databases or from peer-reviewed published material. The curated gene sets were screened against the microarray data set and enrichment plots were generated for each gene set. An enrichment plot displays a running enrichment score as a function of the rank-ordered probes in the microarray data set. To adjust for multiple hypothesis testing, the ES for each gene was normalized to account for the size of the set, yielding a normalized enrichment score (NES). The proportion of false positive points was calculated using a false discovery rate (FDR) corresponding to each NES [22,23].
The GSEA method is complementary to the single gene approaches where a relatively strong effect is required from the candidate gene associated with a low variability in the population. Conversely, GSEA is most valuable in detecting weak, but synchronized changes in the expression of multiple members of a single pathway, which is a signature for common complex disorders. In addition, Leading Edge Analysis was utilized from GSEA to examine the genes in the leading edge subsets of highly enriched gene sets at the top of the ranked list of gene sets. These are the genes that contribute the most to the final enrichment score for the whole pathway. The leading edge genes frequently expressed across multiple gene sets are more likely to be of biological interest than the ones with single representation.
3. Results
3.1. AGE immunoreactivity in postmortem donor eyes with drusen
AGEs are a constituent of drusen and accumulate in Bruch’s membrane with age. Immunohistochemical studies identified AGE in the outer retina in older postmortem eyes, and in drusen (Fig. 1).
Fig. 1.
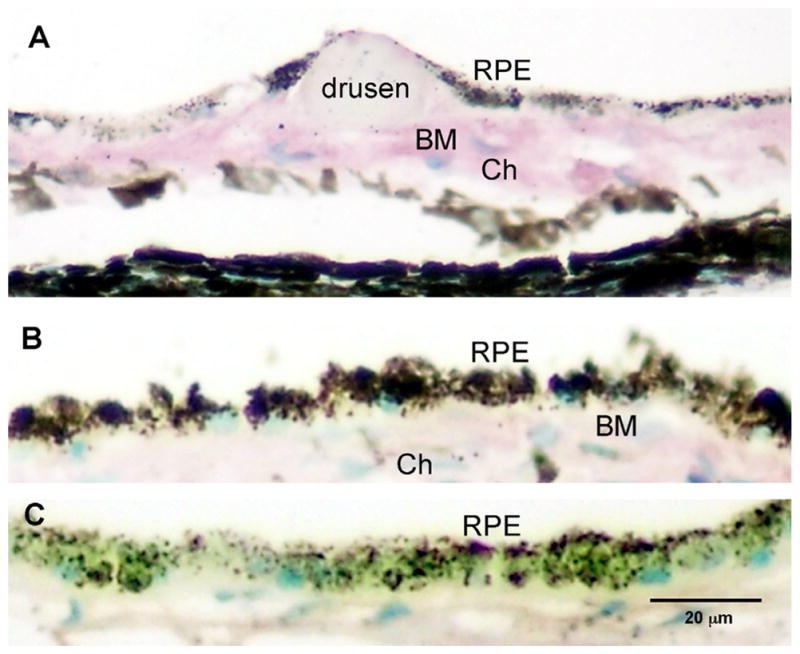
Human postmortem eye with AGE immunoreactivity. Intensity of AGE immunoreactivity in the outer retina of the AMD eye with drusen (>70 yrs of age) compared to a young, normal eye without drusen (<55 yrs of age). Intense immunoreactivity (purple) is seen in Bruch’s membrane (BM) and choroid (Ch) in the older donor eye with drusen (A). In the younger eye (<55 yrs), less immunoreactivity is seen in choroid and BM (B). Replacement of the primary antibody with a non-specific IgG serum served as control and demonstrated non-specific background immunoreactivity levels (C). Scale bar is (C) represents magnification for A–C.
3.2. Cytokeratin content of cultured cells
Human RPE cells in culture demonstrate hexagonal morphological profiles and pigment characteristic of RPE (Fig. 2). Initial experiments were performed to verify that the cells cultured for these studies possessed cytokeratin, a known marker for RPE cell. The expression of cytokeratin was examined with monoclonal anti-pan cytokeratin, which recognizes human cytokeratins 1, 4, 5, 6, 8, 10, 13, 18 and 19. Detection of prominent bands ranging from 40 kDa to 68 kDa confirmed the presence of cytokeratin in cells isolated from RPE layer of fetal human donor eyes. Antibody directed against growth factor receptor bound protein 2 (GRB2) was used as a standard for checking protein loading and was seen at a band at 24 kDa.
Fig. 2.
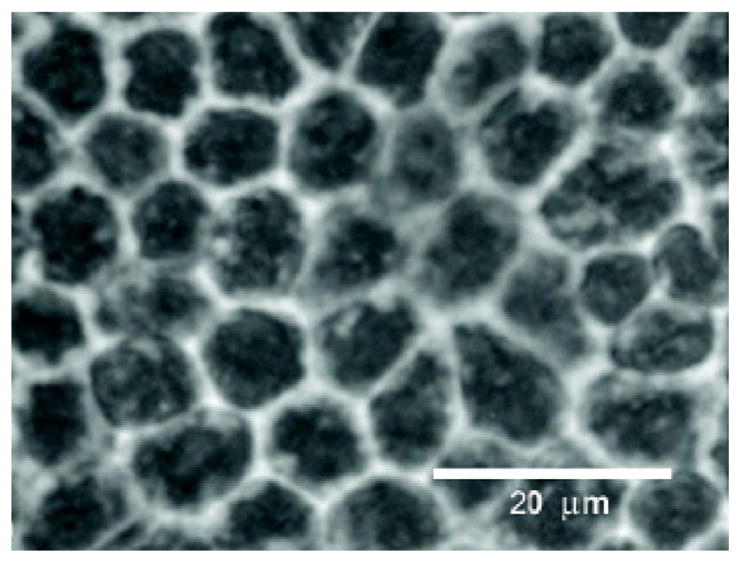
Phase contrast photomicrograph of primary culture of RPE cells at passage 1–2. Representative examples of the morphology of cells used in this study. Note the hexagonal cell profiles and pigment granules (black) within the RPE cells. Scale bar = 20 μm.
3.3. Levels of carboxymethyllysine in AGE-BSA
Carboxymethyllysine in AGE-BSA was quantified using CML ELI-SA kit (Cell Biolabs, INC, San Diego, CA). The average delta of optical density at 450 nm was 3.57 in AGE-BSA and 0 in BSA. The CML-BSA measured as 49.4 ng/ml and the CML concentration was 2.17 ng/ml. The amount of CML/AGE total protein was 1063 pmol/mg protein.
3.4. Cell viability assay
Fig. 3 shows the dose-dependent effects of AGE stimulation at 24 h. A mild proliferative effect of AGE stimulation on RPE cells was observed at lower concentrations of AGE (0.01–0.1 μg/ml) with cell viability levels slightly but significantly greater than controls at 128% and 105% respectively. Between higher concentrations of 1–100 μg/ml of AGE, a dose dependent reduction in RPE cell viability was observed. Cell viability was measured at 86.8%, 85%, 72.1% and 64.8% at 1 μg/ml, 10 μg/ml, 50 μg/ml and 100 μg/ml concentration of AGE respectively.
Fig. 3.

RPE cell viability after AGE stimulation. MTT assay was performed at 24 h post AGE stimulation and the percentage of RPE cell survival after AGE stimulation was calculated. A dose dependent decrease in cell viability is seen. A dosage of 10 μg/ml was chosen for stimulation studies based on this dose response curve as well as the literature that reported physiological levels of AGE in human sera between values of at 2–10 μg/ml [20,33]. Cell viability grown under several control conditions such as DMEM only, unmodified BSA at 10 μg/ml, and DMEM and 1% FBS are also shown.
3.5. Gene expression analysis of RPE cells after AGE stimulation
The gene expression response of RPE cells following 10 μg/ml AGE stimulation was undertaken using Agilent Whole Genome Oligo arrays. Selection of an appropriate stimulation concentration was primarily based on our RPE cell viability assay and references to reported physiological levels of known AGE in normal human sera in the range of 2–10 μg/ml [20]. There are many uncharacterized AGEs in human sera and thus the actual level of AGEs in human sera is unknown, but is likely to be higher than levels reported here.
At 24 h, we observed 41 up-regulated and 18 down-regulated previously known genes whose expression changed by >2.0-fold with p < 0.05 (Fig. 4, black bars; Tables 1 and 2). Up-regulated genes included many in the immune response, pro-inflammatory cytokines, angiogenesis and apoptosis-related categories. The five up-regulated genes that exhibited the highest fold changes were CXCL11 (11.12 ± 0.77), RSAD2 (8.37 ± 0.57), IFIT2 (5.82 ± 0.12), OASL (5.07 ± 0.37), and IFIT3 (4.95 ± 0.20). These genes play a role in the immune response and trigger pro-inflammatory pathways. Other categories that were up-regulated include apoptotic genes (BIRC4BP: 4.69 ± 0.12), angiogenic genes (ANGPTL1: 4.30 ± 0.25), and cell adhesion (EPSTI1: 2.69 ± 1.91; ACTN2: 2.51 ± 0.14; ITGA2: 2.1 ± 0.72), signal transduction (STAT1: 2.66 ± 0.78; EPHB1: 2.13 ± 1.56), and proteolysis (IFRG28: 4.15 ± 0.46).
Fig. 4.

Differential gene expression of RPE cells after 10 μg/ml AGE stimulation for 24 h. Fold changes (normalized to GADPH household gene) are compared between Agilent OligoMicroarray (black bars) and qRT-PCR (gray bars). Values are expressed as relative fold changes with respect to their corresponding (untreated) controls. Primers used for each gene product are shown in Table 3. All data shown demonstrated a >2.0-fold change and reached significance (p < 0.05). The largest upregulated fold changes were seen in CXCL11, RSAD2 and IFIT2. The greatest downregulated fold changes were seen in C8B, CALN1 and GARBG2. Data represent the mean ± SD of three independent experiments for both microarray and qRT-PCR. The Pearson’s correlation coefficient of the microarray data and the PCR for the genes shown in red and blue is 0.89 (p < 0.05).
Table 1.
Upregulation of differentially expressed genes in AGE-treated RPE cells at 24 h.
| Name | Description | Genbank accession no. | Change (x-fold) | p |
|---|---|---|---|---|
| Immune response | ||||
| CXCL11a | Homo sapiens chemokine (C-X-C motif) ligand 11 (CXCL11), mRNA | NM_005409 | 11.12 | 0.035 |
| RSAD2a | Homo sapiens radical S-adenosyl methionine domain containing 2 (RSAD2), mRNA | NM_080657 | 8.73 | 0.031 |
| IFIT2a | Homo sapiens interferon-induced protein with tetratricopeptide repeats 2 (IFIT2), mRNA | NM_001547 | 5.82 | 0.009 |
| OASLa | Homo sapiens 2′-5′-oligoadenylate synthetase-like (OASL), transcript variant 1, mRNA | NM_003733 | 5.07 | 0.014 |
| IFIT3a | Homo sapiens interferon-induced protein with tetratricopeptide repeats 3 (IFIT3), mRNA | NM_001549 | 4.95 | 0.009 |
| NCF2a | Homo sapiens neutrophil cytosolic factor 2 (65 kDa, chronic granulomatous disease, autosomal 2) (NCF2), mRNA | NM_000433 | 4.3 | 0.02 |
| GBP4a | Homo sapiens guanylate binding protein 4 (GBP4), mRNA | NM_052941 | 4.28 | 0.005 |
| PARP14a | Homo sapiens poly(ADP-ribose) polymerase family, member 14 (PARP14), mRNA | NM_017554 | 3.84 | 0.003 |
| HERC5a | Homo sapiens hect domain and RLD 5 (HERC5), mRNA | NM_016323 | 3.77 | 0.02 |
| CCL5 | Homo sapiens chemokine (C–C motif) ligand 5 (CCL5), mRNA | NM_002985 | 3.34 | 0.025 |
| DDX58 | Homo sapiens DEAD (Asp-Glu-Ala-Asp) box polypeptide 58 (DDX58), mRNA | NM_014314 | 3.22 | 0.019 |
| OAS1 | Homo sapiens 2′,5′-oligoadenylate synthetase 1, 40/46 kDa (OAS1), transcript variant E16, mRNA | NM_002534 | 3.15 | 0.049 |
| IFIH1a | Homo sapiens interferon induced with helicase C domain 1 (IFIH1), mRNA | NM_022168 | 3.09 | 0.012 |
| USP18 | Homo sapiens ubiquitin specific protease 18 (USP18), mRNA | NM_017414 | 2.97 | 0.044 |
| OAS3 | Homo sapiens 2′-5′-oligoadenylate synthetase 3, 100 kDa (OAS3), mRNA | NM_006187 | 2.86 | 0.041 |
| PMCH | Homo sapiens pro-melanin-concentrating hormone (PMCH), mRNA | NM_002674 | 2.85 | 0.046 |
| PLSCR1 | Homo sapiens phospholipid scramblase 1 (PLSCR1), mRNA | NM_021105 | 2.79 | 0.028 |
| IFI44 | Homo sapiens interferon-induced protein 44 (IFI44), mRNA | NM_006417 | 2.75 | 0.02 |
| SAMD9 | Homo sapiens sterile alpha motif domain containing 9 (SAMD9), mRNA | NM_017654 | 2.67 | 0.035 |
| IFIT1 | Homo sapiens interferon-induced protein with tetratricopeptide repeats 1 (IFIT1), transcript variant 2, mRNA | NM_001548 | 2.58 | 0.026 |
| MX2 | Homo sapiens myxovirus (influenza virus) resistance 2 (mouse) (MX2), mRNA | NM_002463 | 2.5 | 0.028 |
| SAMD9L | Homo sapiens sterile alpha motif domain containing 9-like (SAMD9L), mRNA | NM_152703 | 2.49 | 0.036 |
| EIF2AK2 | Homo sapiens eukaryotic translation initiation factor 2-alpha kinase 2 (EIF2AK2), mRNA | NM_002759 | 2.48 | 0.035 |
| ZC3HAV1 | Homo sapiens zinc finger CCCH-type, antiviral 1 (ZC3HAV1), transcript variant 2, mRNA; also known as ZAP | NM_024625 | 2.38 | 0.029 |
| SP110 | Homo sapiens SP110 nuclear body protein (SP110), transcript variant b, mRNA | NM_004510 | 2.34 | 0.014 |
| PARP10 | Homo sapiens poly(ADP-ribose) polymerase family, member 10 (PARP10), mRNA | NM_032789 | 2.2 | 0.028 |
| PARP12 | Homo sapiens poly(ADP-ribose) polymerase family, member 12 (PARP12), mRNA | NM_022750 | 2.2 | 0.025 |
| C1QR1 | Homo sapiens complement component 1, q subcomponent, receptor 1 (C1QR1), mRNA | NM_012072 | 2.08 | 0.044 |
| PARP9 | Homo sapiens poly(ADP-ribose) polymerase family, member 9 (PARP9), mRNA | NM_031458 | 2.03 | 0.038 |
| Apoptosis | ||||
| BIRC4BPa | Homo sapiens XIAP associated factor-1 (also known as XAF1), transcript variant 1, mRNA | NM_017523 | 4.69 | 0.001 |
| PRDX3 | Homo sapiens PRO1748 mRNA, complete cds | AF118073 | 2.85 | 0.039 |
| Cell adhesion | ||||
| EPSTI1 | Homo sapiens epithelial stromal interaction 1 (breast) (EPSTI1), mRNA | NM_033255 | 2.69 | 0.046 |
| ACTN2 | Homo sapiens actinin, alpha 2 (ACTN2), mRNA | NM_001103 | 2.51 | 0.039 |
| ITGA2 | Homo sapiens integrin, alpha 2 (CD49B, alpha 2 subunit of VLA-2 receptor) (ITGA2), mRNA | NM_002203 | 2.1 | 0.048 |
| Angiogenesis | ||||
| ANGPTL1a | Homo sapiens angiopoietin-like 1 (ANGPTL1), mRNA | NM_004673 | 4.3 | 0.011 |
| Signal transduction | ||||
| STAT1a | Homo sapiens signal transducer and activator of transcription 1, 91 kDa (STAT1), transcript variant alpha, mRNA | NM_007315 | 2.66 | 0.034 |
| EPHB1 | Homo sapiens EPH receptor B1 (EPHB1), mRNA | NM_004441 | 2.13 | 0.027 |
| Transcription regulation | ||||
| PNPT1 | Homo sapiens polyribonucleotide nucleotidyltransferase 1 (PNPT1), mRNA | NM_033109 | 2.17 | 0.025 |
| Proteolysis | ||||
| IFRG28 | Homo sapiens 28 kD interferon responsive protein (IFRG28), mRNA | NM_022147 | 4.51 | 0.025 |
| DTX3L | Homo sapiens deltex 3-like (Drosophila) (DTX3L), mRNA | NM_138287 | 2.16 | 0.05 |
| Unknown | ||||
| TRIM14a | Homo sapiens tripartite motif-containing 14 (TRIM14), transcript variant 1, mRNA | NM_014788 | 2.67 | 0.019 |
The data are presented as x-fold changes.
The expression level of genes greater than 2-fold was considered upregulated (p < 0.05).
Genes that are selected for verification by RT-PCR.
Table 2.
Down-regulation of differentially expressed genes in AGE-treated RPE cells at 24 h.
| Name | Description | Genbank accession no. | Change (x-fold) | p |
|---|---|---|---|---|
| Immune response | ||||
| MASP2a | Homo sapiens mannan-binding lectin serine protease 2 (MASP2), transcript variant 1, mRNA | NM_006610 | −2.04 | 0.011 |
| IL1F8a | Homo sapiens interleukin 1 family, member 8 (eta) (IL1F8), transcript variant 2, mRNA | NM_173178 | −2.08 | 0.004 |
| ICOSa | Homo sapiens inducible T-cell co-stimulator (ICOS), mRNA | NM_012092 | −2.11 | 0.044 |
| C8Ba | Homo sapiens complement component 8, beta polypeptide (C8B), mRNA | NM_000066 | −2.82 | 0.023 |
| Cell adhesion | ||||
| PCDH12 | Homo sapiens protocadherin 12 (PCDH12), mRNA | NM_016580 | −2.03 | 0.028 |
| Signal transduction | ||||
| MRAP | Homo sapiens melanocortin 2 receptor accessory protein (MRAP), transcript variant 1, mRNA | NM_178817 | −2.32 | 0.050 |
| ADCY5 | Homo sapiens adenylate cyclase 5 (ADCY5), mRNA | NM_183357 | −2.59 | 0.005 |
| CALN1a | Homo sapiens calneuron 1 (CALN1), transcript variant 1, mRNA | NM_031468 | −2.71 | 0.013 |
| Transcription regulation | ||||
| FOXN4 | Homo sapiens forkhead box N4 (FOXN4), mRNA | NM_213596 | −2.00 | 0.022 |
| ZNF510 | Homo sapiens zinc finger protein 510 (ZNF510), mRNA | NM_014930 | −2.01 | 0.048 |
| DMRTC1 | Homo sapiens DMRT-like family C1 (DMRTC1), mRNA | NM_033053 | −2.15 | 0.002 |
| Transporter | ||||
| SLC4A10 | Homo sapiens solute carrier family 4, sodium bicarbonate transporter-like, member 10 (SLC4A10), mRNA | NM_022058 | −2.04 | 0.035 |
| SLC38A4a | Homo sapiens solute carrier family 38, member 4 (SLC38A4), mRNA | NM_018018 | −2.28 | 0.031 |
| GABRG2a | Homo sapiens gamma-aminobutyric acid (GABA) A receptor, gamma 2 (GABRG2), transcript variant 2, mRNA | NM_000816 | −2.56 | 0.002 |
| Metabolism | ||||
| GCNT3a | Homo sapiens glucosaminyl (N-acetyl) transferase 3, mucin type (GCNT3), mRNA | NM_004751 | −2.18 | 0.038 |
| Proteolysis | ||||
| KLK13a | Homo sapiens kallikrein 13 (KLK13), mRNA | NM_015596 | −2.14 | 0.017 |
| Unknown | ||||
| DP58 | Homo sapiens cytosolic phosphoprotein DP58 (DP58), mRNA | NM_001004441 | −2.11 | 0.040 |
| PAGE2B | Homo sapiens P antigen family, member 2B (PAGE2B), mRNA | NM_001015038 | −2.26 | 0.014 |
The data are presented as x-fold changes. Decreased expression changes are expressed as – (treatment/control)−1. The expression levels of genes decreased more than 2-fold considered downregulated (p < 0.05).
Genes that are selected for verification by RT-PCR.
Only 18 genes were down-regulated in response to AGE stimulation at 24 h. These included several immune response genes (C8B: −2.82 ± 0.65; ICOS: −2.11 ± 0.98; IL1F8: −2.08 ± 0.12), cell adhesion (PCDH12: −2.03 ± 0.15), signal transduction (CALN1: −2.71 ± 0.36; ADCY5: −2.59 ± 0.25; MRAP: −2.32 ± 0.54), transporters, transcription regulation, metabolism and proteolysis.
3.6. Confirmation of differentially expressed genes after AGE stimulation
Next, we performed qRT-PCR to validate 24 genes of interest from the data set obtained from the Agilent microarray. The gene specific primer sequences used for qRT-PCR are shown in Table 3. The amplified product for a common housekeeping gene, GAPDH, was used as a normalizer and endogenous control. The qRT-PCR derived validation of the direction and level of expression of the 24 selected genes is displayed in Fig. 4 (gray bars). The direction of expression was validated in all 24 genes by qRT-PCR. The Pearson’s correlation coefficient of the PCR and microarray data for the 24 genes was 0.89 (p < 0.05).
3.7. CXCL11 analysis
Differential gene expression of CXCL11 demonstrated a 11-fold increase in RNA levels and was the gene that demonstrated the greatest fold change in this study. We then examined CXCL11 protein levels in both AGE stimulated and unstimulated RPE cells by western blot analysis. Prominent bands of the protein are observed at approximately 9 kDa, within typical range of human chemokines. Results indicate that human RPE cells stimulated with AGE displayed an increase in CXCL11 expression, with approximately 1.24-fold elevation over the control values (Fig. 5). The difference is statistically significant (p < 0.001).
Fig. 5.
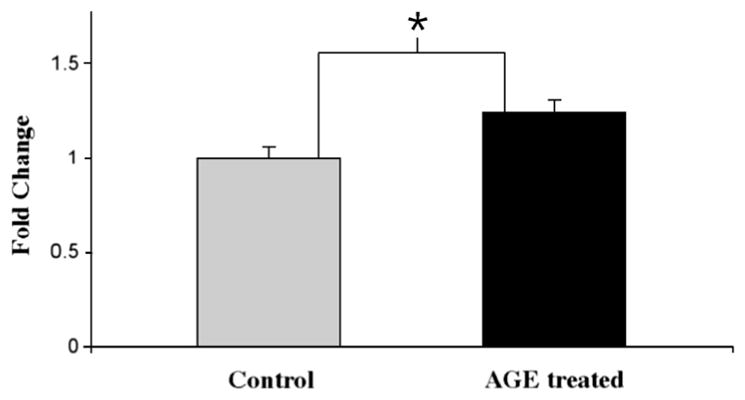
CXCL11 protein levels demonstrated by Western Blot. CXCL11 protein expression was determined by Western blot analysis and band intensities were analyzed using Image-J program. CXCL11 protein increased by 1.24-fold (±0.07 SD) in cultured human RPE cells stimulated with 10 μg/ml AGE for 24 h. The result is expressed as the mean ± SD and represents four experiments. Statistical comparisons were determined by homoscedastic one-tailed Student’s t-test. *p < 0.001 was considered significant.
In human donor eyes with AMD, immunohistochemical analysis identified CXCL11 in RPE cells overlying drusen (Fig. 6A). Less immunoreactivity was observed in RPE distant to drusen sites in the AMD eye (Fig. 6B) and in age-matched control (non-diseased) eyes (Fig. 6C). Immunoreactivity for CXCL11 was demonstrated in 8 of 8 donor eyes identified with dry AMD.
Fig. 6.

CXCL11 immunoreactivity in postmortem eye with AMD. Immunoreactivity displayed strong labeling (AEC, red/pink) of the cytoplasmic compartment of RPE cells overlying and surrounding the drusen site (arrows in A), but not in RPE cells distant to drusen sites in the AMD eye (B) or in age-matched control (non-diseased) eyes (C) Micrographs demonstrate endogenous brown pigment in RPE cells in all sections. All sections were counterstained with hematoxylin resulting in blue nuclei. Scale bar = 10 μm for A–C.
3.8. Supernatant studies
Supernatant samples from AGE stimulation of human RPE cells were assessed for their cytokine and growth factor content. Of the 30 cytokines and growth factors tested, 19 reached significance levels of p < 0.05 and are shown in Table 4. GM-CSF, a growth factor and part of the immune cascade, was secreted 23-fold higher than in controls. Secreted level of SDF-1a (5.6-fold), a proinflammatory chemokine of the CXC motif (CXCL12) and VEGF (1.8-fold), neurotrophic and angiogenic growth factor, were also higher than in controls. Secreted levels of several anti-inflammatory cytokines, IL10 (16.0-fold), IL1ra (7.5-fold), IL4 (5.5-fold) and IL9 (3.7-fold) also demonstrated high fold changes over controls. Pro-inflammatory cytokines, interferon gamma (2.3-fold), IL15 (2.9-fold), IL7 (1.6-fold) and IL12 (1.6-fold) were all higher than in controls, while other pro-inflammatory cytokines and chemokines, MCP-3 (−42.9-fold), IP10 (−28.7-fold), IL8 (−12.5-fold), RANTES (−3.6-fold), MCP-1 (1.1-fold) were significantly under-expressed compared to controls (Table 4).
Table 4.
Fold changes of secreted cytokines/growth factors after AGE treatment.
| Gene | Fold change | 24 h (pg/ml) | 24 h control (pg/ml) |
|---|---|---|---|
| GM-CSF | 23.74 | 125.60 | 5.29 |
| IL-10 | 16.00 | 8.80 | 0.55 |
| IL-1ra | 7.51 | 118.96 | 15.84 |
| SDF-1a | 5.62 | 161.53 | 28.76 |
| IL-4 | 5.53 | 5.46 | 0.99 |
| IL-9 | 3.71 | 14.36 | 3.87 |
| IL-15 | 2.94 | 35.75 | 12.15 |
| IFN-γ | 2.37 | 691.44 | 292.28 |
| VEGF | 1.86 | 15091.61 | 8093.56 |
| IL-7 | 1.65 | 36.38 | 22.09 |
| IL-12 | 1.59 | 317.47 | 199.28 |
| IL-13 | 1.33 | 61.55 | 46.24 |
| MCP-1 | 1.09 | 3586.75 | 3297.32 |
| IL-6 | −1.55 | 3291.61 | 5107.40 |
| G-CSF | −2.42 | 11.69 | 28.26 |
| RANTES | −3.66 | 29.51 | 108.09 |
| IL-8 | −12.54 | 445.06 | 5580.43 |
| IP-10 | −28.72 | 133.46 | 3833.48 |
| MCP-3 | −42.95 | 37.19 | 1597.24 |
3.9. GSEA pathway analysis
We utilized mRNA expression pattern and GSEA to uncover the functional gene sets enriched in human RPE cells treated with AGE. GSEA analysis identified 136 highly enriched gene sets from the public domain that correlated with the RPE upregulated genes after AGE stimulation of RPE in this study. Many of these published gene sets are highly enriched with genes related to interferon-responsive (immune related) pathways, proteasome activity, caspase, and DNA replication pathways. Complementary GSEA analysis with AGE downregulated genes did not identify any pathways as significantly enriched. Table 5 lists six of the highly enriched canonical gene sets selected by the GSEA analysis that have FDR below 25%, 3 of which with FDR < 3%, and therefore can potentially have important biological relevance [22,23]. AGE stimulation of RPE induced strong activation of genes associated with interferon signaling, proteasome degradation, caspase and DNA replication pathways. These pathways had the lowest false discovery rate (FDR < 3%) suggesting coordinated changes in the expression of the genes within these pathways. In addition, of biological interest were the toll-like receptor signaling and neurodegenerative disease pathways with FDR < 25%.
Table 5.
Highly enriched canonical gene sets selected by GSEA from the public domain
| Name | Genes size | NES | FDR | q-Val |
|---|---|---|---|---|
| Interferon induced genes | ELF1 XRCC6 PMAIP1 IQGAP1 FUBP1 BAK1 DDX17 BAG1 ISG15 PLOD2 CASP8 IL15RA DDX21 FAS MX1 HADH MX2 FOSL1 ADAM9 ICAM1 RBBP4 PDXK PRAME BST2 GMPR HLA-E CD164 VAT1 PLAUR VEGFC HIF1A PSME1 BTG1 MAP3K10 SDCBP EIF2AK2 SRP9 PPP5C BCLAF1 NMI IFITM1 CALD1 SHFM1 PML TR | 77 | 2.58 | 0.00 |
| Proteasome_degradation | PSMA7 UBE2D3 PSMB7 UBE2D2 PSMB6 UBE1L PSMD1 IFNG PSMD2 H2AFZ PSMD3 H2AFX PSMD4 PSMD5 UBE2D1 PSMD8 RPS27A MKI67 PSMB9 PSMA1 PSMC6 PSMC5 PSMC4 PSMA6 PSMC3 PSME2 PSMA4 PSMC2 PSMC1 UBE1 UBC UBA52 | 32 | 2.27 | 0.00 |
| Caspase pathway | PRF1 ADPRT LMNB1 DFFA LMNB2 DFFB CYCS LMNA GZMB BIRC4 BIRC3 BIRC2 CASP10 CASP6 CASP3 CASP4 CASP9 CASP7 CASP8 APAF1 CASP1 CASP2 ARHGDIB | 23 | 1.85 | 0.02 |
| DNA_replication_reactome | NACA RPS27A LOC388720 LOC389425 DIAPH2 PRIM2A POLA2 MCM10 RPA4 RPA3 CDT1 ASK PRIM1 RPA1 RPA2 ORC2L CDC45L MCM7 ORC4L POLE2 ORC6L RPS27A CDC7 CDC6 GMNN POLE FKSG17 MCM2 POLA MCM3 MCM4 CDK2 ORC1L MCM5 MCM6 RFC5 POLD3 POLD4 RFC3 RFC4 ORC3L RFC1 RFC2 POLD1 PO | 46 | 1.82 | 0.03 |
| Toll_like_receptor_signaling_pathway | TBK1 TLR1 TIRAP TLR2 TLR3 TLR4 TLR5 TLR6 CXCL11 TLR7 TLR8 CXCL10 TLR9 MAP3K7 MYD88 MAP3K8 IL1B PIK3CA MAP2K7 MAP2K6 PIK3CG PIK3CB RELA PIK3CD FADD CD40 MAPK1 IFNB1 JUN MAPK3 MAPK9 MAPK8 MAP3K7IP1 CCL3 NFKBIA CCL5 CCL4 MAP3K7IP2 IRAK4 IFNA2 IFNA1 IFNA7 IFN | 92 | 1.40 | 0.22 |
| Neurodegenerative_diseases | ALS2 GFAP VAPB GRB2 UCHL1 SNCA PINK1 BCL2L1 APLP1 SETX CASP6 CASP3 APP ATN1 APOE CASP7 BCL2 MAPT CASP8 NEFH HSPA5 CASP1 GAPDH APBA1 HTT CREBBP NR4A2 PARK2 BAD SOD1 PARK7 EP300 PSEN1 BAX PSEN2 NGFR LRRK2 PRNP | 34 | 1.39 | 0.22 |
Within GSEA, leading-edge analysis uncovered a subset of genes from our microarray data that appeared across the 136 highly enriched gene sets from the literature (Fig. 7). Virus resistance genes (MX1, MX2), interferon induced proteins (IFIT3, IFITM1, IFI27, IFI44L), and the transcription factor STAT1 involved in interferon signaling were among the top 20 leading edge gene hits and support interferon responsive pathways (Supplementary Table 1). The GSEA leading-edge analysis also found that several chemokine genes (CCL5, IP10) participate across multiple enriched gene sets, supporting the notion that activation of immune response pathways is one of the mechanisms of AGE-induced RPE cells activation.
Fig. 7.

GSEA leading edge gene sets analysis. The GSEA analysis selects the genes that appear across multiple enriched gene sets (y-axis) from the public databases. These genes (x-axis) are considered to have higher biological significance. The analysis of our microarray data identified genes highly correlated with interferons, proteasome degradation, caspase pathways, DNA replication, toll-like receptor signaling and neurodegeneration.
AGE induced a coordinated activation of proteasome subunit genes in the RPE cells. The 26S proteasome ATPase subunits PSMC1, PSMC2, PSMC3, PSMC4, the 20S proteasome core subunits, including PSMB7, one of the beta catalytic subunits, PSMB9 antigen processing subunit of the immunoproteasome, the PSMA4, PSMA6, PSMA7 alpha subunits, and the 19S regulator subunit PSME2 were central for the core enrichment of the proteasome degradation pathway. This implies that the proteasome activity was profoundly changed (increased) as a result of the AGE stimulation of RPE cells (Supplementary Table 2).
GSEA analysis also identified that the up-regulated genes were enriched in caspase genes and suggested a relationship between caspases 1, 2, 3, 4, 6, 7 and 10, the apoptotic regulator (TNFSF10), cytochrome c, anti-apoptotic response gene (BCL2) and receptor-interacting serine/threonine protein kinase 1 (RIPK1) known to function in the NFkB pathway and in necroptosis. These genes provide the major contribution to the total enrichment score for the caspase gene set (Supplementary Table 3) suggesting a significant role of the apoptotic processes induced by AGE stimulation.
4. Discussion
The etiology of AMD is unclear but it is characterized by early, clinical findings including drusen and RPE changes. AGE is not only a component in drusen, but is known to accumulate in Bruch’s membrane and has been implicated in age-related diseases such as Alzheimer’s disease [24,25], atherosclerosis [26,27], and diabetic complications [28,29]. The effect of chronic RPE exposure to AGE may be an important step in dysregulation of RPE function leading to RPE atrophy and photoreceptor degeneration. In this study, we investigated the cellular and molecular pathways triggered by AGE stimulation on primary culture human RPE cells in order to gain evidence for whether AGE stimulation cause changes in RPE gene expression, and to further identify if these changes occur in the outer retina of the AMD eye. As far as we know, our studies on primary culture of human RPE, arguably one of the best in vitro systems to undertake these translational studies, are the first to validate and confirm earlier studies on mouse RPE and human RPE cell lines [6–8,10].
4.1. AGE-BSA
Advanced glycation endproducts is a broad term that includes various proteins and lipids that undergo chemical reactions after exposure to sugars. Well described AGEs in the literature include CML and pentosidine. In this study, the AGE-BSA used was obtained from BioVision and was produced using a previously described method by Farboud et al. [14]. In their paper, Farboud et al. quantified the level of pentosidine in AGE-BSA using HPLC. We further quantified the CML levels using an ELISA assay. Although CML and pentosidine are adducts formed in the Maillard reaction, other less well described AGE-BSA are likely present and unaccounted for. The types and amounts of AGE produced is methodology-specific, thus making direct comparisons between studies difficult. Another possible limitation is the use of BSA for the formation of AGE-BSA which may be non-physiologic and thus may not necessarily correlate with exact physiologic activities of AGE found in human plasma.
4.2. Novel genes: CXCL11 and RSAD2
Exposure of RPE to AGE at 10 μg/ml, known to be within the range of physiological levels in normal human sera, reduced the RPE cell viability by 15%. Microarray analyses revealed that after AGE stimulation, multiple inflammation and interferon-induced genes were differentially expressed in RPE, a finding confirmed with the qRT-PCR analyses. CXCL11 leads the list of up-regulated mRNA at 11.12-fold increase with AGE stimulation. CXCL11 is a potent ligand for CXCR3, which is expressed on activated endothelial cells, T lymphocytes, and NK cells. CXCR3 signaling is involved in leukocyte trafficking, cytoskeletal rearrangement and chemotactic migration [30]. It has been implicated in various inflammatory disease such as atherosclerosis, type I diabetes and pulmonary fibrosis [30]. Recently, Cao et al. reported that the CXCL11 transcript, an M1 proinflammatory phenotype of the macrophage, is up-regulated in AMD [31], a finding that is consistent with immunohistochemistry for CXCL11 in the AMD eye (Fig. 6) shown here. Interestingly, CXCL11 is more highly expressed in younger eyes (<57 yrs) compared to older eyes (>70 yrs), and particularly those younger eyes with drusen as shown in our recent study on postmortem eyes [32]. It is possible that this gene is one of the first responders to the gradual AGE accumulation in the outer retina in eyes with drusen, and is a novel gene of interest for its potential involvement in early stages of outer retinal dysfunction and AMD progression.
RSAD2 is another gene of interest which was highly upregulated in this study. RSAD2 is an antiviral protein and implicated in atherosclerosis [33]. It is associated with inflammatory responses and abnormal lipid accumulation. Interestingly, RSAD2 was also up-regulated in RPE cells in response to stimulation with amyloid-β [11] and it was shown to co-localize with drusen and outer retina sites in human postmortem eyes [32]. RSAD2 and its function in the retina warrants further attention and may be a candidate marker of inflammatory events in the outer retina.
4.3. Pathways of interest
The secreted levels of IFN-γ observed in the supernatant after AGE stimulation also support the interferon-induced pathways identified by GSEA. Interferon played a large role in RPE cell immune response to AGE. Suspension array-based cytokine assays show upregulation of IFN-γ, which in combination with other cytokines, activates RPE cells and is commonly seen in retinal inflammation [34,35]. IFN-γ can also reduce complement factor H (CFH) activity via acetylation of FOXO3 [36]. CFH prevents uncontrolled complement activation and inflammation; hence, a down regulation of CFH by IFN-γ will increase inflammation in the outer retina and its surrounding structures.
GSEA analysis also identified the proteasome degradation pathway implicated in the RPE response to AGE stimulation. Poly(ADP-ribose) polymerase (PARP) family members PARP 9, 10, 12, and 14 were up-regulated following AGE stimulation in human RPE cells. The function of PARP is to regulate gene transcription by modifying chromatin organization by detecting DNA damage and eliciting an appropriate repair mechanism, including proteasome activation [37]. Local inflammation can induce cytokines that up-regulate the expression of immunoproteasomes whose function is to synthesize immunogenic peptides in response to cellular stress [38]. Increased PARPs, proteasomes, and ubiquitin-associated genes may reflect the oxidative stress induced by ROS associated with the RPE cell’s response to AGE (Fig. 7), as the immunoproteasome may have a role in oxidative stress protection in AMD [38,39].
4.4. Pattern recognition receptors (PRRs) for AGE
The significant involvement of interferon and interferon-inducible products such as IP10 (CXCL10) [40] and RSAD2 identified in our study [11] suggests a prominent role of Toll-like receptors (TLRs) in the RPE response to AGE stimulation [41]. This finding is further supported by the secreted cytokine assay, where GM-CSF was the highest secreted cytokine. GM-CSF can be induced by lipopolysaccharide (LPS) [42], a well-known ligand for TLR4. TLR4 is found on human RPE cells and also serves as a receptor for AGE [41,43]. TLR signaling pathways are initiators of several pro-inflammatory cytokines and TLR signaling pathways are initiators of several pro-inflammatory cytokines and are identified as one of the six key pathways by GSEA (Table 5).
Another PRR is the extracellular receptors for advanced glycation endproduct (RAGE). RAGE has been implicated in AMD pathogenesis [44] and is important receptors for several pro-inflammatory pathways and cytokines [45–48]. Activation of RAGE by AGE can result in the formation of reactive oxygen species (ROS), which, when uncontrolled, can lead to cell damage and further AGE formation [43].
Both TLRs and RAGE signal through NF-κB pathway upon ligand binding [49] (Fig. 8). Our findings suggest that up-regulation of NF-κB dependent cytokines such as GM-CSF and CXCL11 is an important response of the RPE cell to AGE stimulation. These cytokines have been implicated in RPE inflammation [42,50,51] but this is the first time is has been shown to be up-regulated after AGE stimulation. Other up-regulated genes that have NF-κB binding sites include VEGF, a critical cytokine in the wet AMD disease process [52]. Secreted VEGF levels were up 1.86-fold over controls in our study (Table 4).
Fig. 8.

Potential cellular response pathways of RPE cells upon AGE stimulation. The two main signaling pathways suggested by our data are the NF-κB pathway and the JAK-STAT pathway. Extracellular receptors that bind AGE known to be present on RPE cells include toll-like receptors (TLRs), receptors for advanced glycation endproducts (RAGEs), and advanced glycation endproducts receptors (AGERs). RAGEs and TLRs are mainly responsible for inflammatory processes within the cell and AGERs are important inhibitors of these signals. Supernatant data that support the two pathways are shown in purple retangles. mRNA data that support the pathways are shown in orange ovals. Studies from the literature that support the pathways shown include: 1, Vlassara and Striker [43]; 2, Chen et al. [62]; 3, Yang et al. [51]; 4, Kim et al. [34]; 5, Oeckinghaus et al. [67]; 6, Kato et al. [68].
4.5. Para-inflammation
Our data indicate a complex regulation of inflammatory and anti-inflammatory cytokines secreted by RPE in response to AGE stimulation. There is both up- and down-regulation of inflammatory and anti-inflammatory cytokines from the Bio-Plex cytokine assay. GM-CSF, a growth factor and part of the immune cascade, is the highest secreted cytokine and possesses inflammatory properties [42,50].
IL-10 and IL-1ra, the second and third highest secreted cytokines, possess anti-inflammatory properties (Table 4). IL-1ra binds with comparable affinities for both IL-1α and IL-1β to the IL-1 receptor, without activation. IL-1 is a potent cytokine involved in AMD, [53,54] and the ratio of IL-1/IL-1ra is a potential marker for the progression of inflammation in the eye [54,55]. Other up-regulated anti-inflammatory cytokines include IL-9 and IL-13. IL-9 confers protection from apoptosis and cell proliferation [56], and IL-13 is known to inhibit inflammatory cytokine synthesis and modulate inflammation in conditions such as asthma [57].
The pattern of down-regulation of inflammatory cytokines and up-regulation anti-inflammatory cytokines are counter-intuitive but can be explained as a complex pattern of immune regulation or “para-inflammation.” This term was first proposed by Medzhitov to describe an inflammatory response of intermediate magnitude between healthy homeostasis and chronic inflammation [58]. If the cause of the tissue stress is not removed, then para-inflammation may progress to develop into a chronic condition with classic inflammatory pathways that are well defined [58]. The purpose of para-inflammation is to help the cells and tissues adapt to harmful environment and maintain adequate functionality. Xu et al. suggested that para-inflammation exists in the aging retina under physiologic conditions and might contribute to age-related retinal pathologies such as AMD [59].
In our experiments, we studied the response of healthy RPE cells after 24 h of AGE stimulation. Such short term AGE exposure may cause a state of para-inflammation where AGE stimulation triggers an adaptive response from RPE cells. Our data may reflect an “adequate” immune response from healthy RPE cells to AGE stimulation. If RPE cells were exposed to AGE chronically, there may be a tipping point where the stresses overwhelm RPE cell’s adaptive mechanisms leading to dysfunction and death. Evidence of a chronic inflammatory response in which several of the proinflammatory mediators studied here was recently shown in an immunohistochemical study of the postmortem eye with drusen [60].
AMD is widely regarded as an age-related, multifactorial disease influenced by genetic and environmental factors [61–63]. As shown in this study, AGE alone, can elicit a range of complex responses from the RPE cells, one of the key cellular players in the outer retina and in AMD. Combining this knowledge with the RPE response to amyloid beta [11,64] now allows for a more comprehensive understanding of the multiple cellular pathways triggered by deposits in the outer retina and further highlights the RPE as an important effector of the immune and inflammatory response in retinal tissues [65,66]. Recent studies have confirmed the up-regulation of several of these gene products in postmortem human eye tissues with drusen [32]. Given the diverse role of cytokines in retinal disease, future in vivo studies in which modulating key cytokines associated with the NF-κB and JAK-STAT pathways may provide novel strategies to limit RPE dysfunction and photoreceptor loss in disease processes that affect the outer retina, such as AMD.
Supplementary Material
Acknowledgments
We thank George Chang for assistance with RPE studies, Li Yu for assistance in PCR analysis and Lina Chen for assistance in western blot studies. Eleanor To, Jiangyuan Gao, Idris Samad and Kailun Jiang for discussions and editing of the manuscript. The study was funded by the Canadian Institutes of Health Research (CIHR MOP-97806).
Grant support
Supported by CIHR (IAO 77736 and MOP-97806 to JAM).
Appendix A. Supplementary material
Supplementary data associated with this article can be found, in the online version, at http://dx.doi.org/10.1016/j.cyto.2013.03.027.
References
- 1.Bressler NM, Bressler SB, Congdon NG, Ferris FL, 3rd, Friedman DS, Klein R, et al. Potential public health impact of age-related eye disease study results: AREDS report no. 11. Arch Ophthalmol. 2003;121:1621–4. doi: 10.1001/archopht.121.11.1621. [DOI] [PMC free article] [PubMed] [Google Scholar]
- 2.Anderson DH, Mullins RF, Hageman GS, Johnson LV. A role for local inflammation in the formation of drusen in the aging eye. Am J Ophthalmol. 2002;134:411–31. doi: 10.1016/s0002-9394(02)01624-0. [DOI] [PubMed] [Google Scholar]
- 3.Bok D. Evidence for an inflammatory process in age-related macular degeneration gains new support. Proc Natl Acad Sci USA. 2005;102:7053–4. doi: 10.1073/pnas.0502819102. [DOI] [PMC free article] [PubMed] [Google Scholar]
- 4.Johnson LV, Leitner WP, Rivest AJ, Staples MK, Radeke MJ, Anderson DH. The Alzheimer’s A beta-peptide is deposited at sites of complement activation in pathologic deposits associated with aging and age-related macular degeneration. Proc Natl Acad Sci USA. 2002;99:11830–5. doi: 10.1073/pnas.192203399. [DOI] [PMC free article] [PubMed] [Google Scholar]
- 5.Mullins RF, Russell SR, Anderson DH, Hageman GS. Drusen associated with aging and age-related macular degeneration contain proteins common to extracellular deposits associated with atherosclerosis, elastosis, amyloidosis, and dense deposit disease. FASEB J. 2000;14:835–46. [PubMed] [Google Scholar]
- 6.Glenn JV, Stitt AW. The role of advanced glycation end products in retinal ageing and disease. Biochim Biophys Acta. 2009;1790:1109–16. doi: 10.1016/j.bbagen.2009.04.016. [DOI] [PubMed] [Google Scholar]
- 7.McFarlane S, Glenn JV, Lichanska AM, Simpson DA, Stitt AW. Characterisation of the advanced glycation endproduct receptor complex in the retinal pigment epithelium. Br J Ophthalmol. 2005;89:107–12. doi: 10.1136/bjo.2004.045914. [DOI] [PMC free article] [PubMed] [Google Scholar]
- 8.Tian J, Ishibashi K, Reiser K, Grebe R, Biswal S, Gehlbach P, et al. Advanced glycation endproduct-induced aging of the retinal pigment epithelium and choroid: a comprehensive transcriptional response. Proc Natl Acad Sci USA. 2005;102:11846–51. doi: 10.1073/pnas.0504759102. [DOI] [PMC free article] [PubMed] [Google Scholar]
- 9.Glenn JV, Mahaffy H, Wu K, Smith G, Nagai R, Simpson DA, et al. Advanced glycation end product (AGE) accumulation on Bruch’s membrane: links to age-related RPE dysfunction. Invest Ophthalmol Vis Sci. 2009;50:441–51. doi: 10.1167/iovs.08-1724. [DOI] [PubMed] [Google Scholar]
- 10.Honda S, Farboud B, Hjelmeland LM, Handa JT. Induction of an aging mRNA retinal pigment epithelial cell phenotype by matrix-containing advanced glycation end products in vitro. Invest Ophthalmol Vis Sci. 2001;42:2419–25. [PubMed] [Google Scholar]
- 11.Kurji KH, Cui JZ, Lin T, Harriman D, Prasad SS, Kojic L, et al. Microarray analysis identifies changes in inflammatory gene expression in response to amyloid-beta stimulation of cultured human retinal pigment epithelial cells. Invest Ophthalmol Vis Sci. 2010;51:1151–63. doi: 10.1167/iovs.09-3622. [DOI] [PMC free article] [PubMed] [Google Scholar]
- 12.Hageman GS, Luthert PJ, Victor Chong NH, Johnson LV, Anderson DH, Mullins RF. An integrated hypothesis that considers drusen as biomarkers of immune-mediated processes at the RPE-Bruch’s membrane interface in aging and age-related macular degeneration. Prog Retin Eye Res. 2001;20:705–32. doi: 10.1016/s1350-9462(01)00010-6. [DOI] [PubMed] [Google Scholar]
- 13.de Arriba SG, Loske C, Meiners I, Fleischer G, Lobisch M, Wessel K, et al. Advanced glycation endproducts induce changes in glucose consumption, lactate production, and ATP levels in SH-SY5Y neuroblastoma cells by a redox-sensitive mechanism. J Cereb Blood Flow Metab. 2003;23:1307–13. doi: 10.1097/01.WCB.0000090622.86921.0E. [DOI] [PubMed] [Google Scholar]
- 14.Farboud B, Aotaki-Keen A, Miyata T, Hjelmeland LM, Handa JT. Development of a polyclonal antibody with broad epitope specificity for advanced glycation endproducts and localization of these epitopes in Bruch’s membrane of the aging eye. Mol Vis. 1999;5:11. [PubMed] [Google Scholar]
- 15.Min C, Kang E, Yu SH, Shinn SH, Kim YS. Advanced glycation end products induce apoptosis and procoagulant activity in cultured human umbilical vein endothelial cells. Diabetes Res Clin Pract. 1999;46:197–202. doi: 10.1016/s0168-8227(99)00094-7. [DOI] [PubMed] [Google Scholar]
- 16.Sakata N, Meng J, Takebayashi S. Effects of advanced glycation end products on the proliferation and fibronectin production of smooth muscle cells. J Atheroscler Thromb. 2000;7:169–76. doi: 10.5551/jat1994.7.169. [DOI] [PubMed] [Google Scholar]
- 17.Verbeke P, Perichon M, Friguet B, Bakala H. Inhibition of nitric oxide synthase activity by early and advanced glycation end products in cultured rabbit proximal tubular epithelial cells. Biochim Biophys Acta. 2000;1502:481–94. doi: 10.1016/s0925-4439(00)00071-5. [DOI] [PubMed] [Google Scholar]
- 20.Yamagishi S, Adachi H, Takeuchi M, Enomoto M, Furuki K, Matsui T, et al. Serum level of advanced glycation end-products (AGEs) is an independent determinant of plasminogen activator inhibitor-1 (PAI-1) in nondiabetic general population. Horm Metab Res. 2007;39:845–8. doi: 10.1055/s-2007-991176. [DOI] [PubMed] [Google Scholar]
- 21.Laemmli UK. Cleavage of structural proteins during the assembly of the head of bacteriophage T4. Nature. 1970;227:680–5. doi: 10.1038/227680a0. [DOI] [PubMed] [Google Scholar]
- 22.Mootha VK, Lindgren CM, Eriksson KF, Subramanian A, Sihag S, Lehar J, et al. PGC-1alpha-responsive genes involved in oxidative phosphorylation are coordinately downregulated in human diabetes. Nat Genet. 2003;34:267–73. doi: 10.1038/ng1180. [DOI] [PubMed] [Google Scholar]
- 23.Subramanian A, Tamayo P, Mootha VK, Mukherjee S, Ebert BL, Gillette MA, et al. Gene set enrichment analysis: a knowledge-based approach for interpreting genome-wide expression profiles. Proc Natl Acad Sci USA. 2005;102:15545–50. doi: 10.1073/pnas.0506580102. [DOI] [PMC free article] [PubMed] [Google Scholar]
- 24.Du Yan S, Zhu H, Fu J, Yan SF, Roher A, Tourtellotte WW, et al. Amyloid-beta peptide-receptor for advanced glycation endproduct interaction elicits neuronal expression of macrophage-colony stimulating factor: a proinflammatory pathway in Alzheimer disease. Proc Natl Acad Sci USA. 1997;94:5296–301. doi: 10.1073/pnas.94.10.5296. [DOI] [PMC free article] [PubMed] [Google Scholar]
- 25.Lue LF, Yan SD, Stern DM, Walker DG. Preventing activation of receptor for advanced glycation endproducts in Alzheimer’s disease. Curr Drug Targets CNS Neurol Disord. 2005;4:249–66. doi: 10.2174/1568007054038210. [DOI] [PubMed] [Google Scholar]
- 26.Baynes JW, Thorpe SR. Glycoxidation and lipoxidation in atherogenesis. Free Radic Biol Med. 2000;28:1708–16. doi: 10.1016/s0891-5849(00)00228-8. [DOI] [PubMed] [Google Scholar]
- 27.Harja E, Bu DX, Hudson BI, Chang JS, Shen X, Hallam K, et al. Vascular and inflammatory stresses mediate atherosclerosis via RAGE and its ligands in apoE−/−mice. J Clin Invest. 2008;118:183–94. doi: 10.1172/JCI32703. [DOI] [PMC free article] [PubMed] [Google Scholar]
- 28.Gul A, Rahman MA, Hasnain SN. Role of fructose concentration on cataractogenesis in senile diabetic and non-diabetic patients. Graefes Arch Clin Exp Ophthalmol. 2009;247:809–14. doi: 10.1007/s00417-008-1027-9. [DOI] [PubMed] [Google Scholar]
- 29.Zieman SJ, Kass DA. Advanced glycation endproduct crosslinking in the cardiovascular system: potential therapeutic target for cardiovascular disease. Drugs. 2004;64:459–70. doi: 10.2165/00003495-200464050-00001. [DOI] [PubMed] [Google Scholar]
- 30.Muller M, Carter S, Hofer MJ, Campbell IL. Review: The chemokine receptor CXCR3 and its ligands CXCL9, CXCL10 and CXCL11 in neuroimmunity – a tale of conflict and conundrum. Neuropathol Appl Neurobiol. 2010;36:368–87. doi: 10.1111/j.1365-2990.2010.01089.x. [DOI] [PubMed] [Google Scholar]
- 31.Cao X, Shen D, Patel MM, Tuo J, Johnson TM, Olsen TW, et al. Macrophage polarization in the maculae of age-related macular degeneration: a pilot study. Pathol Int. 2011;61:528–35. doi: 10.1111/j.1440-1827.2011.02695.x. [DOI] [PMC free article] [PubMed] [Google Scholar]
- 32.Jiang K, To E, Cui JZ, Cao S, Gao J, Matsubara JA. Drusen and pro-inflammatory mediators in the post-mortem human eye. J Clin Exp Ophthalmol. 2012;3:208. doi: 10.4172/2155-9570.1000208. [DOI] [PMC free article] [PubMed] [Google Scholar]
- 33.Olofsson PS, Jatta K, Wagsater D, Gredmark S, Hedin U, Paulsson-Berne G, et al. The antiviral cytomegalovirus inducible gene 5/viperin is expressed in atherosclerosis and regulated by proinflammatory agents. Arterioscler Thromb Vasc Biol. 2005;25:e113–6. doi: 10.1161/01.ATV.0000170130.85334.38. [DOI] [PubMed] [Google Scholar]
- 34.Kim YH, He S, Kase S, Kitamura M, Ryan SJ, Hinton DR. Regulated secretion of complement factor H by RPE and its role in RPE migration. Graefe’s Arch Clin Exp Ophthalmol [Albrecht von Graefes Arch Klin Exp Ophthalmol] 2009;247:651–9. doi: 10.1007/s00417-009-1049-y. [DOI] [PMC free article] [PubMed] [Google Scholar]
- 35.Nagineni CN, Detrick B, Hooks JJ. Synergistic effects of gamma interferon on inflammatory mediators that induce interleukin-6 gene expression and secretion by human retinal pigment epithelial cells. Clin Diagn Lab Immunol. 1994;1:569–77. doi: 10.1128/cdli.1.5.569-577.1994. [DOI] [PMC free article] [PubMed] [Google Scholar]
- 36.Wu Z, Lauer TW, Sick A, Hackett SF, Campochiaro PA. Oxidative stress modulates complement factor H expression in retinal pigmented epithelial cells by acetylation of FOXO3. JBC. 2007;282:22414–25. doi: 10.1074/jbc.M702321200. [DOI] [PubMed] [Google Scholar]
- 37.Arnold J, Grune T. PARP-mediated proteasome activation: a co-ordination of DNA repair and protein degradation? Bioessays. 2002;24:1060–5. doi: 10.1002/bies.10179. [DOI] [PubMed] [Google Scholar]
- 38.Ethen CM, Hussong SA, Reilly C, Feng X, Olsen TW, Ferrington DA. Transformation of the proteasome with age-related macular degeneration. FEBS Lett. 2007;581:885–90. doi: 10.1016/j.febslet.2007.01.061. [DOI] [PMC free article] [PubMed] [Google Scholar]
- 39.Hussong SA, Kapphahn RJ, Phillips SL, Maldonado M, Ferrington DA. Immunoproteasome deficiency alters retinal proteasome’s response to stress. J Neurochem. 2010;113:1481–90. doi: 10.1111/j.1471-4159.2010.06688.x. [DOI] [PMC free article] [PubMed] [Google Scholar]
- 40.Mo FM, Proia AD, Johnson WH, Cyr D, Lashkari K. Interferon gamma-inducible protein-10 (IP-10) and eotaxin as biomarkers in age-related macular degeneration. Invest Ophthalmol Vis Sci. 2010;51:4226–36. doi: 10.1167/iovs.09-3910. [DOI] [PubMed] [Google Scholar]
- 41.Detrick B, Hooks JJ. Immune regulation in the retina. Immunol Res. 2010;47:153–61. doi: 10.1007/s12026-009-8146-1. [DOI] [PMC free article] [PubMed] [Google Scholar]
- 42.Ruef C, Coleman DL. Granulocyte-macrophage colony-stimulating factor: pleiotropic cytokine with potential clinical usefulness. Rev Infect Dis. 1990;12:41–62. doi: 10.1093/clinids/12.1.41. [DOI] [PubMed] [Google Scholar]
- 43.Vlassara H, Striker GE. AGE restriction in diabetes mellitus: a paradigm shift. Nat Rev Endocrinol. 2011 doi: 10.1038/nrendo.2011.74. [DOI] [PMC free article] [PubMed] [Google Scholar]
- 44.Howes KA, Liu Y, Dunaief JL, Milam A, Frederick JM, Marks A, et al. Receptor for advanced glycation end products and age-related macular degeneration. Invest Ophthalmol Vis Sci. 2004;45:3713–20. doi: 10.1167/iovs.04-0404. [DOI] [PubMed] [Google Scholar]
- 45.Lu C, He JC, Cai W, Liu H, Zhu L, Vlassara H. Advanced glycation endproduct (AGE) receptor 1 is a negative regulator of the inflammatory response to AGE in mesangial cells. PNAS. 2004;101:11767–72. doi: 10.1073/pnas.0401588101. [DOI] [PMC free article] [PubMed] [Google Scholar]
- 46.Sourris KC, Forbes JM. Interactions between advanced glycation end-products (AGE) and their receptors in the development and progression of diabetic nephropathy – are these receptors valid therapeutic targets. Curr Drug Targets. 2009;10:42–50. doi: 10.2174/138945009787122905. [DOI] [PubMed] [Google Scholar]
- 47.Vlassara H, Uribarri J, Cai W, Striker G. Advanced glycation end product homeostasis: exogenous oxidants and innate defenses. Ann NY Acad Sci. 2008;1126:46–52. doi: 10.1196/annals.1433.055. [DOI] [PubMed] [Google Scholar]
- 48.Yamada Y, Ishibashi K, Bhutto IA, Tian J, Lutty GA, Handa JT. The expression of advanced glycation endproduct receptors in rpe cells associated with basal deposits in human maculas. Exp Eye Res. 2006;82:840–8. doi: 10.1016/j.exer.2005.10.005. [DOI] [PMC free article] [PubMed] [Google Scholar]
- 49.Ahn KS, Aggarwal BB. Transcription factor NF-kappaB: a sensor for smoke and stress signals. Ann NY Acad Sci. 2005;1056:218–33. doi: 10.1196/annals.1352.026. [DOI] [PubMed] [Google Scholar]
- 50.Crane IJ, Wallace CA, Forrester JV. Regulation of granulocyte-macrophage colony-stimulating factor in human retinal pigment epithelial cells by IL-1beta and IFN-gamma. Cell Immunol. 2001;209:132–9. doi: 10.1006/cimm.2001.1789. [DOI] [PubMed] [Google Scholar]
- 51.Yang CH, Wei L, Pfeffer SR, Du Z, Murti A, Valentine WJ, et al. Identification of CXCL11 as a STAT3-dependent gene induced by IFN. J Immunol. 2007;178:986–92. doi: 10.4049/jimmunol.178.2.986. [DOI] [PubMed] [Google Scholar]
- 52.Ferrara N. Vascular endothelial growth factor and age-related macular degeneration: from basic science to therapy. Nat Med. 2010;16:1107–11. doi: 10.1038/nm1010-1107. [DOI] [PubMed] [Google Scholar]
- 53.Arend WP, Malyak M, Guthridge CJ, Gabay C. Interleukin-1 receptor antagonist: role in biology. Annu Rev Immunol. 1998;16:27–55. doi: 10.1146/annurev.immunol.16.1.27. [DOI] [PubMed] [Google Scholar]
- 54.Fichorova RN, Lai JJ, Schwartz JL, Weiner DH, Mauck CK, Callahan MM. Baseline variation and associations between subject characteristics and five cytokine biomarkers of vaginal safety among healthy non-pregnant women in microbicide trials. Cytokine. 2011;55:134–40. doi: 10.1016/j.cyto.2011.03.016. [DOI] [PubMed] [Google Scholar]
- 55.Gabay C, Lamacchia C, Palmer G. IL-1 pathways in inflammation and human diseases. Nat Rev Rheumatol. 2010;6:232–41. doi: 10.1038/nrrheum.2010.4. [DOI] [PubMed] [Google Scholar]
- 56.Demoulin JB, Renauld JC. Interleukin 9 and its receptor: an overview of structure and function. Int Rev Immunol. 1998;16:345–64. doi: 10.3109/08830189809043001. [DOI] [PubMed] [Google Scholar]
- 57.Wynn TA. IL-13 effector functions. Annu Rev Immunol. 2003;21:425–56. doi: 10.1146/annurev.immunol.21.120601.141142. [DOI] [PubMed] [Google Scholar]
- 58.Medzhitov R. Origin and physiological roles of inflammation. Nature. 2008;454:428–35. doi: 10.1038/nature07201. [DOI] [PubMed] [Google Scholar]
- 59.Xu H, Chen M, Forrester JV. Para-inflammation in the aging retina. Prog Retin Eye Res. 2009;28:348–68. doi: 10.1016/j.preteyeres.2009.06.001. [DOI] [PubMed] [Google Scholar]
- 60.Jiang K, Cao S, Cui JZ, Matsubara JA. Immuno-modulatory effect of IFN-gamma in AMD and its role as a possible target for therapy. J Clin Exp Ophthalmol. 2012:S2. doi: 10.4172/2155-9570-S2-007. Review. in press. [DOI] [PMC free article] [PubMed] [Google Scholar]
- 61.Chen H, Liu B, Lukas TJ, Neufeld AH. The aged retinal pigment epithelium/choroid: a potential substratum for the pathogenesis of age-related macular degeneration. PLoS One. 2008;3:e2339. doi: 10.1371/journal.pone.0002339. [DOI] [PMC free article] [PubMed] [Google Scholar]
- 62.Chen M, Forrester JV, Xu H. Synthesis of complement factor H by retinal pigment epithelial cells is down-regulated by oxidized photoreceptor outer segments. Exp Eye Res. 2007;84:635–45. doi: 10.1016/j.exer.2006.11.015. [DOI] [PubMed] [Google Scholar]
- 63.Spencer KL, Olson LM, Schnetz-Boutaud N, Gallins P, Agarwal A, Iannaccone A, et al. Using genetic variation and environmental risk factor data to identify individuals at high risk for age-related macular degeneration. PLoS One. 2011;6:e17784. doi: 10.1371/journal.pone.0017784. [DOI] [PMC free article] [PubMed] [Google Scholar]
- 64.Cui J, Kurji K, Lin TK, Prasad S, Kojic L, Matsubara JA. Microarray-based gene set analysis: pathway analysis of advanced glycation endproduct (AGEs) or amyloid beta (A{beta}) stimulation of human RPE in vitro. Invest Ophthalmol Vis Sci. 2009;50:707–D61. [Google Scholar]
- 65.Holtkamp GM, Kijlstra A, Peek R, de Vos AF. Retinal pigment epithelium-immune system interactions: cytokine production and cytokine-induced changes. Prog Retin Eye Res. 2001;20:29–48. doi: 10.1016/s1350-9462(00)00017-3. [DOI] [PubMed] [Google Scholar]
- 66.Ma W, Zhao L, Fontainhas AM, Fariss RN, Wong WT. Microglia in the mouse retina alter the structure and function of retinal pigmented epithelial cells: a potential cellular interaction relevant to AMD. PLoS One. 2009;4:e7945. doi: 10.1371/journal.pone.0007945. [DOI] [PMC free article] [PubMed] [Google Scholar]
- 67.Oeckinghaus A, Hayden MS, Ghosh S. Crosstalk in NF-kappaB signaling pathways. Nat Immunol. 2011;12:695–708. doi: 10.1038/ni.2065. [DOI] [PubMed] [Google Scholar]
- 68.Kato H, Takeuchi O, Sato S, Yoneyama M, Yamamoto M, Matsui K, et al. Differential roles of MDA5 and RIG-I helicases in the recognition of RNA viruses. Nature. 2006;441:101–5. doi: 10.1038/nature04734. [DOI] [PubMed] [Google Scholar]
Associated Data
This section collects any data citations, data availability statements, or supplementary materials included in this article.