

Abstract
Objective
In adulthood, excess BMI is associated with cardiovascular disease (CVD); it is unknown whether risk differs by BMI trajectories from adolescence to adulthood.
Design and Methods
The National Longitudinal Study of Adolescent Health, a nationally representative, longitudinal adolescent cohort (mean age: 16.9y) followed into adulthood (mean age: 29.0y) [n=13,643 individuals (40,929 observations)] was examined. Separate logistic regression models for diabetes, hypertension, and inflammation were used to examine odds of risk factors at given adult BMI according to varying BMI trajectories from adolescence to adulthood.
Results
CVD risk factor prevalence at follow-up ranged from 5.5% (diabetes) to 26.4% (hypertension) and 31.3% (inflammation); risk differed across BMI trajectories. For example, relative to men aged 27y (BMI=23 kg/m2 maintained over full study period), odds for diabetes were comparatively higher for men of the same age and BMI≈30 kg/m2 with ≈8 BMI unit gain between 15-20y (OR=2.35; 95% CI, 1.51, 3.66) or in those who maintained BMI≈30 kg/m2 across the study period (OR=2.33; 1.92, 2.83) relative to the same ≈8 BMI unit gain, but between 20-27y (OR=1.44; 1.10, 1.87).
Conclusions
Specific periods and patterns of weight gain in the transition from adolescence to adulthood might be critical for CVD preventive efforts.
Keywords: Diabetes, Hypertension, Inflammation, Race/ethnicity, Obesity
Introduction
The transition from adolescence to young adulthood is a risk period for excess weight gain.1,2 Associations between adult BMI and diabetes, hypertension, and inflammation risk are well established;3-5 however, BMI trajectories from adolescence into adulthood may differentially associate with cardiovascular disease (CVD) risk. Studies relating past and current BMI to CVD risk have generally been conducted in small samples,6 in one sex or ethnic group,6-12 or used recalled/self-reported BMI13-15 rather than measured anthropometry or examined discrete obesity rather than BMI trajectories. Thus, there is a need to investigate relationships between BMI trajectories and later CVD risk using measured anthropometry in large, population-based samples with adequate variation in magnitude and timing of BMI changes.
It is also unknown whether weight gain during specific periods in the adolescence to young adulthood transition or current weight is most relevant for adult CVD risk. While overweight duration and CVD risk has been addressed in older adult populations,10,11 we know little about the specific periods within the high risk transition from adolescence to adulthood, when precursors of CVD rapidly develop.16-20 We have shown that diabetes risk is particularly high in individuals who were obese as adolescents relative to those with adult-onset obesity,1 but we do not know about the effects of differential BMI gain trajectories on diabetes, inflammation, and hypertension, which can inform targeted disease prevention and lifestyle intervention efforts.
To address whether BMI trajectories across 12 years from adolescence into adulthood are associated with differential CVD risk, we capitalize on a nationally representative, prospective cohort of adolescents followed into adulthood across three surveys. We hypothesize that at the same age and BMI, adults have differential diabetes, hypertension, and inflammation risk depending upon their BMI trajectory from adolescence to adulthood, and, specifically, that weight gain in late teen years is more strongly associated with comparatively higher risk than weight gain in the third decade of life.
Methods and Procedures
Data Source
The National Longitudinal Study of Adolescent Health (Add Health) is a longitudinal cohort representative of US middle and high school students in 1994-95 at baseline (wave I; n=20,745; mean age: 15.7y). Participants were surveyed a maximum of four times over a 12-year period, with measured anthropometry collected at waves II, III, and IV and blood pressure and biomarkers collected at wave IV. Data from this analysis comes from waves II (1996; n=14,738; mean age: 16.2y), III (2001-2002; n=15,197; mean age: 22.0y) and IV (2008-2009; n=15,701; mean age: 28.5y). Survey procedures have been described elsewhere21 and were approved by the institutional review board at the University of North Carolina at Chapel Hill.
Inclusion Criteria
The primary inclusion criteria for this study were that respondents: had a survey weight (n=14,800), had either: HbA1c, blood pressure, or CRP measured at wave IV (excluded n=150), and were not pregnant at time of measurement (excluded n=529), resulting in a total eligible sample of 14,121. Native Americans (n=110) were excluded due to small sample size as were 27 individuals with missing race/ethnicity information, resulting in a final analytic sample of 13,984 respondents.
Dependent Variable Measurement
Blood pressure (BP) was collected at wave IV using standardized procedures. Systolic and diastolic BP were measured on the right arm three times (average of second and third used for analysis) at 30-second intervals after five-minute seated rest using the appropriate cuff size and a Microlife BP3MC1-PC-IB oscillometric BP monitor (MicroLife USA, Inc; Dunedin, FL). Hypertension was defined as systolic/diastolic BP≥140/90 mmHg,3 self-reported doctor diagnosis of hypertension, or use of BP-lowering medication.
HbA1c was measured using colorimetric assays from whole-blood spot assays collected from finger pricks.22 Diabetes was defined as HbA1c≥6.5%,23 self-reported doctor diagnosis of diabetes, or indicating the use of diabetes medication.
CRP was measured using the sandwich ELISA method from whole-blood spot assays collected from finger pricks.24 Following previously established recommendations, individuals with CRP≥10 mg/L were excluded due to likely acute infection, which obscures CRP as a marker for elevated CVD risk. Inflammation was defined as CRP≥3 mg/L.5
Independent Variable Measurement
Main Exposure
Height and weight were measured during in-home surveys in waves II, III, and IV using standardized procedures. BMI was calculated as weight(kg)/height(m)2 and annualized change between each measurement wave (BMITime 2-BMITime 1/year).
Control Variables
Age, sex, current smoking status, and race/ethnicity were collected using traditional survey methods. Individuals reported medication use in the last four weeks, including diabetes, hypertension, or anti-inflammatory medication. Additional controls were: parental history of diabetes (diabetes model) and presence of subclinical infection markers or reported current infection/inflammatory disease (inflammation model).
Statistical Methods
CVD risk factor models
All analyses were conducted in Stata 12 (Stata Corp, College Station, TX, USA). In separate logistic regression models, we estimated odds of having diabetes, hypertension, or inflammation at wave IV. Main exposure variables were a series of BMI values [wave II BMI (adolescence) and annualized BMI change between waves II-III and III-IV], which allowed us to assess associations of CVD risk factors with: (1) wave II BMI and (2) BMI changes between waves II, III, and IV while controlling for wave II BMI. We used post-hoc tests of group differences to test differences across the BMI trajectories. We allowed associations to vary by sex by including interaction terms between sex and main BMI exposure variables. Other covariates included sex, race (white, black, Hispanic, Asian), smoking status (yes/no current smoker waves II, III, and IV), wave II age, region of residence (West, Northeast, South, Midwest), parental history of diabetes (yes/no) [diabetes model] and anti-inflammatory medication use (yes/no), presence of subclinical infection markers (0, 1, 2, or ≥3 markers), current infections/inflammatory disease (0, 1, 2, or ≥3 infections/inflammatory diseases at survey) [inflammation model]. We used Wald tests with significance value set at p=0.1 to test inclusion of specific interaction terms in the models. We used longitudinal survey weights, and clustered at the school level (primary sampling unit) using a sandwich variance estimator to account for survey design methods and nonresponse bias.25
To take advantage of all available information, the three models had different sample sizes (diabetes: n=12,904; observations (obs)=38,712; hypertension: n=13,643; obs=40,929; inflammation: n=11,027; obs=33,081) due to missingness in outcome measures and model-specific exclusions.
Missing Data
We are missing height and weight measurements in 6,008 individuals across all waves. Our largest source of missingness (59%; n=3,556/6,008) was due study design (wave II followed only school-aged students, including high school drop-outs, although all wave I participants were eligible for wave III and IV) rather than loss to follow-up (39%; n=2,365/6,008 missing at wave III; none missing at wave IV as per inclusion criteria) or anthropometry refusal [2%; n=89/6,008 at one or more visits [obs=304 wave II; obs=820 wave III; obs=164 wave IV)]. We used multiple imputation chained equations (MICE) in Stata 1226,27 to estimate missing BMI values (obs=3,860 wave II; obs=3,185 wave III; obs=164 wave IV; of these, 145 wave II and 247 wave III observations were dropped due to pregnancy at time of survey) or smoking (obs=3,558 wave II; obs=2,370 wave III; obs=41 wave IV). Five imputation data sets were created, and all subsequent analyses used Rubin's rules for the combination of multiply imputed data sets.28
The imputation model included age at each wave, race, parental history of diabetes, variables correcting for survey design including: longitudinal survey weights, region, and indicator variables for oversampled groups: disabled, blacks from well-educated families, Chinese, Cubans, and Puerto Ricans. Diabetes, hypertension, and inflammation were included in the imputation model for BMI and smoking to preserve outcome-predictor associations appropriately.29 Longitudinal sample weights and clustering at the school level (primary sampling unit) accounted for survey design methods and nonresponse bias. Imputation was carried out separately by sex, due to differing relationships between race, age, and BMI by sex.
Evaluation of the multiple imputation for missing data
Imputation models assume data are missing at random conditional on included covariates. We examined differences between the sample with any missing data (n=6,008) versus complete information (n=7,976) to assess our imputation model assumptions using chi-squared tests (categorical variables) and t-tests (continuous variables) at a Bonferroni-corrected significance level of 0.006 (type 1 error rate=0.05, nine comparisons). Sensitivity analyses were used to examine differences in the imputed and non-imputed data (presented in results).
Presentation of Results
We examined differential associations in diabetes, hypertension, and inflammation at wave IV (mean age: 29.0y) as a function of wave II BMI (mean age: 16.9y) and BMI change between: (1) waves II-III, mean ages: 16.9-22.5y, and (2) waves III-IV, mean ages: 22.5-29.0y. Model coefficients are presented in tabular form. We derived BMI trajectories based on a priori research interests in baseline weight (wave II), timing of weight gain between waves, and adult weight (wave IV) at wave IV in relation to cardiometabolic risk in adulthood. From our multivariate model, we calculated odds ratios (ORs) and 95% confidence intervals (CIs) for diabetes, hypertension, or inflammation for these a priori BMI trajectories relative to a “healthy” referent (stable BMI=23 kg/m2 at all waves) and then used post-hoc tests to examine trajectory group differences across the BMI trajectories.
Results
Our ethnically diverse sample had a baseline mean age of 16.9y (Table 1). Average BMI increased over time. At wave IV, hypertension and inflammation were prevalent in under a third of the cohort and approximately 6% had diabetes.
Table 1. Characteristics of the analytic sample, from the National Longitudinal Study of Adolescent Health waves II through IV (n=13,984).
| Characteristic | Mean or % (SE) |
|---|---|
| Women | 47.6% (0.6) |
| Race | |
| White | 68.5% (2.9) |
| Black, % (SE) | 16.2% (2.2) |
| Asian, % (SE) | 3.5% (0.8) |
| Hispanic, % (SE) | 11.8% (1.7) |
| Age (years) | |
| Wave II | 16.9 (0.0) |
| Wave III | 22.5 (0.0) |
| Wave IV | 29.0 (0.0) |
| BMI (kg/m2)a | |
| Wave II | 23.3 (0.0) |
| Wave III | 26.6 (0.1) |
| Wave IV | 29.0 (0.1) |
| Smoking statusb | |
| Wave II | 20.4% (0.4) |
| Wave III | 32.2% (0.4) |
| Wave IV | 32.4% (0.4) |
| Wave IV biomarkers | |
| HbA1c (%) | 5.6 (0.0) |
| Systolic blood pressure (mmHg) | 125.3 (0.2) |
| Diastolic blood pressure (mmHg) | 79.6 (0.2) |
| C-reactive protein (mg/L) | 2.5 (0.0) |
| Wave IV CVD risk factors | |
| Diabetes (n=12,904) c | 5.5% (0.4) |
| Hypertension (n=13,643) d | 26.4% (0.6) |
| Inflammation (n=11,027)e | 31.3% (0.7) |
Measured height and weight were used to calculate BMI (wave II: 10,124 observations; wave III 10,799 observations; wave IV: 13,820 observations) or imputed if missing (n=6,008; wave II: 3,860 observations; wave III: 3,185 observations; wave IV: 164 observations).
Self-reported smoking status (wave II: 10,426 observations; wave III 11,614 observations; wave IV: 13,943 observations) or imputed if missing (n=6,008; wave II: 3,558 observations; wave III: 2,370 observations; wave IV: 41 observations)
Diabetes defined as HbA1c ≥ 6.5%, doctor diagnosis, or self-report of diabetes medication.
Hypertension defined as systolic/diastolic blood pressure ≥ 140/90 mmHg, doctor diagnosis, or self-report of antihypertensive medication.
Inflammation defined as high-sensitive C-reactive protein 3-10 mg/L CVD – cardiovascular disease.
Mean BMI and BMI change are presented across diabetes, hypertension and inflammation status in Table 2, with significantly higher mean values in individuals with (versus without) diabetes, hypertension, or inflammation.
Table 2. Mean (standard error) BMI at waves II, III, and IV, and annualized BMI change between waves II-III and waves III-IV for those with diabetes, hypertension, or inflammation by sex, from the National Longitudinal Study of Adolescent Health.
| Diabetesa,b | Hypertensiona,b | Inflammationa,b | ||||
|---|---|---|---|---|---|---|
| No | Yes | No | Yes | No | Yes | |
| Men | ||||||
| BMI (kg/m2)c | ||||||
| Wave II (mean age: 16.9 y) | 23.2 (0.1) | 26.6 (0.4) | 22.6 (0.1) | 24.7 (0.1) | 22.6 (0.1) | 25.1 (0.1) |
| Wave III (mean age: 22.5 y) | 26.3 (0.1) | 30.7 (0.4) | 25.5 (0.1) | 28.2 (0.1) | 25.5 (0.1) | 28.7 (0.1) |
| Wave IV (mean age: 29.0 y) | 28.9 (0.1) | 34.1 (0.5) | 27.7 (0.1) | 31.3 (0.2) | 27.6 (0.1) | 32.4 (0.2) |
| Annualized BMI change (kg/m2/year)b | ||||||
| Waves II-III | 0.6 (0.0) | 0.8 (0.1) | 0.5 (0.0) | 0.7 (0.0) | 0.5 (0.0) | 0.7 (0.0) |
| Waves III-IV | 0.4 (0.0) | 0.5 (0.0) | 0.3 (0.0) | 0.5 (0.0) | 0.3 (0.0) | 0.6 (0.0) |
|
| ||||||
| Women | ||||||
| BMI (kg/m2)c | ||||||
| Wave II (mean age: 16.9 y) | 23.1 (0.1) | 27.2 (0.3) | 22.7 (0.1) | 25.7 (0.2) | 22.0 (0.1) | 24.1 (0.1) |
| Wave III (mean age: 22.5 y) | 26.4 (0.1) | 32.2 (0.4) | 25.8 (0.1) | 30.2 (0.2) | 24.5 (0.1) | 28.1 (0.2) |
| Wave IV (mean age: 29.0 y) | 28.4 (0.1) | 35.6 (0.5) | 28.0 (0.1) | 33.5 (0.3) | 25.8 (0.1) | 31.5 (0.2) |
| Annualized BMI change (kg/m2/year)b | ||||||
| Waves II-III | 0.6 (0.0) | 0.9 (0.0) | 0.6 (0.0) | 0.8 (0.0) | 0.5 (0.0) | 0.7 (0.0) |
| Waves III-IV | 0.4 (0.0) | 0.5 (0.0) | 0.3 (0.0) | 0.5 (0.0) | 0.2 (0.0) | 0.5 (0.0) |
Diabetes defined as HbA1c ≥ 6.5%, doctor diagnosis, or self-report of diabetes medication. Hypertension defined as systolic/diastolic blood pressure ≥ 140/90 mmHg, doctor diagnosis, or self-report of antihypertensive medication. Inflammation defined as high-sensitive C-reactive protein between 3 and 10 mg/L.
Statistically significant differences for BMI or BMI change in individuals with vs without diabetes, hypertension, or inflammation at the p < 0.05 level using two sample t-tests. All comparisons were statistically significant for each cardiovascular disease risk factor.
In general, in adjusted models (Table 3) wave II BMI and BMI change from waves II-III and from III-IV were significantly and positively associated with the three CVD risk factors. In model testing, we additionally included interaction terms to test whether wave II BMI modified associations between BMI change from waves II-III and III-IV with CVD risk factors, and whether these interactions were also modified by sex. Wald tests for inclusion of all interactions terms between wave II BMI and the BMI change variables were not significant at a priori-determined 0.1 level for diabetes (p=0.52), hypertension (p=0.11), or inflammation (p=0.66), thus these terms were not retained in the models.
Table 3.
Model coefficients and 95% confidence intervals from separate logistic regressions predicting diabetes, hypertension, or inflammation at wave IV, from the National Longitudinal Study of Adolescent Healtha,b
| Diabetes Beta (95% CI)c | Hypertension Beta (95% CI) | Inflammation Beta (95% CI)d | |
|---|---|---|---|
| Wave II BMI (kg/m2) | 0.10 (0.08, 0.13)*** | 0.09 (0.07, 0.11)*** | 0.12 (0.09, 0.14)*** |
| Annualized BMI change waves II-III (kg/m2/year) | 0.60 (0.29, 0.91)*** | 0.53 (0.38, 0.67)*** | 0.66 (0.43, 0.88)*** |
| Annualized BMI change waves III-IV (kg/m2/year) | 0.23 (0.00, 0.46)* | 0.42 (0.25, 0.60)*** | 0.87 (0.63, 1.10)*** |
| Female | 0.88 (−0.10, 1.87) | −0.47 (−1.17, 0.22) | 1.08 (0.40, 1.77)** |
| Female*wave II BMI | −0.03 (−0.07, 0.01) | −0.02 (−0.04, 0.01) | −0.03 (−0.06, 0.00) |
| Female*annualized BMI change waves II-III | −0.12 (−0.56, 0.32) | −0.02 (−0.21, 0.16) | 0.12 (−0.20, 0.44) |
| Female*annualized BMI change waves III-IV | −0.09 (−0.42, 0.24) | −0.02 (−0.24, 0.20) | 0.32 (0.01, 0.63)* |
| Region 1 (referent) | -- | -- | -- |
| Region 2 | −0.07 (−0.42, 0.27) | 0.15 (−0.05, 0.35) | 0.09 (−0.12, 0.30) |
| Region 3 | 0.03 (−0.23, 0.30) | 0.17 (0.00, 0.33) | 0.05 (−0.14, 0.24) |
| Region 4 | −0.20 (−0.56, 0.16) | 0.00 (−0.18, 0.17) | 0.11 (−0.12, 0.33) |
| Wave II age (years) | 0.08 (0.02, 0.15)* | 0.06 (0.02, 0.09)** | 0.01 (−0.03, 0.04) |
| Wave II smoker | −0.07 (−0.51, 0.37) | −0.01 (−0.25, 0.23) | −0.09 (−0.27, 0.10) |
| Wave III smoker | 0.04 (−0.36, 0.44) | 0.18 (0.00, 0.36)* | 0.10 (−0.10, 0.30) |
| Wave IV smoker | 0.08 (−0.24, 0.39) | 0.04 (−0.11, 0.19) | 0.14 (−0.06, 0.33) |
| White (referent) | -- | -- | -- |
| Black | 1.43 (1.15, 1.70)*** | 0.09 (−0.07, 0.24) | 0.06 (−0.13, 0.25) |
| Asian | 0.43 (−0.35, 1.21) | 0.24 (−0.02, 0.50) | −0.56 (−0.84, −0.28)*** |
| Hispanic | 0.69 (0.38, 1.00) | −0.07 (−0.26, 0.13) | 0.11 (−0.09, 0.31) |
| Constant | −7.99 (−9.33, −6.64)*** | −4.46 (−5.17, −3.74)*** | −4.98 (−5.82, −4.14)*** |
Models are survey-weighted and adjust for age at wave II, smoking status at waves II, III, and IV, race, region, and cluster at the school level (primary sampling unit).
Diabetes defined as HbA1c ≥6.5%, doctor diagnosis, or self-report of diabetes medication. Hypertension defined as systolic/diastolic blood pressure ≥140/90 mmHg, doctor diagnosis, or self-report of antihypertensive medication. Inflammation defined as high-sensitive C-reactive protein between 3 and 10 mg/L.
Model for diabetes additionally controlled for family history of diabetes.
Model for inflammation additionally controlled for use of anti-inflammatory medication (yes vs no), the presence of subclinical infection markers (0, 1, 2, or 3+ markers) or inflammatory diseases (0, 1, 2, or 3+ inflammatory diseases) at time of wave IV survey.
Abbreviations: CI: Confidence Interval.
Stars denote significance via Wald test at p<0.05,
p<0.01, or
p<0.001 level.
We derived 10 BMI trajectories (Figure 1) based on: (1) a priori research interests regarding baseline weight, timing of weight gain, and adult weight in association with future cardiometabolic risk; and (2) distributions of BMI and BMI change in our nationally representative sample, ensuring that the 10 selected BMI trajectories were well represented in the sample (and thus in the United States). We chose the following distributions of BMI and BMI change to construct our trajectories: wave II BMI (23, 30, and 36 kg/m2 representing the 25th, 75th, and 95th percentiles, respectively), BMI change between waves (≈1, 4, or 8 BMI unit increase between waves II-III or III-IV representing the 20th, 60th, or 90th percentiles of BMI change, respectively), and wave IV BMI (23, 30, and 36 kg/m2 representing the 25th, 60th, and 85th percentiles, respectively). With these 10 BMI trajectories, we then tested hypotheses regarding differential associations between BMI trajectories and CVD risk factors among individuals at the same wave IV BMI. Hereafter, we refer to BMI at a given age x as BMIx; i.e., BMI at age 27 is denoted BMI27y and BMI change across age by BMI15-27y.
Figure 1.
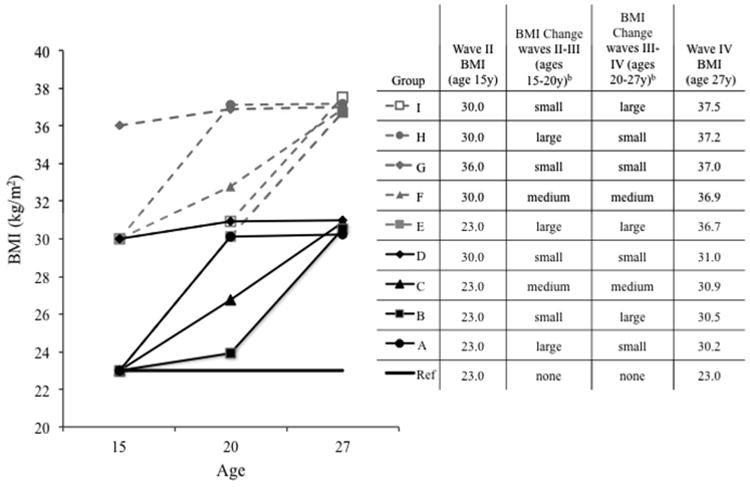
Constructed BMI trajectories used to examine differential odds of diabetes, hypertension, and inflammation in participants aged 15 y at wave II, from the National Longitudinal Study of Adolescent Healtha
aWe derived 10 BMI trajectories (Figure 1) based on: (1) a priori research interests regarding baseline weight, timing of weight gain, and adult weight in association with future cardiometabolic risk; and (2) distributions of BMI and BMI change in our nationally representative sample, ensuring that the 10 selected BMI trajectories were well represented in the sample (and thus in the United States). We chose the following distributions of BMI and BMI change to construct our trajectories: wave II BMI (23, 30, and 36 kg/m2 representing the 25th, 75th, and 95th percentiles, respectively), BMI change between waves (≈1, 4, or 8 BMI unit increase between waves II-III or III-IV representing the 20th, 60th, or 90th percentiles of BMI change, respectively), and wave IV BMI (23, 30, and 36 kg/m2 representing the 25th, 60th, and 85th percentiles, respectively). With these 10 BMI trajectories, we then tested hypotheses regarding differential associations between BMI trajectories and CVD risk factors. The consistent BMI=23 kg/m2 trajectory over the full follow-up period was used as the referent in statistical modeling.
bSmall (≈20th percentile), medium (≈60th percentile), and large (≈90th percentile) annualized change in BMI between waves II-III or waves III-IV are based upon the distribution in the analytic sample.
In Table 4, we present ORs for diabetes, inflammation, and hypertension across each of the 10 trajectories with the stable BMI15-27y=23kg/m2 trajectory as the referent. We used post-hoc tests to assess trajectory group differences in ORs. We found higher odds of diabetes for men in group A: BMI15y=23.0 kg/m2, large BMI15-27y gain, small BMI20-27y gain [OR=2.35 (1.51, 3.66)] compared to group B: BMI15y=23.0 kg/m2, small BMI15-20y gain, large BMI20-27y gain [OR=1.44 (1.10 1.87)], despite the fact that groups A and B had a similar BMI27y (≈30 kg/m2). While wave II BMI and BMI change from waves II-III and III-IV were strongly associated with hypertension, we observed only small differences in hypertension ORs for men with BMI27y≈30 kg/m2 (groups AD) or 36 kg/m2 (groups E-I) using post-hoc testing.
Table 4. Wave II BMI, BMI change between wave II-III and III-IV, wave IV BMI, and odds ratios (95% confidence intervals) from separate logistic regressions for diabetes, hypertension, or inflammation at wave IV, from the National Longitudinal Study of Adolescent Healtha.
| Wave II BMI (15 y) | BMI Change Waves II-III (15-20 y)b | BMI Change Waves III-IV (20-27 y)b | Wave IV BMI (27 y) | Group | Men Diabetes | Women Diabetes | Men Hypertension | Women Hypertension | Men Inflammation | Women Inflammation |
|---|---|---|---|---|---|---|---|---|---|---|
| 23.0 | None | None | 23.0 | Ref | 1.00 | 1.00 | 1.00 | 1.00 | 1.00 | 1.00 |
| Groups with BMI∼30 kg/m2 at wave IVc | ||||||||||
| 23.0 | Large | Small | 30.2 | A | 2.35 (1.51, 3.66)AB, AC | 1.98 (1.39, 2.82)AB,AC | 2.13 (1.73, 2.61) | 2.06 (1.76, 2.41) | 2.58 (1.88, 3.56) | 3.09 (2.41, 3.95)AB,AC,AD |
| 23.0 | Small | Large | 30.5 | B | 1.44 (1.10, 1.87)BC, BD | 1.27 (0.99, 1.62)BC, BD | 1.76 (1.44, 2.14)BC | 1.71 (1.47, 2.00)BC | 2.94 (2.24, 3.87) | 4.29 (3.57, 5.17)BD |
| 23.0 | Medium | Medium | 30.9 | C | 1.84 (1.37, 2.47) | 1.58 (1.25, 1.99) | 1.99 (1.66, 2.38) | 1.93 (1.69, 2.20) | 2.98 (2.30, 3.87) | 4.07 (3.41, 4.86)CD |
| 30.0 | Small | Small | 31.0 | D | 2.33 (1.92, 2.83) | 1.70 (1.15, 2.51) | 2.08 (1.81, 2.39) | 1.79 (1.37, 2.35) | 2.60 (2.20, 3.07) | 3.14 (2.22, 4.44) |
| Groups with BMI∼36 kg/m2 at wave IVc | ||||||||||
| 23.0 | Large | Large | 36.7 | E | 3.02 (1.77, 5.17)EH | 2.30 (1.52, 3.49)EH | 3.38 (2.48, 4.61) | 3.20 (2.54, 4.02) | 6.65 (4.21, 10.51) | 11.28 (8.24, 15.43)EF,EG,EH,EI |
| 30.0 | Medium | Medium | 36.9 | F | 3.39 (2.53, 4.55)FH | 2.46 (1.93, 3.13)FH | 3.35 (2.77, 4.06)FH | 2.90 (2.46, 3.42)FH | 5.93 (4.62, 7.62)FI | 6.55 (5.40, 7.96)FG,FI |
| 36.0 | Small | Small | 37.0 | G | 4.37 (3.07, 6.22)GI | 2.99 (2.16, 4.14)GI | 3.56 (2.74, 4.61) | 2.84 (2.27, 3.55) | 5.24 (3.84, 7.15) | 3.80 (3.00, 4.81)GH,GI |
| 30.0 | Large | Small | 37.2 | H | 4.90 (3.10, 7.74)HI | 3.41 (2.41, 4.81)HI | 3.99 (3.16, 5.03) | 3.43 (2.84, 4.13) | 5.87 (4.25, 8.11) | 5.81 (4.42, 7.63)HI |
| 30.0 | Small | Large | 37.5 | I | 2.99 (2.20, 4.08) | 2.18 (1.62, 2.94) | 3.30 (2.64, 4.12) | 2.85 (2.34, 3.47) | 6.68 (4.99, 8.95) | 8.08 (6.48, 10.07) |
Models are survey-weighted and adjust for age at wave II, smoking status at waves II, III, and IV, race, region, and cluster at the school level (primary sampling unit). Models additionally controlled for parental history of diabetes (yes/no) [diabetes model] and anti-inflammatory medication use (yes/no), presence of subclinical infection markers (0, 1, 2, or ≥3 markers), current infections/inflammatory disease (0, 1, 2, or ≥3 infections/inflammatory diseases at survey). Data provided as odds ratios (95% confidence intervals) except for wave II and wave IV BMI (kg/m2).
Small (≈20th percentile), medium (≈60th percentile), and large (≈90th percentile) annualized change in BMI between waves II-III or waves III-IV are based upon the distribution in the analytic sample.
Post-hoc tests for odds ratio differences within groups with wave IV BMI≈30 kg/m2 (A-D) or 36 kg/m2 (E-I) were tested using χ2 tests, with significance set at the p<0.05 level. Superscripts next to ORs refer to statistically significant differences between two groups (e.g., superscript of “AD” means that groups “A” and “D” have statistically significantly different ORs for a particular outcome).
At a given BMI27y, women with small BMI15-27y gain (groups D and G) had significantly lower odds of inflammation compared to referent (stable BMI15-27y=23 kg/m2) than women with medium or large BMI15-27y gain (groups A-C, E-F, H-I) (Table 4). In fact, the OR for inflammation at age 27y in women with stable BMI15-27y≈36 kg/m2 [group G; OR=3.80 (3.00, 4.81)] was lower than the OR for group C: BMI15y=23 kg/m2, medium BMI15-27y gain, and BMI27y≈30 kg/m2 [OR=4.07 (3.41, 4.86)].
In sensitivity testing, we assessed differences in the imputation versus full sample. Respondents with any missing data (n=6,008) versus complete data (n=7,976) were older, a greater proportion were minority race/ethnicity, and they had higher CVD risk factor prevalence (p<0.006) (Supplemental Table 1). Further, there was strong agreement in mean BMI and proportion of smokers in the sample for whom we had anthropometry measures versus the full analytic sample (n=13,974) (Supplemental Table 2).
We replicated the central models (Tables 3 and 4) in respondents with complete (non-missing) data (n=7,976). Coefficients and ORs did not differ from main analytic sample (n=13,984), which included measured (n=7,976) and imputed (n=6,008) data, suggesting that imputed values did not introduce bias into estimates for diabetes, hypertension, and inflammation (Supplemental Tables 3 and 4).
We also replicated the central models (Tables 3 and 4) with the inclusion of potential confounders. Attained education (as a measure of socioeconomic status) did not meet the 10% change-in-estimate criterion for confounding on main exposure variables in any model, thus it was not retained (Supplemental Table 5). In a separate test, we included diet and physical activity variables; again, the 10% change-in-estimate confounding criterion was not met and these variables were not retained (Supplemental Table 6).
Finally, to test sensitivity of our findings to intentional weight loss after CVD risk factor diagnosis (more likely to occur between waves III-IV [mean ages: 22.5-29.0y] than waves II-III [mean ages: 16.9-22.5y], we repeated analyses excluding BMI change between waves III-IV. Coefficients for wave II BMI and BMI change between waves II-III did not alter direction or strength of effect (results not shown).
Discussion
In this nationally representative, prospective cohort of adolescents followed into adulthood, we found that for adults at equivalent BMI, odds of diabetes, hypertension and inflammation differed according to BMI trajectories from adolescence to adulthood. Weight gain between ages 15-20y was associated with comparatively higher odds of diabetes and hypertension than weight gain from ages 20-27y. Particularly in women, medium or large weight gain between ages 15-27y was associated with higher odds for inflammation at age 27y, even if age 27y BMI was lower. Our finding that BMI and BMI change between waves II-IV (mean ages: 17-29y) was strongly associated with diabetes, hypertension, and inflammation at wave IV (mean age: 29y), suggests that this time period is a crucial window during which clinicians can impact future cardiometabolic health. Thus, in addition to intervening during pediatric years (a difficult period for lifestyle intervention), the period between adolescence and the third decade of life provides another important opportunity for prevention and screening efforts, particularly given that this period is one where precursors of adult CVD are rapidly developing.16-20
Previous studies focusing on weight history and CVD risk have typically used data from two visits, relied on self-reported/recalled BMI,13-15 or were conducted in one sex or ethnic group,6-8,10-12 had small sample size,6 and examined older adult10,11 or obese populations14 rather than population-based samples. Studies have shown that BMI gain between ages 40-55y15 or longer obesity duration4,7,8,15 more strongly relates to diabetes risk than recent obesity incidence, with some exceptions.6 Yet, there is a dearth of prospective studies using measured anthropometry across the adolescent to early adult periods to examine associations with CVD risk factors. Our nationally representative, longitudinal dataset spanning the teen to adult years provides sufficient variation to examine associations between well-represented BMI trajectories across these periods and CVD risk factors in adulthood.
For diabetes, higher age 15y BMI and large BMI gain between ages 15-20y was more strongly associated with diabetes at age 27y than weight gain between ages 20-27y. For given age 27y BMI, we observed highest diabetes odds for individuals with stable and high BMI trajectories from ages 15-27y. Together, our findings of stronger associations with diabetes for past BMI and distal BMI gain suggest diabetes risk is compounded by time spent at elevated BMI, potentially through efficiency of insulin secretion and action.4,30.
We observed that age 27y BMI was more predictive of current hypertension status than BMI trajectory from ages 15-27y. Similarly, other researchers have found comparatively stronger associations between current BMI31 (versus overweight duration6,13,14) and hypertension risk and that previously overweight but currently normal weight (BMI<25 kg/m2) individuals did not have higher hypertension risk than individuals who maintained normal weight over time.11,32 Current BMI may be particularly related to hypertension in our cohort because of the immediate effects of excess weight on BP in terms of greater cardiac output and vascular resistance.33
BMI gain during the transition from adolescence to adulthood was associated with greater odds of inflammation than current (age 27y) or past (age 15y) BMI alone. For women in our sample, even at lower age 27y BMI, medium/large BMI gain (versus stable BMI) between ages 15-27y was associated with higher odds of inflammation. In general, studies suggest comparatively stronger associations between BMI gain or loss with CRP increase34 or decline35 than current BMI.12 Yet the published research has not addressed the transition from adolescence to young adulthood in an ethnically-diverse, prospective cohort. Current debate concerning the direction of association between CRP and BMI36 suggests that this association might capture respondents most likely to continue gaining weight, rather than reflecting increased risk from past weight gain.
Our study is not without limitations. Given that we do not have earlier measures of BP, HbA1c, and CRP or a history of date of diagnoses, it is possible that our trajectories include time before and after CVD risk factor onset, and thus intentional weight loss after diagnosis may have resulted in weakened observed associations, even in our relatively young sample (mean ages: 17-29y). Similarly, we do not know about pre-existing obesity prior to study entry, although our study spans 12 years during a time of substantial weight gain. We were unable to distinguish Type 1 and Type 2 diabetes (T2D), which is of concern as weight change is thought to be related to the development of T2D; collapsing the groups likely underestimates associations between BMI trajectories and T2D. A growing literature suggests differential associations between BMI and CVD risk factors by race/ethnicity,37 thus our findings may not be generalizable beyond the US, though national representation provides generalizability in the US. Due to survey design and loss to follow up across the study period, we imputed missing BMI data for ∼25% of our observations using state-of-the-art, well-validated statistical techniques in an imputation model that included covariates associated with missingness and corrected for survey design. Given that our largest source of missingness was related to study design and because the Add Health longitudinal survey weights account for non-response bias,25 we had justification to impute these missing values. We present detailed sensitivity analyses to examine model differences using imputed versus non-missing data. Our findings suggest that use of imputed data does not alter our conclusions from the central analyses.
Despite these limitations, our study makes several contributions to the literature. The age span of our sample is a strength of our study. Indeed, it is quite interesting that in this short span of time and at these young ages, BMI and BMI change related differentially to diabetes, hypertension, and inflammation. Our derived BMI trajectories were well-represented in our nationally-representative sample. Indeed our sample provides the only nationally-representative, longitudinal sample with measured height and weight that spans the late teen and early adult years. With innovative modeling strategies, we estimated contributions of BMI trajectories during the adolescence to adulthood transition relative to attained BMI on diabetes, hypertension, and inflammation risk; this modeling approach can now be adapted for use in other ethnicities and during other life cycle periods to better understand associations between BMI trajectories and CVD risk factors as well as high-impact periods for CVD prevention and intervention efforts.
In this nationally representative, ethnically diverse, prospective cohort, diabetes risk in adulthood was strongly related to BMI during adolescence and BMI gain between the “school years” (teen years) and “college years” (early 20′s). In contrast, hypertension risk in adulthood was strongly related to current BMI, whereas inflammation risk was positively associated with BMI gain, rather than current BMI. Our findings suggest that for given adult BMI, varying BMI trajectories from adolescence to adulthood are associated with differential CVD risk, and that there is utility in targeted counseling on weight and CVD prevention during these periods. Given increasing prevalence of childhood and adolescent obesity, as well as potential for large weight gain in the teens and 20′s, there is need for further inquiry into mechanistic links between BMI trajectories and CVD risk at different periods of the lifecycle.
Supplementary Material
Table S1. Comparison of sample characteristics across respondents with and without missing data, from the National Longitudinal Study of Adolescent Health.
aStatistically significant difference in characteristics for the sample with no missing data relative to the sample with any missing data using Chi-squared tests (categorical) or t-tests (continuous) at Bonferroni-corrected p<0.006 level (type 1 error rate 0.05 across 9 comparisons).
Table S2. Mean BMI or proportion of smokers at waves II, III, and IV for measured values across all visits versus a combination of measured and imputed values, from the National Longitudinal Study of Adolescent Healtha
aMultiple Imputation Chained Equations model in Stata 12 was used to impute values for continuous BMI (n=6,008; obs=3,860 wave II; obs=3,185 wave III; obs=164 wave IV) and categorical smoking status (n=6,008; obs=3,558 wave II; obs=2,370 wave III; obs=41 wave IV). The imputation model included age at each wave, race, parental history of diabetes, variables correcting for survey design including: longitudinal survey weights, region, and indicator variables for oversampled groups: disabled, blacks from well-educated families, Chinese, Cubans, and Puerto Ricans. Diabetes, hypertension, and inflammation were included in the imputation model for BMI and smoking to preserve outcome-predictor associations appropriately. Longitudinal sample weights and clustering at the school level (primary sampling unit) accounted for survey design methods and nonresponse bias. Imputation was carried out separately by sex. bMeasured at wave II: 10,131 observations; wave III 10,799 observations; wave IV: 13,820 observations. Measured and imputed: 13,984 observations at all waves. cMeasured at wave II: 10,426 observations; wave III 11,614 observations; wave IV: 13,943 observations. Measured and imputed: 13,984 observations at all waves.
Table S3. Complete case analysis (n=7,976): model coefficients and 95% confidence intervals from separate logistic regressions predicting diabetes, hypertension, or inflammation at wave IV for those with no missing information (n=7,976), from the National Longitudinal Study of Adolescent Healtha,b
aModels are survey-weighted and adjust for age at wave II, smoking status at waves II, III, and IV, race, region, and cluster at the school level (primary sampling unit). bDiabetes defined as HbA1c ≥ 6.5%, doctor diagnosis, or self-report of diabetes medication. Hypertension defined as systolic/diastolic blood pressure ≥ 140/90 mmHg, doctor diagnosis, or self-report of antihypertensive medication. Inflammation defined as high-sensitive C-reactive protein between 3 and 10 mg/L. cModel for diabetes additionally controlled for family history of diabetes. dModel for inflammation additionally controlled for use of anti-inflammatory medication (yes vs no), the presence of subclinical infection markers (0, 1, 2, or 3+ markers) or inflammatory diseases (0, 1, 2, or 3+ inflammatory diseases) at time of wave IV survey. Abbreviations: CI: Confidence Interval. Stars denote significance via Wald test at p<0.05 (*), p<0.01 (**), or p<0.001 (***) level.
Table S4. Complete case analysis (n=7,976): wave II BMI, BMI change between wave II-III and III-IV, wave IV BMI, and Odds Ratios (95% Confidence Intervals) from separate logistic regressions for diabetes, hypertension, or inflammation at wave IV for those with no missing data (n=7,976), from the National Longitudinal Study of Adolescent Healtha
aModels are survey-weighted and adjust for age at wave II, smoking status at waves II, III, and IV, race, region, and cluster at the school level (primary sampling unit). Models additionally controlled for parental history of diabetes (yes/no) [diabetes model] and anti-inflammatory medication use (yes/no), presence of subclinical infection markers (0, 1, 2, or ≥3 markers), current infections/inflammatory disease (0, 1, 2, or ≥3 infections/inflammatory diseases at survey). bSmall (∼20th percentile), medium (∼60th percentile), and large (∼90th percentile) annualized change in BMI between waves II-III or waves III-IV are based upon the distribution in the analytic sample. cPost-hoc tests for OR differences within groups with wave IV BMI∼30 kg/m2 (A-D) or ∼36 kg/m2 (E-I) were tested using χ2 tests, with significance set at the p<0.05 level. Superscripts next to ORs refer to statistically significant differences between two groups (e.g., superscript of “AD” means that groups “A” and “D” have statistically significantly different ORs for a particular outcome).
Table S5. Model coefficients and 95% confidence intervals from separate logistic regressions predicting diabetes, hypertension, or inflammation at wave IV with additional control for attained education, from the National Longitudinal Study of Adolescent Healtha,b
aModels are survey-weighted and adjust for age at wave II, smoking status at waves II, III, and IV, race, region, attained education at wave IV and cluster at the school level (primary sampling unit). bDiabetes defined as HbA1c ≥ 6.5%, doctor diagnosis, or self-report of diabetes medication. Hypertension defined as systolic/diastolic blood pressure ≥ 140/90 mmHg, doctor diagnosis, or self-report of antihypertensive medication. Inflammation defined as high-sensitive C-reactive protein between 3 and 10 mg/L. cModel for diabetes additionally controlled for family history of diabetes. dModel for inflammation additionally controlled for use of anti-inflammatory medication (yes vs no), the presence of subclinical infection markers (0, 1, 2, or 3+ markers) or inflammatory diseases (0, 1, 2, or 3+ inflammatory diseases) at time of wave IV survey. Abbreviations: CI: Confidence Interval. Stars denote significance via Wald test at p<0.05 (*), p<0.01 (**), or p<0.001 (***) level.
Table S6. Model coefficients and 95% confidence intervals from separate logistic regressions predicting diabetes, hypertension, or inflammation at wave IV with additional adjustment for diet and physical activity, from the National Longitudinal Study of Adolescent Healtha,b
aModels are survey-weighted and adjust for age at wave II, smoking status at waves II, III, and IV, race, region, sugar-sweetened beverages consumed and number of fast food eating occasions in the last seven days, number of sports, biking, walking, or skating activities in the last seven days at waves II, III, and IV, and cluster at the school level (primary sampling unit). bDiabetes defined as HbA1c ≥ 6.5%, doctor diagnosis, or self-report of diabetes medication. Hypertension defined as systolic/diastolic blood pressure ≥ 140/90 mmHg, doctor diagnosis, or self-report of antihypertensive medication. Inflammation defined as high-sensitive C-reactive protein between 3 and 10 mg/L. cModel for diabetes additionally controlled for family history of diabetes. dModel for inflammation additionally controlled for use of anti-inflammatory medication (yes vs no), the presence of subclinical infection markers (0, 1, 2, or 3+ markers) or inflammatory diseases (0, 1, 2, or 3+ inflammatory diseases) at time of wave IV survey. Abbreviations: CI: Confidence Interval; SSB: sugar-sweetened beverages; FF: fast food; PA: physical activity, Stars denote significance via Wald test at p<0.05 (*), p<0.01 (**), or p<0.001 (***) level.
What is already known about this subject
The transition between adolescence and young adulthood is a high risk period for weight gain, yet few ethnically diverse, population-based studies have examined differential BMI trajectories across these periods in association with CVD risk factors in adulthood.
Most literature on weight change has used traditional simple linear methods to define weight trajectories, rather than innovative methodologies to capture and compare differential growth trajectories and health outcomes.
We have shown that diabetes risk is particularly high in individuals who were obese as adolescents relative to those with adult-onset obesity,1 yet little is known about differential effects of BMI gain trajectories on diabetes, inflammation, and hypertension.
What this study adds
In adults of the same BMI, the odds of current diabetes, hypertension, and inflammation differs depending upon differential trajectories of BMI from adolescence into adulthood.
Weight gain at different points of the lifecycle is associated with differential health risk and young adulthood offers a critical window for intervention.
Derived BMI trajectory patterns may be useful in informing targeted CVD prevention for adolescents and screening for adults in primary care settings.
Acknowledgments
This study was funded by National Institutes of Health Grant R01HD057194. The Carolina Population Center (R24 HD050924) provided general support. This research uses data from Add Health, a program project directed by Kathleen Mullan Harris and designed by J. Richard Udry, Peter S. Bearman, and Kathleen Mullan Harris at the University of North Carolina at Chapel Hill and funded by Grant P01- HD31921 from the Eunice Kennedy Shriver National Institute of Child Health and Human Development, with cooperative funding from 23 other federal agencies and foundations. Special acknowledgment is given to Ronald R. Rindfuss and Barbara Entwisle, of the University of North Carolina at Chapel Hill, for assistance in the original design. Information about how to obtain the Add Health data files is available at http://www.cpc.unc.edu/addhealth. No direct support was received from Grant P01-HD31921 for this analysis.
SMA and PG-L designed the study. SMA, AHH, AGH, and PG-L contributed to data analysis and wrote the manuscript. SMA and PG-L had full access to the data in the study and take responsibility for the integrity of the data and the accuracy of the data analysis.
The authors thank Trivellore Raghunathan, PhD, University of Michigan, for helpful comments concerning the use and evaluation of multiple imputation, Dr. Raghunathan and Dr. Chirayath Suchindran, PhD, University of North Carolina-Chapel Hill, for advice on using the Add Health survey weights in this setting, and Tom Swasey, Carolina Population Center, for graphics support.
Footnotes
Disclosures: The authors declared no conflicts of interest.
References
- 1.The NS, Suchindran C, North KE, Popkin BM, Gordon-Larsen P. Association of adolescent obesity with risk of severe obesity in adulthood. JAMA. 2010 Nov 10;304(18):2042–2047. doi: 10.1001/jama.2010.1635. [DOI] [PMC free article] [PubMed] [Google Scholar]
- 2.McTigue KM, Harris R, Hemphill B, et al. Screening and interventions for obesity in adults: summary of the evidence for the U.S. Preventive Services Task Force. Ann Intern Med. 2003;139(11):933–949. doi: 10.7326/0003-4819-139-11-200312020-00013. [DOI] [PubMed] [Google Scholar]
- 3.Chobanian AV, Bakris GL, Black HR, et al. The Seventh Report of the Joint National Committee on Prevention, Detection, Evaluation, and Treatment of High Blood Pressure: the JNC 7 report. JAMA. 2003 May 21;289(19):2560–2572. doi: 10.1001/jama.289.19.2560. [DOI] [PubMed] [Google Scholar]
- 4.Felber JP, Golay A. Pathways from obesity to diabetes. Int J Obes. 2002;26(Suppl 2):S39–S45. doi: 10.1038/sj.ijo.0802126. [DOI] [PubMed] [Google Scholar]
- 5.Pearson TA, Mensah GA, Alexander RW, et al. Markers of inflammation and cardiovascular disease: application to clinical and public health practice: A statement for healthcare professionals from the Centers for Disease Control and Prevention and the American Heart Association. Circulation. 2003 Jan 28;107(3):499–511. doi: 10.1161/01.cir.0000052939.59093.45. [DOI] [PubMed] [Google Scholar]
- 6.Hekimsoy Z, Oktem IK. Duration of obesity is not a risk factor for type 2 diabetes mellitus, arterial hypertension and hyperlipidemia. Diabetes Obes Metab. 2003;5(6):432–437. doi: 10.1046/j.1463-1326.2003.00298.x. [DOI] [PubMed] [Google Scholar]
- 7.Everhart JE. Duration of Obesity Increases the Incidence of NIDDM. Diabetes. 1992;41(2):235–240. doi: 10.2337/diab.41.2.235. [DOI] [PubMed] [Google Scholar]
- 8.Wannamethee SG, Shaper AG. Weight Change and Duration of Overweight and Obesity in the Incidence of Type 2 Diabetes. Diabetes Care. 1999;22(8):1266–1272. doi: 10.2337/diacare.22.8.1266. [DOI] [PubMed] [Google Scholar]
- 9.American Diabetes Association. Standards of Medical Care in Diabetes—2010. Diabetes Care. 2010;33(Suppl1):S11–S61. doi: 10.2337/dc10-S011. [DOI] [PMC free article] [PubMed] [Google Scholar]
- 10.Sakurai Y, Teruya K, Shimada N, et al. Association between duration of obesity and risk of non-insulin-dependent diabetes mellitus. The Sotetsu Study. Am J Epidemiol. 1999;149(3):256–260. doi: 10.1093/oxfordjournals.aje.a009800. [DOI] [PubMed] [Google Scholar]
- 11.Shihab HM, Meon LA, Chu AY, et al. Body mass index and risk of incident hypertension over the life course: the Johns Hopkins Precursors Study. Circulation. 2012;126(25):2983–2989. doi: 10.1161/CIRCULATIONAHA.112.117333. [DOI] [PMC free article] [PubMed] [Google Scholar]
- 12.Villegas R, Xiang YB, Cai H, et al. Lifestyle determinants of C-reactive protein in middle-aged, urban Chinese men. Nutr Metab Cardiovasc Dis. 2012 Mar;22(3):223–230. doi: 10.1016/j.numecd.2010.07.007. [DOI] [PMC free article] [PubMed] [Google Scholar]
- 13.Janssen I, Katzmarzyk PT, Ross R. Duration of overweight and metabolic health risk in American men and women. Ann Epidemiol. 2004;14(8):585–591. doi: 10.1016/j.annepidem.2004.01.007. [DOI] [PubMed] [Google Scholar]
- 14.Pontiroli AE, Galli L. Duration of obesity is a risk factor for non-insulin-dependent diabetes mellitus, not for arterial hypertension or for hyperlipidaemia. Acta Diabetol. 1998;35(3):130–136. doi: 10.1007/s005920050117. [DOI] [PubMed] [Google Scholar]
- 15.Schienkiewitz A, Schulze MB, Hoffmann K, Kroke A, Boeing H. Body mass index history and risk of type 2 diabetes: results from the European Prospective Investigation into Cancer and Nutrition (EPIC)–Potsdam Study. Am J Clin Nutr. 2006;84(2):427–433. doi: 10.1093/ajcn/84.1.427. [DOI] [PubMed] [Google Scholar]
- 16.Klag MJ, Ford DE, Mead LA, et al. Serum Cholesterol in Young Men and Subsequent Cardiovascular Disease. N Engl J Med. 1993;328:313–318. doi: 10.1056/NEJM199302043280504. [DOI] [PubMed] [Google Scholar]
- 17.McCarron P, Smith GD, Okasha M, McEwen J. Blood pressure in young adulthood and mortality from cardiovascular disease. Lancet. 2000;355:1430–1431. doi: 10.1016/S0140-6736(00)02146-2. [DOI] [PubMed] [Google Scholar]
- 18.Rademacher ER, Jacobs DR, Moran A, Steinberger J, Prineas RJ, Sinaiko A. Relation of blood pressure and body mass index during childhood to cardiovascular risk factor levels in young adults. J Hypertens. 2009;27(9):1766–1774. doi: 10.1097/HJH.0b013e32832e8cfa. [DOI] [PMC free article] [PubMed] [Google Scholar]
- 19.Tracy RP. Inflammation markers and coronary heart disease. Curr Opin Lipod. 1999;10:435–441. doi: 10.1097/00041433-199910000-00008. [DOI] [PubMed] [Google Scholar]
- 20.Greenland P, Gidding SS, Tracy RP. Commentary: Lifelong prevention of atherosclerosis: the critical importance of major risk factor exposures. Int J Epidemiol. 2002;31(6):1129–1134. doi: 10.1093/ije/31.6.1129. [DOI] [PubMed] [Google Scholar]
- 21.Popkin BM, Udry JR. Adolescent obesity increases significantly in second and third generation U.S. immigrants: the National Longitudinal Study of Adolescent Health. J Nutr. 1998;128(4):701–706. doi: 10.1093/jn/128.4.701. [DOI] [PubMed] [Google Scholar]
- 22.Tamborlane WV, Kollman C, Steffes MW, et al. Comparison of fingerstick hemoglobin A1c levels assayed by DCA 2000 with the DCCT/EDIC central laboratory assay: Results of a Diabetes Research in Children Network (DirecNet) Study. Pediatric Diabetes. 2005 Mar;6(1):13–16. doi: 10.1111/j.1399-543X.2005.00088.x. [DOI] [PubMed] [Google Scholar]
- 23.American Diabetes Association. Diagnosis and Classification of Diabetes Mellitus. Diabetes Care. 2011;34(1):S62–S69. doi: 10.2337/dc11-S062. [DOI] [PMC free article] [PubMed] [Google Scholar]
- 24.McDade TW, Burhop J, Dohnal J. High-sensitivity enzyme immunoassay for C-reactive protein in dried blood spots. Clin Chem. 2004 Mar;50(3):652–654. doi: 10.1373/clinchem.2003.029488. [DOI] [PubMed] [Google Scholar]
- 25.Chantala K, Kalsbeek WD, Andraca E. Non-Response in Wave III of the Add Health Study. 2005 [Google Scholar]
- 26.White IR, Royston P, Wood AM. Multiple imputation using chained equations: issues and guidance for practice. Stat Med. 2010;30:377–399. doi: 10.1002/sim.4067. [DOI] [PubMed] [Google Scholar]
- 27.Multiple-Imputation Reference Manual: Stata 12. Stata Press; 2011. [Google Scholar]
- 28.Rubin D. Multiple imputation for nonresponse in surveys. New York: Wiley; 1987. [Google Scholar]
- 29.Little RJA, Rubin DB. Statistical analysis with missing data. 2nd. New York: Wiley & Sons; 2002. [Google Scholar]
- 30.Kahn SE, Hulll RL, Utzschneider KM. Mechanisms linking obesity to insulin resistance and type 2 diabetes. Nature. 2006;444(7121):840–846. doi: 10.1038/nature05482. [DOI] [PubMed] [Google Scholar]
- 31.Stamler R, Stamler J, Riedlinger W, Algera G, Roberts R. Weight and Blood Pressure: Findings in Hypertension Screening of 1 Million Americans. JAMA: The Journal of the American Medical Association. 1978;240(15):1607. doi: 10.1001/jama.240.15.1607. [DOI] [PubMed] [Google Scholar]
- 32.Juonala M, Magnussen CG, Berenson GS, et al. Childhood Adiposity, Adult Adiposity, and Cardiovascular Risk Factors. N Engl J Med. 2011;365(20):1876–1885. doi: 10.1056/NEJMoa1010112. [DOI] [PubMed] [Google Scholar]
- 33.Poirier P, Giles TD, Bray GA, et al. Obesity and Cardiovascular Disease: Pathophysiology, Evaluation, and Effect of Weight Loss: An Update of the 1997 American Heart Association Scientific Statement on Obesity and Heart Disease From the Obesity Committee of the Council on Nutrition, Physical Activity, and Metabolism. Circulation. 2006 Feb 14;113(6):898–918. doi: 10.1161/CIRCULATIONAHA.106.171016. [DOI] [PubMed] [Google Scholar]
- 34.Fogarty AW, Glancy C, Jones S, Lewis SA, McKeever TM, Britton JR. A prospective study of weight change and systemic inflammation over 9 y. Am J Clin Nutr. 2008;87(1):30–35. doi: 10.1093/ajcn/87.1.30. [DOI] [PubMed] [Google Scholar]
- 35.Yatsuya H, Jeffery RW, Langer SL, et al. Changes in C-reactive protein during weight loss and the association with changes in anthropometric variables in men and women: LIFE Study. Int J Obes. 2011 May;35(5):684–691. doi: 10.1038/ijo.2010.200. [DOI] [PMC free article] [PubMed] [Google Scholar]
- 36.Timpson NJ, Nordestgaard BG, Harbord RM, et al. C-reactive protein levels and body mass index: elucidating direction of causation through reciprocal Mendelian randomization. Int J Obes. 2011;35(2):300–308. doi: 10.1038/ijo.2010.137. [DOI] [PMC free article] [PubMed] [Google Scholar]
- 37.WHO Expert Consultation. Appropriate body mass index for Asian populations and its implications for policy and intervention strategies. Lancet. 2004;363:157–163. doi: 10.1016/S0140-6736(03)15268-3. [DOI] [PubMed] [Google Scholar]
Associated Data
This section collects any data citations, data availability statements, or supplementary materials included in this article.
Supplementary Materials
Table S1. Comparison of sample characteristics across respondents with and without missing data, from the National Longitudinal Study of Adolescent Health.
aStatistically significant difference in characteristics for the sample with no missing data relative to the sample with any missing data using Chi-squared tests (categorical) or t-tests (continuous) at Bonferroni-corrected p<0.006 level (type 1 error rate 0.05 across 9 comparisons).
Table S2. Mean BMI or proportion of smokers at waves II, III, and IV for measured values across all visits versus a combination of measured and imputed values, from the National Longitudinal Study of Adolescent Healtha
aMultiple Imputation Chained Equations model in Stata 12 was used to impute values for continuous BMI (n=6,008; obs=3,860 wave II; obs=3,185 wave III; obs=164 wave IV) and categorical smoking status (n=6,008; obs=3,558 wave II; obs=2,370 wave III; obs=41 wave IV). The imputation model included age at each wave, race, parental history of diabetes, variables correcting for survey design including: longitudinal survey weights, region, and indicator variables for oversampled groups: disabled, blacks from well-educated families, Chinese, Cubans, and Puerto Ricans. Diabetes, hypertension, and inflammation were included in the imputation model for BMI and smoking to preserve outcome-predictor associations appropriately. Longitudinal sample weights and clustering at the school level (primary sampling unit) accounted for survey design methods and nonresponse bias. Imputation was carried out separately by sex. bMeasured at wave II: 10,131 observations; wave III 10,799 observations; wave IV: 13,820 observations. Measured and imputed: 13,984 observations at all waves. cMeasured at wave II: 10,426 observations; wave III 11,614 observations; wave IV: 13,943 observations. Measured and imputed: 13,984 observations at all waves.
Table S3. Complete case analysis (n=7,976): model coefficients and 95% confidence intervals from separate logistic regressions predicting diabetes, hypertension, or inflammation at wave IV for those with no missing information (n=7,976), from the National Longitudinal Study of Adolescent Healtha,b
aModels are survey-weighted and adjust for age at wave II, smoking status at waves II, III, and IV, race, region, and cluster at the school level (primary sampling unit). bDiabetes defined as HbA1c ≥ 6.5%, doctor diagnosis, or self-report of diabetes medication. Hypertension defined as systolic/diastolic blood pressure ≥ 140/90 mmHg, doctor diagnosis, or self-report of antihypertensive medication. Inflammation defined as high-sensitive C-reactive protein between 3 and 10 mg/L. cModel for diabetes additionally controlled for family history of diabetes. dModel for inflammation additionally controlled for use of anti-inflammatory medication (yes vs no), the presence of subclinical infection markers (0, 1, 2, or 3+ markers) or inflammatory diseases (0, 1, 2, or 3+ inflammatory diseases) at time of wave IV survey. Abbreviations: CI: Confidence Interval. Stars denote significance via Wald test at p<0.05 (*), p<0.01 (**), or p<0.001 (***) level.
Table S4. Complete case analysis (n=7,976): wave II BMI, BMI change between wave II-III and III-IV, wave IV BMI, and Odds Ratios (95% Confidence Intervals) from separate logistic regressions for diabetes, hypertension, or inflammation at wave IV for those with no missing data (n=7,976), from the National Longitudinal Study of Adolescent Healtha
aModels are survey-weighted and adjust for age at wave II, smoking status at waves II, III, and IV, race, region, and cluster at the school level (primary sampling unit). Models additionally controlled for parental history of diabetes (yes/no) [diabetes model] and anti-inflammatory medication use (yes/no), presence of subclinical infection markers (0, 1, 2, or ≥3 markers), current infections/inflammatory disease (0, 1, 2, or ≥3 infections/inflammatory diseases at survey). bSmall (∼20th percentile), medium (∼60th percentile), and large (∼90th percentile) annualized change in BMI between waves II-III or waves III-IV are based upon the distribution in the analytic sample. cPost-hoc tests for OR differences within groups with wave IV BMI∼30 kg/m2 (A-D) or ∼36 kg/m2 (E-I) were tested using χ2 tests, with significance set at the p<0.05 level. Superscripts next to ORs refer to statistically significant differences between two groups (e.g., superscript of “AD” means that groups “A” and “D” have statistically significantly different ORs for a particular outcome).
Table S5. Model coefficients and 95% confidence intervals from separate logistic regressions predicting diabetes, hypertension, or inflammation at wave IV with additional control for attained education, from the National Longitudinal Study of Adolescent Healtha,b
aModels are survey-weighted and adjust for age at wave II, smoking status at waves II, III, and IV, race, region, attained education at wave IV and cluster at the school level (primary sampling unit). bDiabetes defined as HbA1c ≥ 6.5%, doctor diagnosis, or self-report of diabetes medication. Hypertension defined as systolic/diastolic blood pressure ≥ 140/90 mmHg, doctor diagnosis, or self-report of antihypertensive medication. Inflammation defined as high-sensitive C-reactive protein between 3 and 10 mg/L. cModel for diabetes additionally controlled for family history of diabetes. dModel for inflammation additionally controlled for use of anti-inflammatory medication (yes vs no), the presence of subclinical infection markers (0, 1, 2, or 3+ markers) or inflammatory diseases (0, 1, 2, or 3+ inflammatory diseases) at time of wave IV survey. Abbreviations: CI: Confidence Interval. Stars denote significance via Wald test at p<0.05 (*), p<0.01 (**), or p<0.001 (***) level.
Table S6. Model coefficients and 95% confidence intervals from separate logistic regressions predicting diabetes, hypertension, or inflammation at wave IV with additional adjustment for diet and physical activity, from the National Longitudinal Study of Adolescent Healtha,b
aModels are survey-weighted and adjust for age at wave II, smoking status at waves II, III, and IV, race, region, sugar-sweetened beverages consumed and number of fast food eating occasions in the last seven days, number of sports, biking, walking, or skating activities in the last seven days at waves II, III, and IV, and cluster at the school level (primary sampling unit). bDiabetes defined as HbA1c ≥ 6.5%, doctor diagnosis, or self-report of diabetes medication. Hypertension defined as systolic/diastolic blood pressure ≥ 140/90 mmHg, doctor diagnosis, or self-report of antihypertensive medication. Inflammation defined as high-sensitive C-reactive protein between 3 and 10 mg/L. cModel for diabetes additionally controlled for family history of diabetes. dModel for inflammation additionally controlled for use of anti-inflammatory medication (yes vs no), the presence of subclinical infection markers (0, 1, 2, or 3+ markers) or inflammatory diseases (0, 1, 2, or 3+ inflammatory diseases) at time of wave IV survey. Abbreviations: CI: Confidence Interval; SSB: sugar-sweetened beverages; FF: fast food; PA: physical activity, Stars denote significance via Wald test at p<0.05 (*), p<0.01 (**), or p<0.001 (***) level.