

Abstract
Background
Assessment of nutritional status in intensive care unit (ICU) patients is limited. Computed tomography (CT) scans that include the first to fifth lumbar region completed for diagnostic purposes measures fat and lean body mass (LBM) depots and are frequently done in ICU populations and can be used to quantify fat and LBM depots. The purpose of this study was to assess if these scans could measure change in skeletal muscle (SKT), visceral adipose (VAT), and intermuscular adipose (IMAT) tissue and to examine the association between the amount of energy and protein received and changes in these depots.
Methods
Cross-sectional area of SKT, VAT, and IMAT from CT scans at the third lumbar region was quantified at 2 time points (CT1 and CT2). Change scores between CT1 and CT2 for each of these depots and the percentage of estimated energy/protein needs received were determined in 33 adults that with acute respiratory failure. Descriptive statistics and multiple regression was used to evaluate the influence of baseline characteristics and the percentage energy/protein needs received between CT1 and CT2 on percentage change/day between CT1 and CT2 on SKM, IMAT, and VAT.
Results
Participants were on average (SD) 59.7 (16) years old, received 41% of energy and 57% of protein needs. The average time between CT1 and CT2 was 10 (5) days. SKM declined 0.49%/day (men P = .07, women P = .09) and percentage of energy needs received reduced loss (β = 0.024, P = .03). No change in VAT or IMAT occurred.
Conclusions
CT scans can be exploited to assess change in body composition in ICU patients and may assist in detecting the causal link between nutritional support and outcomes in future clinical trials.
Keywords: nutrition assessment, adult, life cycle, outcomes research/quality, nutrition support practice
Malnutrition has been linked to adverse outcomes in hospitalized patients for decades1 and has been estimated to occur in 50% of critically ill patients.2,3 Generally patients who are malnourished tend to have longer hospitalizations, and higher morbidity, mortality and healthcare costs than those who are well nourished.4-6 Nonvolitional feedings are provided to patients in the intensive care unit (ICU) as adjuvant therapy that are assumed to (1) retard the loss lean body mass (LBM) and (2) improve outcomes. To determine if the 2 components of this assumption are true requires precise assessment of LBM and its response to feeding.
Accurate nutritional assessment in ICU patients remains a principal challenge in the field of clinical nutrition. Traditional laboratory measurements for detection and treatment of malnutrition (albumin and various serum proteins) are influenced by the acute phase response and thus not valid as biomarkers of nutritional status in ICU patients.7,8 Obtaining nutritional history from these patients is often limited by the need for mechanical ventilation and sedation. In addition, alterations in fluid status diminish the accuracy of body weight and other anthropometric measures in assessing nutritional status and response to feeding. Studies that have reported change in nutritional status and body composition in hospitalized populations are limited to small prospective cohorts conducted by a few laboratories that relied on in vivo neutron activation analysis or muscle biopsies.9-14
Dual energy X-ray absorptiometry (DXA), computed tomography (CT), and magnetic resonance imaging (MRI) scans have been used in many populations to assess changes in LBM and adipose depots, however they have not been used in hospitalized patients due to the logistics involved and limited availability of the machines for research, rather than clinical purposes. Exploitation of abdominal CTs completed for diagnostic purposes that include the first through the fifth lumbar region (image 1) have been used in a variety of populations including cancer, aging, HIV, liver failure and metabolic syndrome to quantify adipose and muscle tissues.15-23 Patients in the ICU frequently have CT scans performed for diagnostic purposes, however exploitation of this data to discern changes in body composition have not been reported. Therefore, the purpose of this study was to determine if CT scans completed for diagnostic purposes in a heterogenous population of ICU patients could be exploited to measure changes in abdominal skeletal muscle and fat depots. Our secondary goal was to assess the association between the amount of estimated energy and protein needs received and changes in these depots.
Clinical Relevancy
Despite over 50 years of feeding critically ill patients with enteral nutrition (EN) and parenteral nutrition (PN) no prospective randomized studies have assessed their influence on changes in LBM or body composition and linked these changes to clinical outcomes. Thus, it remains unknown if this causal link exists. This study introduces a method of extrapolating data obtained from CT scans completed for diagnostic purposes that enables detection of change in LBM and adipose depots in acutely ill patients. This approach has the potential to expand our understanding of the influence of nutrition support on outcomes and provide much needed data to guide the nutrition practice.
Materials and Methods
Patients and Methods
The electronic medical records of patients admitted to the medical or surgical ICUs at a tertiary care hospital were reviewed over a 12-month period. Participants in the present study reflect a sample of convenience as data were prospectively collected on participants reviewed for consideration in a larger randomized controlled feeding trial. Eligible patients were included in the present study if they had (1) respiratory failure requiring mechanical ventilation, (2) an initial CT scan that included the third lumbar vertebrae (L3) completed while in the ICU, (3) 1 or more follow-up CT images in the L3 region during their hospitalization, and (4) calorie and protein intake data (oral, EN and PN) between the first and second CT (CT1-CT2) scan.24 Ethical approval for this study was granted by the medical center's institutional review board.
CT Image Analysis
Muscle tissue quantification at the L3 area has been shown to be significantly related to whole-body muscle and fat mass.21,25,26 The midpoint of the L3 region was isolated by a radiologist blinded to study outcomes. Tissues were demarcated and quantified using Hounsfield unit thresholds (Figure 1) of −29 to 150 for skeletal muscles (SKM) (including the psoas, erector spinae, quadrates lumborum, transverses abdominus, external and internal obliques, and rectus abdominus); −150 to −50 for visceral adipose tissue (VAT), subcutaneous and intermuscular adipose tissue (IMAT). Cross-sectional area (cm2) was computed by summing tissue pixels and multiplying by the pixel surface area. Images were uploaded and analyzed by 2 individuals using Mimics (version 14, Materialise, Leuven, Belgium) and the mean values for the measurements were utilized. The coefficient of variation was 5%.
Figure 1.
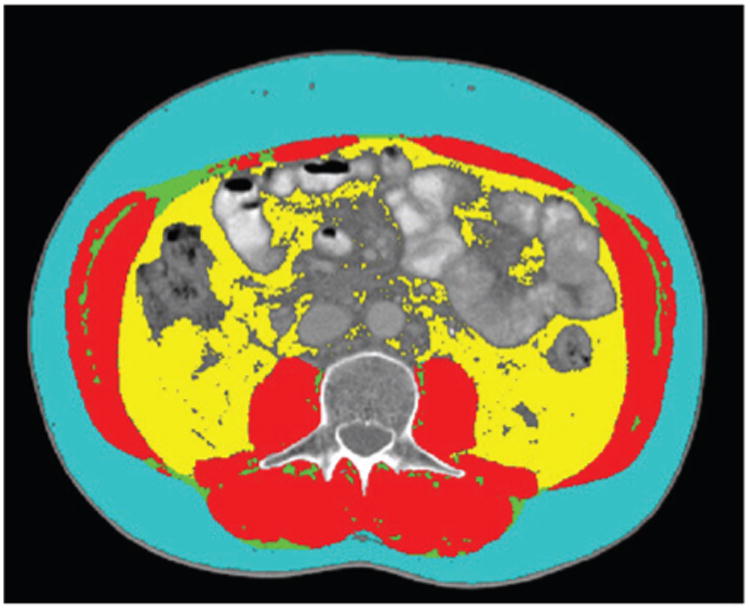
Representative patient showing transverse computed tomography image at the 3rd lumbar vertebrae demonstrating subcutaneous adipose tissue (light blue), abdominal skeletal muscle (red), intermuscular fat (green) and visceral fat (yellow).
Energy and Protein Estimations
Energy and protein needs were prescribed uniformly for all participants based on ICU protocol. Energy prescriptions were calculated using 30 kcal/kg admission or obesity-adjusted ideal body weight.27 Protein prescriptions were estimated using 1.2 g protein/kg ideal body weight for patients without obesity and using adjusted ideal body weight for patients with obesity (i.e. body mass index (BMI) > 30).27-29
Energy and Protein Received
The energy and protein intake from EN and PN were obtained from the nursing intake and output portion of the electronic medical record by trained study personnel. Data were only recorded for the days included in the CT1-CT2 interval. The energy and protein totals were tallied using the formula composition (i.e., grams of carbohydrate, protein, and fat/L) from the manufacturer and the volume received each day. The energy from PN was obtained from review of the medical record for the prescription ordered (% carbohydrate, protein, and fat) and the volume infused daily. Participants that receive propofol for sedation had the volume of lipid emulsion received with this medication recorded and included in their total daily energy intake (1.1 Kcal/cc). All energy provided via dextrose containing IV fluids was also recorded and included in daily energy intake totals. Oral dietary intake was obtained from daily calorie counts that were completed and recorded in the medical record for days of the CT1-CT2 interval by the hospital dietary assistants. As previously described the assistants obtain calorie counts using a multiple-pass 24-hour recall approach.30 Briefly, menus were saved for each meal and reviewed with the patient and/or family members each day. Patients were asked to recall everything they had consumed at each of the meals. Clarification was sought for of any food mentioned but not on the menu, or any food that was not listed but appeared on the menu. Foods consumed between meals were also recorded. Upon collection of daily oral intake the energy and protein content was calculated using the University of Minnesota Nutrient Data System for Research.
Demographics and Clinical Variables
Demographic and medical information including gender, race/ethnicity, age, diagnosis, clinical variables related to APACHE II calculations, and admission height and weight were collected from the electronic medical record. BMI was calculated based on admission weight (kg)/height (m)2. The APACHE II score recorded in the medical record at ICU admission were used to assess severity of illness.24 These scores range from 0 to 71, with higher scores indicating more severe illness.
Statistics
Descriptive statistics included mean and standard deviation for continuous variables and frequencies for categorical variables. Non-normally distributed variables were log transformed to achieve normality prior to analysis. Differences between the first and second CT scan for SKMT was assessed with paired t-tests. Separate multiple regression models were used to evaluate the influence of baseline characteristics (age, gender, APACHE II score, BMI), and the percentage of energy and protein needs received between CT1 and CT2 on the percentage change per day during this interval in SKM, IMAT, and VAT. A backward entrance procedure (p-entry = 0.15) was used to build parsimonious models for percentage changes/days between CT1 and CT2 in SKM, VAT, and IMAT. All P values are 2-sided and the statistical significance level was set at α = .05. All analyses were performed using SAS (version 9.2, 2009, SAS Institute Inc).
Results
Patient Characteristics
A total of 301 patients were screened; a total of 35 had their initial CT scan completed while in the ICU and met other inclusion criteria. Scans in 2 patients with anasarca were poor quality leaving 33 patients with complete data. Admission diagnoses included solid organ transplant (n = 6), respiratory failure (n = 11), sepsis (n = 5), acute abdomen (n = 4), cancer complication (n = 4), pancreatitis (n = 1), renal failure (n = 1), and stroke (n = 1). The overall demographic and nutrition profile are provided in Table 1. The average patient was 58 years, overweight using national cut points,31 had an APACHE II score of 26 and received 41% of energy (range 0-82%) and 57% (range 0-96%) of protein needs.
Table 1.
Demographic and Energy and Protein Intake of Participants.
| Variable | Mean (SD) |
|---|---|
| Age, yrs (mean, SD) | 59.7 (16) |
| Gender, n (%) | |
| Female | 13 (39) |
| Male | 20 (61) |
| Ethnicity, n (%) | |
| White | 13 (39.4) |
| Black | 12 (36.4) |
| Hispanic | 6 (18.2) |
| Other | 2 (6.1) |
| Weight, kg (SD) | 80.8 (20.0) |
| Height, cm (SD) | 171 (12.9) |
| BMI, (mean, SD) | 27.9 (6.1) |
| BMI < 30, n (%) | 20 (61) |
| BMI ≥ 30, n (%) | 13 (39) |
| APACHE II | 26 (7) |
| Estimated energy needs (kcals) | 2123 (422) |
| Estimated protein needs (gm) | 79 (15) |
| Energy needs received, % (SD) | 40.9 (25) |
| Protein needs received, % (SD) | 57.1 (37.6) |
The mean number (SD) of days between CT1 and CT2 was 9.97 days (4.7). Overall decline in SKM averaged 0.49%/day between CT1 and CT2 and trended significant in both men (P = .07) and women (P = .09) (Table 2). Gender-specific changes in SKM and fat depots were assessed due to the varying influence of hormones and protein synthesis rates.32-34 Subcutaneous fat measures could not be accurately assessed because these images were truncated for the majority of patients in 1 or both scans.
Table 2.
Mean (SD) and Adjusted Area for Body Depots at CT1 and CT2 (N = 33).
| Body depot | CT1 | CT2 | P Value |
|---|---|---|---|
| Skeletal muscle, cm2 | |||
| Overall, mean (SD) | 127.7 (40.0) | 119.7 (41.5) | |
| Women (n = 13) | 103.6 (21.3) | 92.2 (18.3) | .09 |
| Men (n = 20) | 143.4 (41.8) | 137.6 (42.9) | .07 |
| Visceral adipose tissue, cm2 | |||
| Overall, mean (SD) | 156.0 (117.1) | 154.6 (104.7) | |
| Women | 137.0 (134.7) | 135.1 (108.0) | .81 |
| Men | 168.4 (106.0) | 167.3 (103.3) | .87 |
| Intermuscular adipose tissue, cm2 | |||
| Overall, mean (SD) | 24.4 (16.9) | 23.5 (21.5) | |
| Women | 27.2 (15.0) | 25.6 (16.9) | .63 |
| Men | 22.6 (18.2) | 22.2 (24.3) | .90 |
In univariate regression the only significant predictor of the percentage change in SKM/days between CT scans was the percentage of energy needs received (β = 0.022, P = .03); the final multivariable regression model included males (β = 0.82, P = .09) and percentage of estimated energy provision (β = 0.024, P = .03) as independent variables, predicting 23% of the variation. The inclusion of age, race, gender APACHE score and percentage of protein needs received did not significantly change (> = 10%) the parameter estimate of percentage energy received to predict percentage change in SKM/day between CT scans.
Conversely, no single variables were significant predictors of percentage change in IMAT or VAT/days between CT scans in univariate analysis. Only APACHE II score was selected as an independent predictor of percentage change in VAT/days between CT scan; each 1-unit increase in the APACHE score was associated with a 0.93 greater percentage VAT loss/day between CT scans (β = −0.09, P = .08) and predicted 9% of its variation. No variables were selected in multiple regression of percentage change in IMAT/days between CT scan.
Discussion
Studies reporting changes in body composition in critically ill populations have been limited to a few observational studies conducted in laboratories that have the unique capacity to perform in vivo neutron activation or have a dual energy X-ray machine in proximity to their ICUs. To our knowledge no prospective randomized trials in hospitalized patients, including the recent large multicenter trials,35-37 have assessed the influence of nutrition support on changes in body composition and linked them to clinical outcomes. Mourtzakis et al.26 demonstrated whole-body lean mass (kg) (r = .94, P < .001) and fat mass (kg) (r = .88, P < .001) could be derived from abdominal CT scans obtained for diagnostic purposes that include the first through the fifth lumbar region. Scans in this region have been validated and used to quantify changes in LBM and adipose depots15-23 primarily in oncologic populations. We report here the use of this technique in medical and surgical ICU patients that required mechanical ventilation. Our participants received 41% of energy needs and 57% of protein needs between their first and second CT scan which were, on average, 10 days apart. During this interval they lost an average of 0.49% of their SKM in the L3 region/day. These findings are quite similar other studies that measured total protein loss with in vivo neutron activation in ICU patients. Streat et al.13 fed 8 ICU postoperative septic ICU patients an average of 2750 Kcals and 127 gm of protein/day via PN for 10 days and assessed changes in total body protein. Participants lost 12.5% body protein during this period (1.25% body protein/day). Plank and Hill9 investigated skeletal muscle losses in 30 critically ill patients (18 blunt trauma, 12 sepsis) receiving 1.3 times their measured energy needs via PN or EN over a 21-day period. Overall loss of total body protein ranged from 0.7-0.85%/day Ishibashi et al28 fed trauma patients (n = 10) EN and septic patients (n = 5) PN or EN. They received approximately 30 Kcals/Kg and 3 levels of protein intake were provided: 1.2 gm/Kg or 1.5 gm/Kg or 1.9 gm/Kg protein via during their first 2 weeks in the hospital. Total body protein losses were 1.7%/day with 1.2 gm protein/Kg/day, 0.5%/day with 1.5 gm of protein/Kg/day and 0.7%/day with 1.9 gm protein/day (P = .01). The percentage of estimated protein needs received in our patients did not influence change in SKM. This is not surprising given the inadequacy of both energy and protein intake. Mathur et al38 reported total body protein loss of 7.4% (0.52%/day) in 11 men that received no nutritional support over the first 2 weeks following radical cystectomy. These findings are quite similar to ours and may reflect the suboptimal nutrition received in both studies. Although the amount of skeletal or total protein loss varied between studies, an overall net loss of was found in all of the populations investigated which is consistent with the present study findings.
Very few studies have assessed changes in adipose tissue in ICU patients, and to our knowledge none have examined changes in specific body fat depots. We found on average participants lost 1% of visceral and 4% of intermuscular fat depots between CT1 and CT2 (not significant), despite receiving only 41% of estimated energy needs during this interval. Hart et al39 measured total body adipose tissue with DXA in adults with burn injuries that received nutrition support above energy needs assessed by indirect calorimetry. Overall fat mass increased and did not attenuate the loss of LBM, however, specific data on the percentage of change for these measures were not provided. Plank and Hill (described above)9 assessed fat depots with DXA measurements and found trauma patients (n = 18) lost 4% (P = .05) and septic patients (n = 12) lost 2% (P = .6). Knowledge of the important role adipose tissue plays in metabolic health in chronic disease has increased dramatically since by the landmark study by Hotamisligil et al which linked tumor necrosis factor-α arising from the adipose tissue of obese patients to heightened inflammation and insulin resistance.40 Recent findings on of morphologic changes that occur in adipose tissue of critically ill patients41,42 indicate a complicated and potentially protective role for these depots. Research that examines the influence of feeding on changes in body composition in different critically ill populations (eg, obese, malnourished, elderly, trauma, spinal cord injury, etc) are needed to discern the link between nutrition support, nutritional status, and clinical outcomes. The emerging area of CT imaging holds promise to provide at least some of this information.
We found the amount energy received significantly reduced SKM loss and did not influence fat depots in our participants. It should be noted these findings are associative and do not demonstrate causality. Furthermore, while they are similar to previous prospective cohort studies,13,43 our retrospective observational design, heterogeneity of our population, variation in the amount of energy received and number of days between the CT scans limits any further interpretation. Nonvolitional feedings with EN/PN are given under the assumption they will slow the loss of LBM which will improve outcomes. This assumption infers a causal relationship between poor nutritional status and outcomes. For malnutrition to be causally related to outcomes it must be demonstrated that (1) it independently worsens clinical outcomes (ie, it is not simply a marker of greater disease burden) and (2) correcting malnutrition independently results in improved clinical outcomes. The challenge exists because underlying disease severity and malnutrition interact in a way that improvement or deterioration in one influences the course of the other. This complex relationship makes separating their independent effects on outcomes difficult. Exploiting CT scans completed for diagnostic purposes begin to answer these questions that have plagued the field of clinical nutrition for decades. Prospective randomized feeding trials that include precise measures of change in nutritional status at set time points have the capacity to disentangle this complex relationship. The clinical availability of CT scans, coupled with improved techniques for localizing and minimizing the radiation exposure make their use in clinical trials eminently more feasible than they previously were.
This study has several limitations that need consideration. First, this was not a validation study as we did not compare results from the CT scans with another measure of body composition. The primary purpose of this investigation was to explore if validated methods that have been used to extrapolate CT images in other populations21,25,26 could be used in ICU patients. Several findings in our study support the accuracy of our CT scans for assessing LBM and adipose depots hospitalized critically ill patients. Specifically our baseline LBM and fat tissue measurements were very similar to values reported in the CT validation studies cited earlier. Also, the change in LBM and adipose depots between the CT intervals were similar to studies in ICU populations that assessed LBM with in vivo neutron activation and adipose tissue with DXA. Despite this agreement, validation studies are needed to confirm the accuracy of exploiting CT scans completed for diagnostic purposes in critically ill and other hospitalized populations. Second, estimates of whole body measures of LBM were extrapolated from a single-slice cross-sectional CT image at the L3 region. While this is an established method that has been validated26 it assumes a linear relationship between these components which may vary in critically ill individuals. Third, participants were limited to patients that had 2 or more CTs that include the first to fifth lumbar region while hospitalized, thus broad generalizability to the entire ICU populations are not possible. Finally the number of days between scans was variable and did not encompass their entire hospital or ICU stay for each participant, which limits the ability to precisely link these changes to outcomes.
Conclusions
We have demonstrated the ability to exploit CT scans completed for diagnostic purposes in hospitalized patients that required mechanical ventilation to assess changes in LBM and adipose depots. These findings offer the promise for broader use in clinical feeding trails that will enable detection of the causal link between nutritional support, changes in body composition, and clinical outcomes.
Acknowledgments
Financial disclosures: This work was supported by a grant from the National Heart, Lung and Blood Institute, National Institutes of Health (R01HL093142-01S109).
References
- 1.Studley HO. Percentage of weight loss: a basic indicator of surgical risk in patients with chronic peptic ulcer. 1936. Nutr Hosp. 2001;16(4):141–143. discussion 140-141. [PubMed] [Google Scholar]
- 2.Giner M, Laviano A, Meguid MM, Gleason JR. In 1995 a correlation between malnutrition and poor outcome in critically ill patients still exists. Nutrition. 1996;12(1):23–29. doi: 10.1016/0899-9007(95)00015-1. [DOI] [PubMed] [Google Scholar]
- 3.Sriram K, Mizock BA. Critical care nutrition: are the skeletons still in the closet? Crit Care Med. 2010;38(2):690–691. doi: 10.1097/CCM.0b013e3181c58660. [DOI] [PubMed] [Google Scholar]
- 4.Heyland DK, Dhaliwal R, Drover JW, Gramlich L, Dodek P. Canadian clinical practice guidelines for nutrition support in mechanically ventilated, critically ill adult patients. JPEN J Parenter Enteral Nutr. 2003;27(5):355–373. doi: 10.1177/0148607103027005355. [DOI] [PubMed] [Google Scholar]
- 5.Gramlich L, Kichian K, Pinilla J, Rodych NJ, Dhaliwal R, Heyland DK. Does enteral nutrition compared to parenteral nutrition result in better outcomes in critically ill adult patients? A systematic review of the literature. Nutrition. 2004;20(10):843–848. doi: 10.1016/j.nut.2004.06.003. [DOI] [PubMed] [Google Scholar]
- 6.Preiser JC, Berre J, Carpentier Y, et al. Management of nutrition in European intensive care units: results of a questionnaire. Working Group on Metabolism and Nutrition of the European Society of Intensive Care Medicine. Intensive Care Med. 1999;25(1):95–101. doi: 10.1007/s001340050793. [DOI] [PubMed] [Google Scholar]
- 7.Skipper A, Ferguson M, Thompson K, Castellanos VH, Porcari J. Nutrition screening tools: an analysis of the evidence. JPEN J Parenter Enteral Nutr. 2012;36(3):292–298. doi: 10.1177/0148607111414023. [DOI] [PubMed] [Google Scholar]
- 8.Gabay C, Kushner I. Acute-phase proteins and other systemic responses to inflammation. N Engl J Med. 1999;340(6):448–454. doi: 10.1056/NEJM199902113400607. [DOI] [PubMed] [Google Scholar]
- 9.Plank LD, Hill GL. Similarity of changes in body composition in intensive care patients following severe sepsis or major blunt injury. Ann N Y Acad Sci. 2000;904:592–602. doi: 10.1111/j.1749-6632.2000.tb06521.x. [DOI] [PubMed] [Google Scholar]
- 10.Mitra S, Plank LD, Hill GL. Calibration of a prompt gamma in vivo neutron activation facility for direct measurement of total body protein in intensive care patients. Phys Med Biol. 1993;38(12):1971–1975. doi: 10.1088/0031-9155/38/12/019. [DOI] [PubMed] [Google Scholar]
- 11.Hill AA, Plank LD, Finn PJ, et al. Massive nitrogen loss in critical surgical illness: effect on cardiac mass and function. Ann Surg. 1997;226(2):191–197. doi: 10.1097/00000658-199708000-00011. [DOI] [PMC free article] [PubMed] [Google Scholar]
- 12.Plank LD, Connolly AB, Hill GL. Sequential changes in the metabolic response in severely septic patients during the first 23 days after the onset of peritonitis. Ann Surg. 1998;228(2):146–158. doi: 10.1097/00000658-199808000-00002. [DOI] [PMC free article] [PubMed] [Google Scholar]
- 13.Streat SJ, Beddoe AH, Hill GL. Aggressive nutritional support does not prevent protein loss despite fat gain in septic intensive care patients. J Trauma. 1987;27(3):262–266. doi: 10.1097/00005373-198703000-00006. [DOI] [PubMed] [Google Scholar]
- 14.Gamrin L, Andersson K, Hultman E, Nilsson E, Essen P, Wernerman J. Longitudinal changes of biochemical parameters in muscle during critical illness. Metabolism. 1997;46(7):756–762. doi: 10.1016/s0026-0495(97)90119-0. [DOI] [PubMed] [Google Scholar]
- 15.Kanaya AM, Lindquist K, Harris TB, et al. Total and regional adiposity and cognitive change in older adults: The Health, Aging and Body Composition (ABC) study. Arch Neurol. 2009;66(3):329–335. doi: 10.1001/archneurol.2008.570. [DOI] [PMC free article] [PubMed] [Google Scholar]
- 16.Kuk JL, Church TS, Blair SN, Ross R. Measurement site and the association between visceral and abdominal subcutaneous adipose tissue with metabolic risk in women. Obesity (Silver Spring) 2010;18(7):1336–1340. doi: 10.1038/oby.2009.414. [DOI] [PubMed] [Google Scholar]
- 17.McTiernan A, Sorensen B, Irwin ML, et al. Exercise effect on weight and body fat in men and women. Obesity (Silver Spring) 2007;15(6):1496–1512. doi: 10.1038/oby.2007.178. [DOI] [PubMed] [Google Scholar]
- 18.Montano-Loza AJ, Meza-Junco J, Prado CM, et al. Muscle wasting is associated with mortality in patients with cirrhosis. Clin Gastroenterol Hepatol. 2012;10(2):166–173. doi: 10.1016/j.cgh.2011.08.028. [DOI] [PubMed] [Google Scholar]
- 19.Baracos VE, Reiman T, Mourtzakis M, Gioulbasanis I, Antoun S. Body composition in patients with non-small cell lung cancer: a contemporary view of cancer cachexia with the use of computed tomography image analysis. Am J Clin Nutr. 2010;91(4):1133S–1137S. doi: 10.3945/ajcn.2010.28608C. [DOI] [PubMed] [Google Scholar]
- 20.Prado CM, Lieffers JR, McCargar LJ, et al. Prevalence and clinical implications of sarcopenic obesity in patients with solid tumours of the respiratory and gastrointestinal tracts: a population-based study. Lancet Oncol. 2008;9(7):629–635. doi: 10.1016/S1470-2045(08)70153-0. [DOI] [PubMed] [Google Scholar]
- 21.Shen W, Punyanitya M, Wang Z, et al. Total body skeletal muscle and adipose tissue volumes: estimation from a single abdominal cross-sectional image. J Appl Physiol. 2004;97(6):2333–2338. doi: 10.1152/japplphysiol.00744.2004. [DOI] [PubMed] [Google Scholar]
- 22.Tan BH, Birdsell LA, Martin L, Baracos VE, Fearon KC. Sarcopenia in an overweight or obese patient is an adverse prognostic factor in pancreatic cancer. Clin Cancer Res. 2009;15(22):6973–6979. doi: 10.1158/1078-0432.CCR-09-1525. [DOI] [PubMed] [Google Scholar]
- 23.Brown TT, Xu X, John M, et al. Fat distribution and longitudinal anthropometric changes in HIV-infected men with and without clinical evidence of lipodystrophy and HIV-uninfected controls: a substudy of the Multicenter AIDS Cohort Study. AIDS Res Ther. 2009;6:8. doi: 10.1186/1742-6405-6-8. [DOI] [PMC free article] [PubMed] [Google Scholar]
- 24.Knaus WA, Draper EA, Wagner DP, Zimmerman JE. APACHE II: a severity of disease classification system. Crit Care Med. 1985;13(10):818–829. [PubMed] [Google Scholar]
- 25.Shen W, Punyanitya M, Wang Z, et al. Visceral adipose tissue: relations between single-slice areas and total volume. Am J Clin Nutr. 2004;80(2):271–278. doi: 10.1093/ajcn/80.2.271. [DOI] [PMC free article] [PubMed] [Google Scholar]
- 26.Mourtzakis M, Prado CM, Lieffers JR, Reiman T, McCargar LJ, Baracos VE. A practical and precise approach to quantification of body composition in cancer patients using computed tomography images acquired during routine care. Appl Physiol Nutr Metab. 2008;33(5):997–1006. doi: 10.1139/H08-075. [DOI] [PubMed] [Google Scholar]
- 27.Krenitsky J. Adjusted body weight, pro: evidence to support the use of adjusted body weight in calculating calorie requirements. Nutr Clin Pract. 2005;20(4):468–473. doi: 10.1177/0115426505020004468. [DOI] [PubMed] [Google Scholar]
- 28.Ishibashi N, Plank LD, Sando K, Hill GL. Optimal protein requirements during the first 2 weeks after the onset of critical illness. Crit Care Med. 1998;26(9):1529–1535. doi: 10.1097/00003246-199809000-00020. [DOI] [PubMed] [Google Scholar]
- 29.Shaw JH, Wildbore M, Wolfe RR. Whole body protein kinetics in severely septic patients. The response to glucose infusion and total parenteral nutrition. Ann Surg. 1987;205(3):288–294. doi: 10.1097/00000658-198703000-00012. [DOI] [PMC free article] [PubMed] [Google Scholar]
- 30.Peterson SJ, Tsai AA, Scala CM, Sowa DC, Sheean PM, Braunschweig CL. Adequacy of oral intake in critically ill patients 1 week after extubation. J Am Diet Assoc. 2010;110(3):427–433. doi: 10.1016/j.jada.2009.11.020. [DOI] [PubMed] [Google Scholar]
- 31.Executive summary of the clinical guidelines on the identification, evaluation, and treatment of overweight and obesity in adults. Arch Intern Med. 1998;158(17):1855–1867. doi: 10.1001/archinte.158.17.1855. [DOI] [PubMed] [Google Scholar]
- 32.Sharshar T, Bastuji-Garin S, Polito A, et al. Hormonal status in protracted critical illness and in-hospital mortality. Crit Care. 2011;15(1):R47. doi: 10.1186/cc10010. [DOI] [PMC free article] [PubMed] [Google Scholar]
- 33.Lemoine JK, Haus JM, Trappe SW, Trappe TA. Muscle proteins during 60-day bedrest in women: impact of exercise or nutrition. Muscle Nerve. 2009;39(4):463–471. doi: 10.1002/mus.21189. [DOI] [PubMed] [Google Scholar]
- 34.Mauras N, Hayes V, Welch S, et al. Testosterone deficiency in young men: marked alterations in whole body protein kinetics, strength, and adiposity. J Clin Endocrinol Metab. 1998;83(6):1886–1892. doi: 10.1210/jcem.83.6.4892. [DOI] [PubMed] [Google Scholar]
- 35.Rice TW, Wheeler AP, Thompson BT, et al. Initial trophic vs full enteral feeding in patients with acute lung injury: the EDEN randomized trial. JAMA. 2012;307(8):795–803. doi: 10.1001/jama.2012.137. [DOI] [PMC free article] [PubMed] [Google Scholar]
- 36.Doig GS, Simpson F, Sweetman EA, et al. Early parenteral nutrition in critically ill patients with short-term relative contraindications to early enteral nutrition: a randomized controlled trial. JAMA. 2013;309(20):2130–2138. doi: 10.1001/jama.2013.5124. [DOI] [PubMed] [Google Scholar]
- 37.Casaer MP, Mesotten D, Hermans G, et al. Early versus late parenteral nutrition in critically ill adults. N Engl J Med. 2011;365(6):506–517. doi: 10.1056/NEJMoa1102662. [DOI] [PubMed] [Google Scholar]
- 38.Mathur S, Plank LD, Hill AG, Rice MA, Hill GL. Changes in body composition, muscle function and energy expenditure after radical cystectomy. BJU Int. 2008;101(8):973–977. doi: 10.1111/j.1464-410X.2007.07337.x. discussion 977. [DOI] [PubMed] [Google Scholar]
- 39.Hart DW, Wolf SE, Herndon DN, et al. Energy expenditure and caloric balance after burn: increased feeding leads to fat rather than lean mass accretion. Ann Surg. 2002;235(1):152–161. doi: 10.1097/00000658-200201000-00020. [DOI] [PMC free article] [PubMed] [Google Scholar]
- 40.Hotamisligil GS, Shargill NS, Spiegelman BM. Adipose expression of tumor necrosis factor-alpha: direct role in obesity-linked insulin resistance. Science. 1993;259(5091):87–91. doi: 10.1126/science.7678183. [DOI] [PubMed] [Google Scholar]
- 41.Langouche L, Perre SV, Thiessen S, et al. Alterations in adipose tissue during critical illness: An adaptive and protective response? Am J Respir Crit Care Med. 2010;182(4):507–516. doi: 10.1164/rccm.200909-1395OC. [DOI] [PubMed] [Google Scholar]
- 42.Langouche L, Marques MB, Ingels C, et al. Critical illness induces alternative activation of M2 macrophages in adipose tissue. Crit Care. 2011;15(5):R245. doi: 10.1186/cc10503. [DOI] [PMC free article] [PubMed] [Google Scholar]
- 43.Plank LD, Hill GL. Sequential metabolic changes following induction of systemic inflammatory response in patients with severe sepsis or major blunt trauma. World J Surg. 2000;24(6):630–638. doi: 10.1007/s002689910104. [DOI] [PubMed] [Google Scholar]