

Abstract
Biomaterials for orthopedic tissue engineering must balance mechanical and bioactivity concerns. This work describes the fabrication of a homologous series of anisotropic collagen–GAG (CG) scaffolds with aligned tracks of ellipsoidal pores but increasing relative densities (ρ*/ρs), and we report the role scaffold relative density plays in directing tenocyte bioactivity. Scaffold permeability and mechanical properties, both in tension and compression, were significantly influenced by relative density in a manner predicted by cellular solids models. Equine tenocytes showed greater levels of attachment, metabolic activity, soluble collagen synthesis, and alignment as well as less cell-mediated scaffold contraction in anisotropic CG scaffolds of increasing relative density. Notably, the lowest density scaffolds experienced significant cell-mediated contraction with associated decreases in tenocyte number as well as loss of microstructural integrity, aligned contact guidance cues, and preferential tenocyte orientation over a 14 day culture period. Gene expression analyses suggested tenocyte de-differentiation in the lowest density scaffold while indicating that the highest density scaffold supported significant increases in COMP (4-fold), tenascin-C (3-fold), and scleraxis (15-fold) expression as well as significant decreases in MMP-1 (9-fold) and MMP-13 (13-fold) expression on day 14. These results suggest that anisotropic scaffold relative density can help to modulate the maintenance of a more tendon-like microenvironment and aid long-term tenocyte transcriptomic stability. Overall, this work demonstrates that relative density is a critical scaffold parameter, not only for insuring mechanical competence, but also for directing cell transcriptomic stability and behavior.
Keywords: Relative density, Collagen, Scaffold, Tendon, Gene expression
1. Introduction
Collagen–glycosaminoglycan (CG) scaffolds have been fabricated for a variety of regenerative medicine application including dermis, peripheral nerves, cartilage (Harley et al., 2004; Yannas, 2001; Yannas et al., 1989), and most recently tendon (Caliari and Harley, 2011; Caliari et al., 2011). CG scaffolds are fabricated by freeze-drying a suspension of collagen and glycosaminoglycans (GAGs), resulting in a highly porous (>99%) sponge-like material with interconnected pores defined by CG fibers, termed struts. However, these scaffolds are typically fabricated at extremely low relative densities (ρ*/ρs), the ratio of the scaffold density (ρ*) to the density of the solid from which the scaffold material is composed (ρs). Scaffolds with low ρ*/ρs typically present reduced mechanical properties not suitable for orthopedic tissues such as tendon, though recent work has incorporated high-density CG membranes into a low density CG scaffold in order to improve scaffold mechanical performance (Caliari et al., 2011). Previous work with CG scaffolds has demonstrated that these materials can be fabricated with relative densities as high as 0.18 (82% porosity) using techniques such as plasticating extrusion (Harley et al., 2004) and vacuum filtration (Kanungo and Gibson, 2009, 2010), but comprehensive analyses of the specific impact of scaffold relative density on cell bioactivity are still needed. Scaffold relative density is likely a critical biomaterial parameter due to its significant effect on construct mechanics, permeability, specific surface area, and potential for steric hindrances to cell motility among other key properties (Istrate and Chen, 2011; Kanungo and Gibson, 2009, 2010). However, the effect of relative density on the properties of anisotropic biomaterials for tendon tissue engineering is unknown.
Musculoskeletal injuries account for over 100 million office visits per year (Mishra et al., 2009) with about half of these injuries involving soft tissues such as tendons and ligaments (James et al., 2008). Tendon injuries affect people from all walks of life from the elderly to elite athletes with substantial costs accrued, both financial ($30 billion annually in the US alone (Butler et al., 2008)) and quality-of-life related. While progress has been made in the development of biomaterials for tendon tissue engineering (Doroski et al., 2010; Juncosa-Melvin et al., 2007; Li et al., 2009; Moffat et al., 2009; Sahoo et al., 2010), there is a critical need for improved, innovative strategies. We have recently developed a fabrication method to create anisotropic CG scaffolds comprised of aligned tracks of ellipsoidal pores (Caliari and Harley, 2011) and to integrate a CG membrane to create CG scaffold-membrane core–shell composites for increased mechanical competence (Caliari et al., 2011). While scaffold-membrane composites show improved mechanical competence, the scaffold core used for this work had a relative density of ~0.5%. This is the typical relative density for many previous applications of CG scaffolds for soft tissue repair, but is not suitable for tendon repair due to its inability to withstand tenocyte-mediated contraction (Caliari and Harley, 2011; Torres et al., 2000), making it prudent to examine the effect of anisotropic scaffold relative density on tenocyte bioactivity.
This manuscript describes the microstructural, mechanical, and biophysical properties of a homologous series of anisotropic CG scaffolds with increasing relative density. While increasing relative density was hypothesized to decrease construct permeability, it was also hypothesized to increase mechanical properties and ability to withstand tenocyte-mediated contraction, thereby preserving the anisotropic contact guidance cues provided by the scaffold microstructure. Furthermore, it was hypothesized that the more dense anisotropic CG scaffolds would foster a more tendon-like microenvironment for tenocytes, resulting in elevated gene expression of tendon extracellular matrix (ECM) markers such as collagen I and cartilage oligomeric matrix protein (COMP) as well as tendon phenotypic markers including scleraxis and tenascin-C. While the effects of relative density on CG scaffold mechanical properties and early cell attachment have previously been elucidated (Kanungo and Gibson, 2009, 2010), its effects on permeability, gene expression, long-term cell viability and its role in the functionality of anisotropic biomaterials for tendon tissue engineering have not been rigorously examined.
2. Materials and methods
2.1. Anisotropic CG scaffold fabrication and crosslinking
2.1.1. CG suspension preparation
CG suspension was produced from a homogenized blend of type I microfibrillar collagen from bovine tendon (Sigma-Aldrich, St. Louis, MO) and chondroitin sulfate from shark cartilage (Sigma-Aldrich, St. Louis, MO) in 0.05 M acetic acid (Caliari and Harley, 2011; O’Brien et al., 2004; Yannas et al., 1989). Suspensions of three different collagen concentrations were made: 0.5 w/v% (1×), 1.0 w/v% (2×), and 1.5 w/v% (3×). The ratio of collagen to GAG (11.25:1) was kept constant for all suspension variants (Yannas et al., 1989).
2.1.2. Anisotropic CG scaffold fabrication via freeze-drying
Scaffolds were fabricated via directional solidification as previously described (Caliari and Harley, 2011). Briefly, the CG suspension was pipetted into individual wells (6–12 mm diameter, 15–30 mm deep) within a 5 × 5 in polytetrafluoroethylene (PTFE)-copper mold and placed on a precooled (−10 °C) freeze-dryer shelf (VirTis, Gardiner, NY) (Fig. 1(a)). The mismatch in thermal conductivity between the PTFE mold body and the copper bottom (kCu/kPTFE ~ 1600) promoted unidirectional heat transfer through the more conductive copper (Caliari and Harley, 2011). The CG suspension was frozen at −10 °C for 2 h and then sublimated at 0 °C and 200 mTorr to remove ice crystals, resulting in dry, porous CG material.
Fig. 1.
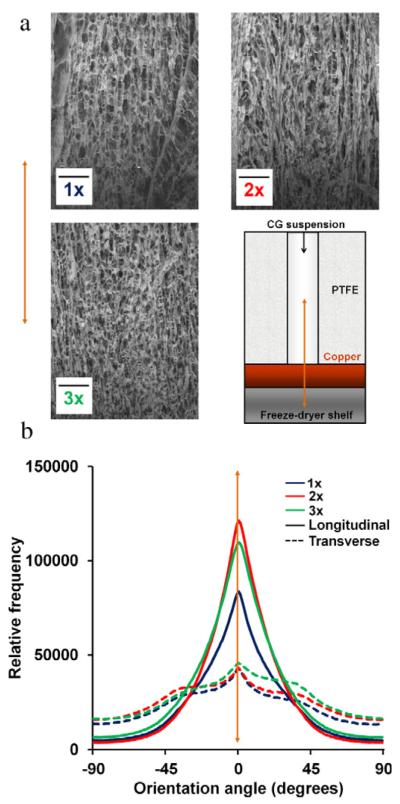
Fabrication of anisotropic CG scaffolds via directional solidification. (a) SEM images of scaffold microstructure in longitudinal plane. Top left: 1×, Top right: 2×, and Bottom left: 3× scaffold variants. Bottom right: schematic of PTFE-copper freeze-drying mold (Caliari and Harley, 2011). Orange arrow: direction of heat transfer and pore alignment. Scale bars: 500 μm. (b) Histogram of scaffold pore alignment angles for the transverse (dotted lines) and longitudinal (solid lines) planes of the anisotropic scaffolds. (For interpretation of the references to colour in this figure legend, the reader is referred to the web version of this article.)
2.1.3. Anisotropic CG scaffold crosslinking
Following lyophilization, all scaffolds were dehydrothermally crosslinked at 105 °C for 24 h under vacuum (<25 torr) in a vacuum oven (Welch, Niles, IL). Prior to use scaffolds were hydrated via immersion in 100% ethanol for 2–3 h followed by sequential phosphate-buffered saline (PBS) washes over the next 24 h. To further improve mechanical strength, scaffolds were crosslinked further using carbodiimide chemistry in a solution of 1-ethyl-3-[3-dimethylaminopropyl] carbodiimide hydrochloride (EDAC, Sigma-Aldrich, St. Louis, MO) and N-hydroxysulfosuccinimide (NHS, Sigma-Aldrich) at a molar ratio of 5:2:1 EDAC:NHS:COOH (Harley et al., 2007b; Olde Damink et al., 1996) for 1 h at 37 °C. Scaffolds were then rinsed in PBS under shaking and stored in fresh PBS until use.
2.2. SEM analysis
Scaffold microstructural architecture was analyzed using scanning electron microscopy (SEM). SEM was performed using a JEOL JSM-6060LV Low Vacuum Scanning Electron Microscope (JEOL USA, Peabody, MA). The SEM was equipped with both a secondary electron (SE) detector and a backscatter electron (BSE) detector, allowing scaffolds to be visualized under low vacuum without a conductive coating (Harley et al., 2010).
2.3. Determination of scaffold relative density
Scaffold relative density (ρ*/ρs) was calculated by dividing the dry scaffold density (ρ*) by the known density of collagen (ρs, 1.3 g cm−3) (Caliari and Harley, 2011; Harley et al., 2007b; Yannas and Tobolsky, 1967). Dry scaffold density was determined by weighing individual dry scaffolds (12 mm diameter, 15 mm height) and dividing by the scaffold volume.
2.4. Quantitative microstructural analysis
Microstructural features of the series of aligned CG scaffolds were quantitatively assessed using previously described stereology methods (Caliari and Harley, 2011; O’Brien et al., 2004). Briefly, cylindrical CG scaffolds generated in individual wells of the composite PTFE-copper mold (8 mm diameter by 15 mm length) were cut into three 5 mm sections: bottom (closest to freeze-dryer shelf), middle, and top. Both longitudinally and transversely oriented scaffold sections from each region were embedded in glycolmethacrylate (Polysciences, Warrington, PA) and serially sectioned (5 μm) on a microtome (Leica Microsystems, Germany). Scaffold sections were mounted on slides and stained with aniline blue (Fisher, Pittsburgh, PA) to enable visualization of CG solid content (Caliari and Harley, 2011; O’Brien et al., 2004). A total of 36 sections (18 longitudinal, 18 transverse) were analyzed for each relative density. Stained sections were visualized on an optical microscope (Leica Microsystems, Germany) and analyzed using a linear intercept macro in Scion Image. The macro outputs fitting parameters were used to calculate pore diameter (d) and aspect ratio (AR) (Caliari and Harley, 2011; O’Brien et al., 2004).
2.5. Permeability analysis
The permeability of scaffold specimens (12 mm diameter, 10 mm height) at distinct levels of applied compressive strain was measured using a two-piece polycarbonate rig with interchangeable gaskets and spacers modified from O’Brien et al. (2007). Polycarbonate spacers having a height of 10.5 mm, 3.5 mm, and 2.2 mm were used ensure uniform specimen compression to 0%, 65%, and 78% strain, respectively. Fluid flow rate through the scaffold under a constant hydraulic pressure head (1.2 in.) was measured for each scaffold (n = 3) at each strain level. Cross-sectional flow area was determined by dying the scaffold and monitoring the resulting decrease in dye intensity due to flow through. Permeability was calculated for each scaffold using Darcy’s Law (O’Brien et al., 2007):
where K is the permeability, Q is the flow rate, V is the volume of water measured over a period of time t, l is the height of the scaffold under compression, μ is the viscosity of water, ΔP is the applied pressure, and A is the cross-sectional area of flow.
2.6. Mechanical testing
Compression tests were performed on CG scaffold specimens (12 mm diameter, 15 mm height) while tensile tests used scaffolds 6 mm diameter and 30 mm length (Caliari et al., 2011). Choice of sample geometry was dictated by the size of the scaffolds that will be deployed in future in vivo models. Compressive and tensile tests were performed in a manner consistent with previous mechanical analysis of CG scaffolds (Caliari et al., 2011; Harley et al., 2007b). All specimens tested were dry unless otherwise stated. Scaffolds were loaded to failure at a rate of 1 mm/min using an MTS Instron 2 (Eden Prairie, MN). Elastic modulus was calculated from the slope of the stress–strain curve over a strain range of 5%–10% (Caliari et al., 2011; Gibson et al., 2010; Harley et al., 2007b). Ultimate tensile strength was determined from the peak stress value on the stress–strain curve while elastic compressive strength was calculated from the stress value where the linear elastic region ended.
2.7. Cell culture
2.7.1. Tenocyte isolation and culture
Equine tenocytes were isolated from horses aged 2–3 years euthanized for reasons not related to tendinopathy in a manner consistent with protocols approved by the University of Illinois IACUC (Caliari and Harley, 2011). Digital flexor tendons were extracted, diced, and incubated in a collagenase solution at 37 °C under constant shaking. Digest solution was filtered (40 μm pore size) to isolate tenocytes (Kapoor et al., 2010). Tenocytes were plated at a density of 1 × 10⁴ cells per cm2 and cultured in standard culture flasks in high glucose Dulbecco’s modified Eagle’s medium (DMEM, Fisher, Pittsburgh, PA) supplemented with 10% fetal bovine serum (FBS, Invitrogen, Carlsbad, CA), 1% L-glutamine (Invitrogen, Carlsbad, CA), 1% penicillin/streptomycin (Invitrogen, Carlsbad, CA), 1% amphotericin-B (MP Biomedical, Solon, OH), and 25 μg/mL ascorbic acid (Wako, Richmond, VA) (Kapoor et al., 2010). Cells were fed every 3 days and cultured to confluence at 37 °C and 5% CO2. Cells were used at passage 3.
2.7.2. Scaffold culture conditions
Cylindrical CG scaffold plugs (8 mm diameter, ~5 mm thickness) were cut from the middle section of full length 15 mm scaffolds and were placed in ultra-low attachment 6-well plates (Corning Life Sciences, Lowell, MA). Confluent tenocytes were trypsinized and resuspended at a concentration of 5 × 10⁵ cells per 20 μL media. Scaffolds were seeded with tenocytes using a previously validated method (Caliari and Harley, 2011; O’Brien et al., 2005). 10 μL of cell suspension (2.5 × 10⁵ cells) was added to each scaffold. The scaffolds were then incubated at 37 °C for 15 min, turned over, and seeded with an additional 10 μL of cell suspension for a total of 5 × 10⁵ cells seeded per scaffold. Scaffolds were incubated at 37 °C and 5% CO2 and fed with complete DMEM every 3 days for the duration of all experiments (Caliari and Harley, 2011).
2.8. Quantification of cell number
Cell attachment was assayed via DNA quantification (Caliari and Harley, 2011). Scaffolds were washed in PBS to remove unattached and dead cells and then placed in a papain solution at 60 °C for 24 h to both digest the scaffold and lyse the cells to expose their DNA. Hoechst 33258 dye (Invitrogen, Carlsbad, CA) was used to fluorescently label double-stranded DNA (Kim et al., 1988). Fluorescence was read (excitation: 360 nm, emission: 465 nm) via a fluorescent spectrophotometer (Tecan, Switzerland). Experimental readings were compared to a standard curve for a range of known cell numbers to calculate cell attachment as a percentage of the total number of seeded cells (Kim et al., 1988).
2.9. Quantification of cell metabolic activity
Tenocyte mitochondrial metabolic activity within each scaffold was determined through a non-destructive alamarBlue® assay (Caliari and Harley, 2011). Healthy, viable cells continuously convert the active ingredient in alamarBlue® (resazurin) to a fluorescent byproduct (resorufin), allowing comparison of the gross metabolic activity of each cell-seeded construct. Cell-seeded scaffolds were incubated at 37 °C in 1× alamarBlue (Invitrogen, Carlsbad, CA) solution with gentle shaking for 2 h (Tierney et al., 2009). Resorufin fluorescence was measured (excitation: 540 nm, emission: 590 nm) via a fluorescent spectrophotometer (Tecan, Switzerland). Relative cell metabolic activity was determined from a standard curve created from known cell numbers and reported as a percentage of the total number of seeded cells (Tierney et al., 2009).
2.10. Measurement of cell-mediated scaffold contraction
The diameter of each scaffold disk was measured at days 1, 4, 7, and 14 using standard drafting templates and normalized against scaffold diameter at time 0 to determine cell-mediated scaffold contraction (Caliari and Harley, 2011; Spilker et al., 2001).
2.11. Measurement of soluble collagen synthesis
Total soluble collagen released into the culture media was measured using a Sircol soluble collagen kit (Biocolor Ltd, UK) (Sahoo et al., 2010). Total soluble collagen synthesis from days 1–7 and days 8–14 was quantified by pooling media samples from each feeding time point. Media samples were concentrated overnight in polyethylene glycol to isolate collagen. Serum components of the media were separated from the soluble collagen using a 48 h pepsin/acetic acid digest followed by centrifugal filtration (filter size: 100 kDa) (Lareu et al., 2010). The retentate was recovered and incubated with Sirius Red dye for 30 min under shaking. The dyed collagen pellet was recovered, washed, and resuspended in an alkali solution provided with the kit. Sample absorbance was measured at 555 nm; results were interpolated on standard curve created using bovine collagen stock solution (0.5 mg/mL).
2.12. RNA isolation and real-time PCR
RNA was extracted from scaffolds via an RNeasy Plant Mini kit (Qiagen, Valencia, CA) as previously described (Duffy et al., 2011). Scaffolds were immersed in lysis solution supplemented with 10 μM β-mercaptoethanol for 5 min on ice. The lysates were processed following the kit instructions to isolate RNA. RNA was reverse transcribed to cDNA in a Bio-Rad S1000 thermal cycler using the QuantiTect Reverse Transcription kit (Qiagen, Valencia, CA). Real-time PCR reactions were performed in triplicate using the QuantiTect SYBR Green PCR (Qiagen, Valencia, CA) kit and 10 ng of cDNA per reaction in an Applied Biosystems 7900HT Fast Real-Time PCR System (Carlsbad, CA). All primer sequences were derived from literature and gene specificity was confirmed using BLAST searches (Garvican et al., 2008; Taylor et al., 2009). Primers were synthesized by Integrated DNA Technologies (Coralville, IA). Expression of the following markers was quantified: collagen type I alpha 2 (COL1A2), collagen type III alpha I (COL3A1), cartilage oligomeric matrix protein (COMP), decorin (DCN), scleraxis (SCX), tenascin-C (TNC), and matrix metalloproteinases 1, 3, and 13 (MMP1, MMP3, MMP13). Glyceraldehyde 3-phosphate dehydrogenase (GAPDH) was used as a housekeeping gene. Data was analyzed using Sequence Detection Systems software v2.4 (Applied Biosystems, Carlsbad, CA) Results were generated using the delta–delta Ct method and all results were expressed as fold changes normalized to the expression levels of tenocytes at day 0 in 2D culture prior to seeding on scaffolds.
2.13. Histology and immunohistochemistry
Scaffold specimens were retrieved at days 7 and 14 of culture and then fixed in 10% neutral buffered formalin for histological analysis. Two scaffolds per experimental group were embedded in paraffin and sequentially sliced (one through the longitudinal plane, one through the transverse plane per group) into 5 μm thick sections. Sections were stained with hematoxylin and eosin (H&E) to allow visualization of cells (purple) and scaffold struts (pink).
2.14. Quantitative assessment of scaffold strut and cell alignment
Scaffold pore alignment as well as alignment of tenocytes within scaffolds was determined with the OrientationJ plugin for Image J using previously described methods (Caliari and Harley, 2011; Fonck et al., 2009). Scaffold strut alignment was measured from SEM images using the Distribution function within OrientationJ; 30× images taken in the longitudinal and transverse planes of bottom, middle, and top regions of the scaffold were analyzed for each relative density (three scaffolds, nine total images for each plane). Cell alignment within the scaffolds after 7 and 14 days in culture was measured from 10× images of H&E stained histology sections (Caliari and Harley, 2011). The orientation angles of 450 cells from nine distinct scaffold regions per scaffold variant were quantified for each sample using the Measure function. Strut and cell alignment at each time point was reported as a histogram of orientation angles (−90°– + 90°) with bin intervals of 10° for specimens taken from the longitudinal planes (with 0° corresponding to the direction of alignment in longitudinal sections).
2.15. Statistical analysis
One-way analysis of variance (ANOVA) was performed on pore size and shape data while two-way ANOVAs (independent factors: time, relative density) were applied to cell metabolic activity, cell number, scaffold diameter, soluble collagen, and gene expression data sets followed by Tukey-HSD post-hoc tests. Significance was set at p < 0.05. At least n = 11 scaffolds were analyzed at each time point for cell metabolic activity and scaffold diameter while n = 6 scaffolds were digested and assayed at each time point for cell number. Pore size and shape analysis was performed on transverse (n = 3) and longitudinal (n = 3) scaffold sections. Gene expression was analyzed for n = 3 scaffolds at each time point. Error was reported in figures as the standard error of the mean unless otherwise noted.
3. Results
3.1. Pore size and shape analysis
Qualitative SEM and quantitative analysis of pore anisotropy showed that scaffolds with aligned, ellipsoidal pores could be fabricated for all three scaffold relative densities (Fig. 1). These results show that overall pore alignment was not influenced by scaffold relative density. Notably, no significant differences (p > 0.05) in pore size or aspect ratio were observed through the height of the scaffold (top, middle, bottom sections) within any of the scaffold variants (1×, 2×, 3×), consistent with previously published results for a homologous series of 1× scaffolds showing no significant influence of vertical position in the scaffold on mean pore size and shape (Caliari and Harley, 2011). Mean transverse pore sizes as well as longitudinal and transverse pore aspect ratios are therefore reported as a single value for each scaffold variant (Table 1). The 1× scaffold showed a significantly (p < 0.01) larger pore size and higher pore aspect ratio compared to the 2× and 3× scaffolds. However, each scaffold variant exhibited significant anisotropy, with significantly greater pore aspect ratio (p < 0.002) in the longitudinal vs. transverse planes.
Table 1.
Mean pore size in the transverse plane as well as pore aspect ratios in the transverse and longitudinal planes for the three anisotropic CG scaffolds (1×, 2×, 3×). Pore aspect ratios in the longitudinal plane were significantly greater (p < 0.002) than in the transverse plane for each relative density, indicating that pores are elongated in the direction of the scaffold longitudinal axis. Data expressed as mean ± standard deviation, n = 3.
| Scaffold | Relative density |
Transverse pore size |
Pore aspect ratio |
|---|---|---|---|
| 1× | 0.0051 ± 0.0002 | 293.1±20.0 μm | Transverse: 1.14 ± 0.07 Longitudinal: 1.76 ± 0.25 |
| 2× | 0.0109 ± 0.0003 | 232.0±14.8 μm | Transverse: 1.16 ± 0.06 Longitudinal: 1.72 ± 0.14 |
| 3× | 0.0156 ± 0.0009 | 230.4±36.7 μm | Transverse: 1.15 ± 0.10 Longitudinal: 1.55 ± 0.25 |
3.2. Permeability of anisotropic CG scaffolds
Scaffold permeability was analyzed under three degrees of compressive strain levels (0%, 65%, and 78%), revealing a significant influence (p < 0.0001) of scaffold relative density and applied strain on permeability (Fig. 2). While all three scaffold variants showed similar permeability at 0% applied strain, the scaffold permeability at each relative density was significantly lower under 65% and 78% strain (p < 0.008) with permeability trending downwards as relative density increased.
Fig. 2.
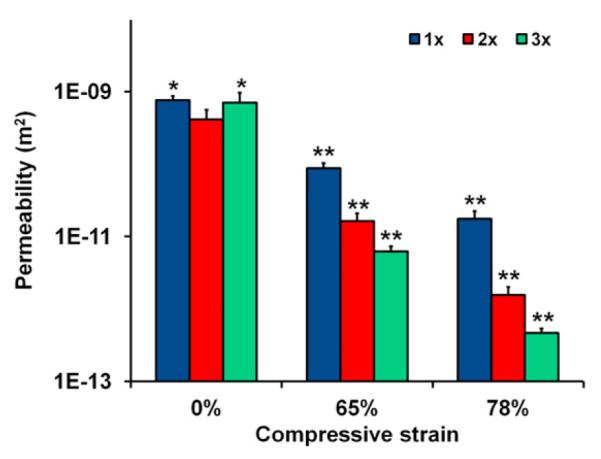
Scaffold permeability as a function of relative density and compression. (*) significantly greater than 0% 2× group value, (**) significantly less than the 0% value for given relative density. Data expressed as mean +/− SEM, n > 3.
3.3. Mechanical characterization of anisotropic CG scaffolds
Characterization of scaffold mechanical properties in tension (elastic modulus, ultimate tensile strength) and compression (elastic modulus, yield strength) revealed a significant influence (p < 0.0001) of scaffold relative density on compressive and tensile mechanical behavior (Fig. 3). In all cases mechanical metrics increased significantly (p < 0.009) with relative density with the exception of the increase in elastic compressive strength between 1× and 2× scaffold groups, where the difference was not quite significant (p = 0.14).
Fig. 3.
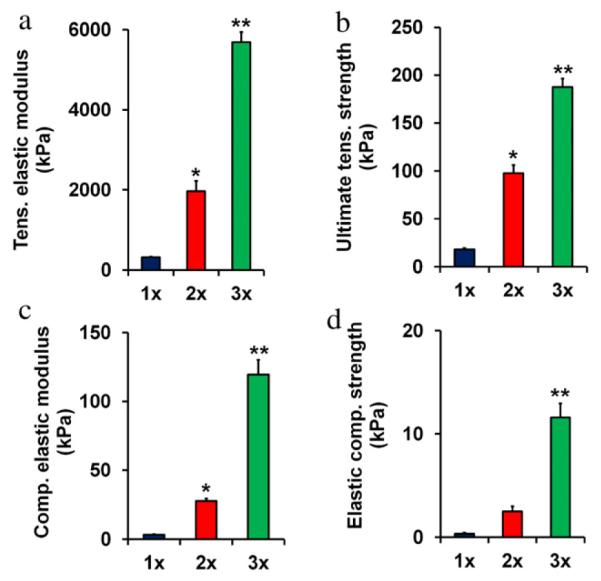
Mechanical properties of anisotropic CG scaffolds. (a) Tensile elastic modulus, (b) ultimate tensile strength, (c) compressive elastic modulus, and (d) elastic compressive strength in 1×, 2×, and 3× scaffolds. (*) significantly greater than 1× group, (**) significantly greater than 1× and 2× groups. Data expressed as mean − SEM, n = 6.
3.4. Tenocyte viability and collagen synthesis in anisotropic CG scaffolds
Tenocyte culture revealed a significant influence (p < 0.0003) of scaffold relative density on functional metrics of tenocyte bioactivity: proliferation, metabolic activity, contractile capacity, and soluble collagen synthesis (Fig. 4). For all time points the 2× and 3× scaffolds groups supported a significantly increased number of tenocytes (p < 0.002) (Fig. 4(a)) and higher tenocyte metabolic activity (p < 0.002) (Fig. 4(b)) compared to the 1× scaffold group. Tenocyte number significantly increased for all groups from day 1 to 4 (p < 0.002). However, tenocyte number plateaued for the 1× group between days 4 and 7 (p = 0.93) and significantly decreased from day 7 to day 14 (p = 0.001). Tenocyte number for the 2× and 3× groups significantly increased between days 4 and 7 (p < 0.002). While tenocyte number plateaued for the 2× group between days 7 and 14 (p = 0.90), the 3× group again showed a significant increase (p < 0.003). The 2× and 3× groups showed statistically significant differences in tenocyte number at days 4 and 14 (p < 0.05). Additionally, the 2× group displayed significantly higher tenocyte metabolic activity than the 3× group at early time points (days 1 and 4, p < 0.001), but there were no significant differences between the groups at day 7 or 14.
Fig. 4.

Viability, soluble collagen synthesis, and contraction in anisotropic CG scaffolds. (a) Tenocyte number, (b) tenocyte metabolic activity at 1, 4, 7, and 14 days in 1×, 2×, and 3× scaffold variants. (c) Cumulative soluble collagen synthesis through days 1–7 and 8–14 of culture in 1×, 2×, and 3× scaffold variants. (d) Scaffold contraction at 1, 4, 7, and 14 days in 1×, 2×, and 3× scaffold groups. (*) significantly greater than 1× group, (**) significantly greater than other two experimental groups. Data expressed as mean ± SEM, n > 3.
Soluble collagen production over the first week was significantly higher in the 2× group than the other two experimental groups (p < 0.002) (Fig. 4(c)). However, the 3× group synthesized a significantly greater amount of soluble collagen over the second week of the experiment compared to the 1× group (p = 0.02). Fibroblasts are known to have the potential to induce significant contraction of CG scaffolds (Freyman et al., 2001a; Harley et al., 2007a). Scaffold contraction results show that the 1× group exhibited significant contraction as early as day 4 with a significantly lower normalized scaffold diameter than both the 2× and 3× groups at day 4, 7, and 14 (p < 0.0001) (Fig. 4(d)). Additionally, the 2× group contracted moderately over the course of the experiment with significant differences with the 3× group at days 4, 7, and 14 (p < 0.002).
3.5. Tenocyte gene expression within anisotropic CG scaffolds
As tenocytes are known to de-differentiate with 2D culture (Zhu et al., 2010), expression of COL1A2, COL3A1, COMP, DCN, SCX, TNC, MMP1, MMP3, and MMP13 genes was evaluated after 1, 4, 7 and 14 days in culture (Figs. 5–7). Results were expressed as fold changes relative to the expression levels of the tenocytes cultured in standard 2D flasks at day 0 prior to scaffold seeding (dashed lines). Significantly increased (p < 0.05) expression of COL3A1, SCX, TNC, MMP1, MMP3, and MMP13 was observed in 3D scaffolds at day 1 compared to the 2D day 0 results.
Fig. 5.

Structural protein gene expression in anisotropic CG scaffolds. (a) COL1A2, (b) COL3A1, (c) COMP, and (d) DCN expression levels after 1, 4, 7, and 14 days in culture for 1×, 2×, and 3× scaffold variants. Fold changes normalized to transcript levels of tenocytes in 2D culture at day 0 prior to seeding on scaffolds (dashed line). (***) significantly greater than 3× group, ($) significantly greater than other two experimental groups, (^) significantly up-regulated from previous time point, (v) significantly down-regulated from previous time point. Data expressed as mean ± SEM, n = 3.
Fig. 7.
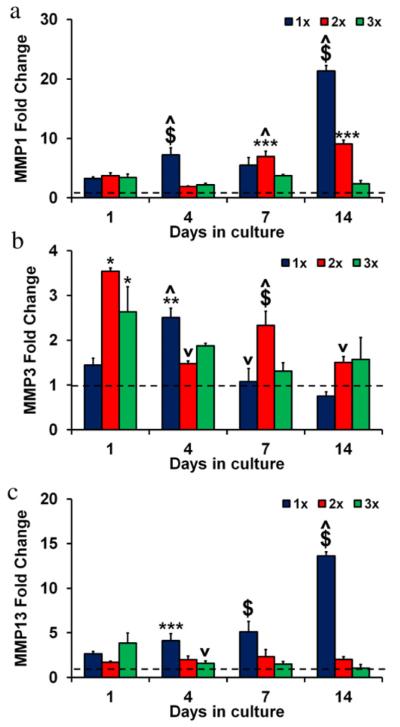
MMP gene expression in anisotropic CG scaffolds. (a) MMP1, (b) MMP3, and (c) MMP13 expression levels after 1, 4, 7, and 14 days in culture for 1×, 2×, and 3× scaffold variants. Fold changes normalized to transcript levels of tenocytes in 2D culture at day 0 prior to seeding on scaffolds (dashed line). (*) significantly greater than 1× group, (**) significantly greater than 2× group, (***) significantly greater than 3× group, ($) significantly greater than other two experimental groups, (^) significantly up-regulated from previous time point, (v) significantly down-regulated from previous time point. Data expressed as mean ± SEM, n = 3.
3.5.1. Structural protein gene expression
COL1A2, COL3A1, COMP, and DCN were expressed at similar levels (p > 0.05) for all three scaffold variants at day 1 (Fig. 5). Expression levels generally increased from day 1 to day 4 with the 1× scaffolds showing significantly higher expression of COL3A1 and DCN compared to the other two groups (p < 0.04). After day 7 the 1× group had significantly higher COL3A1 expression than the 3× group (p = 0.04). By day 14 the 1× and 2× groups showed significant down-regulation from day 7 of COL1A2 and COMP (p < 0.04) while there were no significant changes in the 3× group (p > 0.05). Overall, while significant increases in structural gene expression was almost ubiquitously observed in the anisotropic scaffolds relative to 2D culture during the first week, and significant differences in gene expression were observed between several scaffold groups and times, no significant across-the board trends in structural protein gene expression were observed with scaffold relative density with the exception of COMP.
3.5.2. Tendon phenotype gene expression
Significant differences (p < 0.02) and trends in tendon phenotype gene expression profiles were found with culture time, both relative to 2D culture controls and between scaffold relative densities. Scleraxis (SCX), a transcription factor expressed by healthy tenocytes (Kuo and Tuan, 2008; Taylor et al., 2009), expression was already significantly elevated at day 1 in all anisotropic scaffolds relative to 2D control cultures (p < 0.0003), suggesting a return to tenocyte-specific gene expression after 2D culture (Fig. 6(a)). Over the course of the two week culture period the 1× and 2× groups displayed significant (p < 0.03) down-regulation of SCX to the level of 2D control cultures while expression levels in the 3× group remained significantly elevated. Further, loss of SCX expression appeared to be temporally modulated, with increases in scaffold relative density significantly (p < 0.05) slowing the loss of SCX expression. Similarly, tenascin-C (TNC), an extracellular matrix glycoprotein associated with bioactive tenocytes (Doroski et al., 2010; Jarvinen et al., 2003), expression was significantly influenced by scaffold relative density and culture time (p < 0.02) (Fig. 6(b)). After day 1, TNC gene expression increased significantly (p = 0.007) in the 3× scaffolds relative to the 1× scaffolds which showed no significant increase in gene expression with culture time, although TNC expression remained significantly elevated compared to the 2D control for all time points. By day 14 there was a direct relation between relative density and expression levels of both SCX and TNC, with significantly increases in expression of both transcripts in the 3× group compared to the 1× and 2× groups (p < 0.05).
Fig. 6.
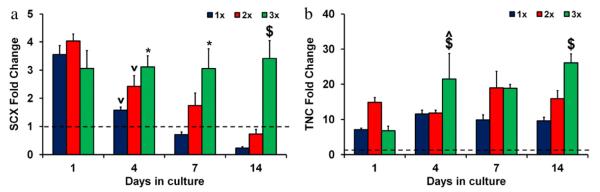
Tendon phenotype gene expression in anisotropic CG scaffolds. (a) SCX and (b) TNC expression levels after 1, 4, 7, and 14 days in culture for 1×, 2×, and 3× scaffold variants. Fold changes normalized to transcript levels of tenocytes in 2D culture at day 0 prior to seeding on scaffolds (dashed line). (*) significantly greater than 1× group, ($) significantly greater than other two experimental groups, (^) significantly up-regulated from previous time point, (v) significantly down-regulated from previous time point. Data expressed as mean ± SEM, n = 3.
3.5.3. MMP gene expression
Significant differences (p < 0.003) and suggestive trends were observed for MMP1, MMP3, and MMP13 gene expression with anisotropic scaffold culture, both relative to 2D culture controls and between scaffold relative densities. Healthy tendons typically express lower levels of MMP1 and MMP13 as well as higher levels of MMP3 compared to diseased and/or injured tendons (Clegg et al., 2007; Gotoh et al., 1997; Jones et al., 2006; Lo et al., 2004). There were no significant differences between the groups in MMP1 levels at day 1 (p > 0.05) (Fig. 7(a)), but MMP1 expression steadily increased in the 1× and 2× groups over the course of the experiment and by day 14 there was an inverse relationship between relative density and MMP1 expression level with the 3× group significantly down-regulated compared to the 1 × /2× groups (p < 0.0001). MMP3 levels were initially higher in the 2 × /3× groups compared to the 1× group at day 1 (p < 0.03) (Fig. 7(b)). This trend was also observed at day 14. While there were no significant differences in MMP13 expression between the groups on day 1 (p > 0.05), by day 4 and continuing through the remainder of the culture period MMP13 expression was inversely correlated with scaffold relative density, with the highest relative density (2× and 3×) anisotropic scaffolds showing significantly reduced MMP13 gene expression compared to the 1× group at days 7 and 14 (p < 0.03) (Fig. 7(c)), consistent with maintenance of tenocyte-specific expression profiles for the highest density scaffold.
3.6. Tenocyte distribution within scaffolds
Day 14 histology sections from the transverse sections of the scaffolds demonstrated differences in cell infiltration and the maintenance of an open pore structure. Pores in the 1× scaffold appeared significantly smaller and the scaffold appeared significantly denser overall than the 2× and 3× samples (Fig. 8(a–c)), likely a consequence of the significantly increased scaffold contraction in the initially lower density scaffolds. Additionally, the 1× group showed aggregations of tenocytes on the scaffold outer edge while cells were more equally distributed in the higher density scaffolds (Fig. 8(a–c)).
Fig. 8.

Histology and tenocyte alignment. (a–c) Day 14 histology sections (transverse plane) for (a) 1×, (b) 2×, and (c) 3× scaffolds. Higher density scaffolds show fewer cell aggregations and better maintenance of an open pore structure. Scale bars: 100 μm. (d–e) Frequency plots of tenocyte orientation angles: (d) day 7 (longitudinal), (e) day 14 (longitudinal). Orange arrow: direction of pore alignment.
3.7. Tenocyte alignment within anisotropic CG scaffolds
Longitudinal H&E sections from days 7 and 14 were analyzed to determine tenocyte orientation within the scaffolds. At day 7, tenocytes in all three groups trended toward alignment in the direction of heat transfer and pore anisotropy (0°) (Fig. 8(d)). While all groups showed longitudinally aligned cells, tenocytes in the 3× scaffold were significantly more likely to be aligned (between −10° and +10°) compared to the 1× and 2× groups at day 7 (p < 0.02). By day 14 of culture tenocytes in the 2× and 3× groups remained preferentially aligned while the tenocytes in the 1× scaffold displayed no alignment preference (random distribution of cell orientation angles) (Fig. 8(e)). Here, tenocytes in the 2× and 3× groups were significantly more longitudinally aligned than the 1× group at day 14 (p < 0.02).
4. Discussion
This manuscript describes the fabrication and functional analysis of a homologous series of anisotropic CG scaffolds with three different relative densities (1× : ρ*/ρs = 0.0051, 2× : ρ*/ρs = 0.0109, 3× : ρ*/ρs = 0.0156). Differential effects of relative density on scaffold microstructure (pore size and shape), permeability, and mechanics were observed that trended with cellular solids theory. Comparing the expression of tendon ECM proteins, transcription factors, and MMPs reveals direct relationships between CG scaffold relative density, mechanical and microstructural integrity during long-term culture (i.e., preservation of an aligned scaffold microstructure), and subsequent maintenance of a healthy tendon-like cell phenotype.
Scaffold microstructure was evaluated qualitatively via SEM and quantitatively using OrientationJ (Image J) to measure pore alignment as well as via standard stereology approaches to quantify scaffold mean pore size and pore aspect ratio. SEM and OrientationJ analyses indicated that all three scaffold variants showed significant pore anisotropy with no effect of relative density on the degree of anisotropy (Fig. 1). The 1× scaffold did have significantly larger pores than the 2 × /3× scaffolds, a trend seen previously in other types of CG scaffolds (Kanungo and Gibson, 2010) (Table 1), but all scaffolds had pore sizes approximately double that of primary equine tenocytes (order 100–125 μm) (Caliari and Harley, 2011). Additionally, while all scaffold variants showed ellipsoidal pores, the 3× scaffold had a smaller pore aspect ratio in the longitudinal plane (1.55:1 vs. 1.72:1, 1.76:1) compared to the 1 × /2× scaffolds. As scaffold pore geometry is defined by the ice crystal structure formed during suspension solidification, the reduction in pore size and pore aspect ratio seen for scaffolds with increasing relative density suggests that in the future it will be important to better understand the relationship between suspension chemical composition, viscosity, and freezing kinetics. Changes in suspension thermal conductivity, glass transition temperature, and suspension viscosity may all significantly contribute to the slight reduction in ice crystal aggregation and elongation during freezing. However all variants showed highly aligned contact guidance cues, as quantified via strut orientation angles (Fig. 1(b)) and pore aspect ratio (Table 1).
Scaffold permeability and mechanics were also evaluated as a function of relative density, with significant decreases in scaffold permeability observed with degree of compressive loading and relative density. Cellular solids modeling approaches provide a theoretical framework to consider the observed changes in mechanical and microstructural properties of CG scaffolds by describing them as low-density open-cell foams (Harley et al., 2007a, 2008, 2007b; O’Brien et al., 2007, 2005). Scaffold permeability is a critical scaffold parameter that dictates the diffusion and exchange of soluble factors, nutrients, and waste throughout the scaffold (Agrawal et al., 2000; Prendergast et al., 1997). CG scaffold permeability has previously been shown experimentally to change significantly as a function of scaffold pore size (d), applied strain (ε), and relative density (ρ*/ρs) (O’Brien et al., 2007). Further, a cellular solids model has been validated to describe the magnitude of these effects, showing that CG scaffold permeability increases proportionally with d2 but decreases with (1 − ε)2 and (1 − ρ*/ρs)3/2 (O’Brien et al., 2007). Although the permeability of the three constructs tested here were found to be similar at 0% strain, the combined effects of pore size, relative density, and applied strain are evident at higher strain levels where there is a clear inverse relationship between scaffold relative density and permeability that closely matches predictions of the previously described cellular solids model (Fig. 2). It is likely that the lack of observed differences in scaffold permeability at 0% applied strain was primarily influenced by the relatively small difference in the pore size term (d2, where d = 230–290 μm) and relatively small difference in the scaffold porosity (1 − ρ*/ρs)3/2 term (0.984–0.995). At significantly higher applied strains (0.65, 0.78), all scaffolds are a majority of the way through the collapse plateau region of the stress–strain curve (Harley et al., 2007b); here scaffold densification is significant, making it possible to resolve differences in scaffold permeability.
Scaffold mechanical properties at the macro- and microscale have been shown to significantly influence key cell behaviors including adhesion, migration, proliferation, and differentiation as well as overall construct bioactivity and integrity (Engler et al., 2004; Freyman et al., 2001b; Grinnell et al., 2003; Pelham et al., 1997; Peyton and Putnam, 2005; Yeung et al., 2005; Zaman et al., 2006). Mechanical tests were performed on dry, as opposed to hydrated, scaffolds to facilitate sample handling and mounting. We have previously shown that hydration and subsequent EDAC crosslinking alters the absolute values of scaffold mechanical properties, but not the trends between sample groups for both isotropic (Harley et al., 2007b) and anisotropic (Caliari et al., 2011) CG scaffolds. For CG scaffolds, modulus and yield strength have previously been shown to increase proportionally with (ρ*/ρs)2 (Harley et al., 2007b; Kanungo and Gibson, 2010). Experimentally determined mechanical results, both in tension and compression, follow these trends with observed increases in modulus and yield strength approximately a factor of 4 greater for 2× vs. 1× scaffolds, and over an order of magnitude for 3× vs. 1× scaffolds (Fig. 3). The increase in scaffold modulus at the macroscale (i.e. that measured via compression and tensile tests) is due to an increase in the size, hence flexural rigidity, of the individual struts that make up the scaffold network, not in the modulus of the CG content within each strut (Harley et al., 2007a,b). Previous studies have showed that individual (dermal) fibroblasts could generate sufficient force to buckle single CG scaffold struts and deform the local strut microarchitecture (Freyman et al., 2001a); additionally, careful micromechanical analysis suggested that these fibroblasts could individually generate a mean contractile force of order 20 nN, but that scaffold struts of increased size were able to present sufficient mechanical resistance to prevent cell-mediated contraction and strut buckling (Harley et al., 2007a). Such results suggested that scaffold relative density may significantly impact tenocyte contraction via changes in strut flexural rigidity, with important consequences in terms of long-term bioactivity and gene expression.
Therefore, to gauge the effect of scaffold relative density on tenocyte bioactivity and specifically contractile capacity, we next examined the behavior of tenocytes in the series of anisotropic CG scaffolds over a 14 day in vitro culture period. Critically, significant differences in scaffold contraction were observed, with lower density scaffolds exhibiting significantly greater decreases in scaffold diameter (Fig. 4(d)), correlating to significantly increased cell-mediated contraction. This was not surprising, as it was hypothesized that the higher density scaffolds would present the struts with the largest flexural rigidity (Es · I), hence greatest resistance to cell-mediated contraction. However, with cell-mediated contraction comes significant loss of local microstructural cues (i.e. aligned contact guidance cues from the anisotropic pore microstructure), as was observed in the significant densification of scaffold content seen in histology specimens for the 1× scaffold (Fig. 8(a)).
It is interesting therefore to consider the tenocyte bioactivity and gene expression data in the light of not only the initial scaffold microstructure, but also in the context of increased maintenance of anisotropic scaffold microstructural cues with increasing scaffold relative density during long-term culture, and the impact that may have on the kinetics of tenocyte bioactivity and transcriptomic stability. To do this, tenocyte number, metabolic activity, soluble collagen synthesis, and gene expression were all quantified. Initial cell attachment at day 1 was significantly higher in the 2× and 3× groups than the 1× group (Fig. 4(a)); this is consistent with cellular solids predictions stating the increased scaffold specific surface area (proportional to (ρ*/ρs)1/2) leads to increased early cell attachment (Kanungo and Gibson, 2010; O’Brien et al., 2005). Unlike the conclusions of Murphy et al. (2010), however, we did not see a biphasic relationship between specific surface area and cell attachment; this is likely due to a difference in how changes in specific surface area were obtained in these two studies. Murphy et al. examined a homologous series of CG scaffolds with constant relative density but variable pore size; here specific surface area increased with decreasing pore size, but steric hindrance to cell penetration also increased. In our investigation, specific surface area changed with scaffold relative density; with relatively large pores compared to the size of primary tenocytes (~125 μm) (Caliari and Harley, 2011), increases in scaffold relative density between 0.5% and 1.5% are not likely to provide a significant increase in steric hindrance to cell penetration. The 2× and 3× groups had similar cell numbers through the first week of culture although the 2× group had significantly higher metabolic activity at days 1 and 4 (Fig. 4(a–b)). This may explain why the 2× group produced a significantly higher amount of soluble collagen through the first week of the experiment compared to the other two groups (Fig. 4(c)). During the second week of the experiment the 1× scaffold (and to some extent the 2× scaffold) began to significantly shrink due to contractile forces exerted by attached tenocytes (Fig. 4(d)). This led to significant reductions in cell number for the 1× scaffold and a plateau of the cell number in the 2× scaffold from day 7 to day 14. In contrast, the mechanically superior 3× scaffold displayed minimal contraction and continual tenocyte proliferation through day 14, resulting in a significantly higher cell number and greater soluble collagen synthesis. Future work will examine the relative contribution of cell proliferation vs. apoptosis on the observed trends in numbers of cells per scaffold. Preferential tenocyte cell alignment was lost with scaffold contraction and loss of strut-based aligned contact guidance cues (Fig. 8(d–e)); these results are not surprising given the significant scaffold contraction seen in lower density scaffolds, but presents future avenues for investigation. Notably, it would be interesting to consider whether loss of scaffold anisotropy impacts changes in cell alignment and individual cell aspect ratio (rounded vs. elongated), and whether both or either would be the predominant predictor in loss of tenocyte phenotype within a 3D biomaterial. Such information would have far-reaching significance in the design of future bioactive templates to regenerate tendon injuries.
Transcript levels of the genes COL1A2, COL3A1, COMP, DCN, SCX, TNC, MMP1, MMP3, and MMP13 were evaluated after 1, 4, 7 and 14 days in culture (Figs. 5–7). Type I collagen is the primary protein constituent of tendon while type III collagen is highly expressed in immature tendon. COMP and decorin both modulate collagen fibrillogenesis and play key roles in the fibrocartilaginous region of the tendon–bone interface (Halasz et al., 2007; Liu et al., 2011; Waggett et al., 1998; Yoon and Halper, 2005). Scleraxis is a basic-helix-loop-helix transcription factor that is highly expressed in developing and mature tendon (Kuo and Tuan, 2008; Taylor et al., 2009). Tenascin-C is a matricellular protein that is associated with normal collagen fibril organization and is up-regulated during mechanical loading (Doroski et al., 2010; Jarvinen et al., 2003; Riley et al., 1996), making it an attractive gene target to use to assess tenocyte transcriptomic stability (Taylor et al., 2009). Matrix metalloproteinases are critical factors involved in cell migration, wound healing, and remodeling. Recent studies have elucidated that reduced expression of MMP-1 and MMP-13 coupled with elevated expression of MMP-3 is suggestive of a healthy tendon phenotype (Clegg et al., 2007; Gotoh et al., 1997; Jones et al., 2006; Lo et al., 2004).
In our experiments, transcript levels at each time point were normalized against expression levels of tenocytes cultured in standard 2D flasks to determine the influence of an engineered 3D anisotropic microenvironment on the transcriptomic stability of tenocytes. COL1A2, COL3A1, COMP, and DCN were initially expressed at similar levels for all three scaffold types (Fig. 5), although COL3A1 was significantly up-regulated compared to the 2D control. However, from day 7 to day 14 COL1A2 and COMP were down-regulated in the 1× and 2× groups, but not the 3× group. At day 14 although there were no significant differences in COL1A2 or COL3A1 expression, the 3× group had significantly higher COMP expression (4-fold) but significantly lower DCN expression. The expression of critical healthy tenocyte markers SCX and TNC was significantly up-regulated at day 1 compared to the 2D control, possibly due to the anisotropic contact guidance cues provided by all 3D scaffold variants (Fig. 6), though ongoing experiments are more specifically exploring this behavior. Similarly to the structural protein gene expression data, expression of SCX was about the same for all three experimental groups at day 1. However, there was a steady decrease in SCX expression for the less dense scaffolds over the course of the two week experiment that correlated to increasing scaffold contraction and loss of anisotropic microstructural cues that resulted in reduced cell anisotropy (Fig. 8(d–e)). SCX levels remained relatively constant throughout the two week culture period for the 3× scaffold group and by day 14 SCX was up-regulated 15-fold in the 3× scaffold compared to the 1× scaffold. TNC expression levels, like with SCX, showed a direct relationship with relative density by day 14. Finally, the expression of MMP1, MMP3, and MMP13 was measured (Fig. 7). All three transcripts were initially up-regulated compared to the 2D control. At day 4, the 1× scaffold had higher expression of all three genes compared to the other groups, although by day 14 it had lower MMP3 expression than the 2 × /3× groups. The higher levels of MMP1 and MMP13 for the 1× group were maintained through the end of the experiment. Together, these results suggest that scaffold relative density not only had significant importance in regulating traditional measures of tenocyte bioactivity (attachment, proliferation, metabolic activity, collagen synthesis), but that the degree of anisotropy within a 3D biomaterial microenvironment plays a significant role in regulating the transcriptomic stability of tenocytes. Scaffold anisotropy may in fact play a significant role in a variety of other tissue engineering applications where the native tissue exhibits a significant degree of microstructural alignment; additionally, the orientation dependent microstructural and mechanical cues available to individual cells within an anisotropic scaffold structure may also have significant importance in regulating stem cell differentiation processes for those same tissues. Future work will also examine the regenerative potential of these anisotropic CG scaffolds for a range of clinically relevant injury models (i.e. partial Achilles tendon, supraspinatus tendon defects).
5. Conclusions
This work describes the evaluation of scaffold microstructure and mechanics as well as tenocyte viability and gene expression profiles for a homologous series of anisotropic CG scaffolds with variable relative density. SEM and stereology showed that aligned scaffolds with elongated pores and a consistent degree of anisotropy could be fabricated independent of relative density. Scaffold permeability and mechanics, both in tension and compression, demonstrated dependence on relative density with 3× scaffold mechanical properties increasing by over an order of magnitude compared to 1× scaffolds, consistent with predictions made via cellular solids modeling. Equine tenocytes showed increased proliferation, metabolic activity, soluble collagen synthesis, and alignment as well as less cell-mediated scaffold contraction when cultured in higher density scaffolds. The low density scaffolds underwent significant contraction that resulted in reduced cell number, loss of microstructural integrity and cell alignment, and loss of tenocyte-specific gene expression profiles over the 14 day culture period. Functional and gene expression analyses also suggested that the highest density anisotropic scaffold maintained a more tendon-like microenvironment that preserves tenocyte transcriptomic stability. Notably, tenocytes in the highest density scaffold displayed marked, significant increases in COMP, TNC, and SCX expression as well as significant decreases in MMP1 and MMP13 expression. This work suggests that scaffold relative density is a critical design parameter, not only for insuring mechanical competence and providing microstructural and mechanical cues at the experiment outset, but also for maintaining essential microstructural cues to direct cell behavior and gene expression over the course of long-term culture.
Acknowledgments
The authors would like to acknowledge Dr. Allison Stewart (Veterinary Sciences, UIUC) for providing equine tendon cells, Karen Doty (Veterinary Sciences, UIUC) for sectioning of GMA embedded samples, Donna Epps for sectioning and staining of paraffin embedded samples, and the IGB Core Facilities for the use of their real-time PCR system. We are grateful for the funding for this study provided by the Chemistry–Biology Interface Training Program NIH NIGMS T32GM070421 (SRC), the Chemical and Biomolecular Engineering Dept. (BAH), and the Institute for Genomic Biology (BAH) at the University of Illinois at Urbana-Champaign. This research was carried out in part in the Frederick Seitz Materials Research Laboratory Central Facilities, University of Illinois, which is partially supported by the US Department of Energy under grants DEFG02-07ER46453 and DE-FG02-07ER46471.
REFERENCES
- Agrawal CM, McKinney JS, Lanctot D, Athanasiou KA. Effects of fluid flow on the in vitro degradation kinetics of biodegradable scaffolds for tissue engineering. Biomaterials. 2000;21:2443–2452. doi: 10.1016/s0142-9612(00)00112-5. [DOI] [PubMed] [Google Scholar]
- Butler DL, Juncosa-Melvin N, Boivin GP, Galloway MT, Shearn JT, Gooch C, Awad H. Functional tissue engineering for tendon repair: a multidisciplinary strategy using mesenchymal stem cells, bioscaffolds, and mechanical stimulation. J. Orthop. Res. 2008;26:1–9. doi: 10.1002/jor.20456. [DOI] [PubMed] [Google Scholar]
- Caliari SR, Harley BAC. The effect of anisotropic collagen-GAG scaffolds and growth factor supplementation on tendon cell recruitment, alignment, and metabolic activity. Biomaterials. 2011;32:5330–5340. doi: 10.1016/j.biomaterials.2011.04.021. [DOI] [PMC free article] [PubMed] [Google Scholar]
- Caliari SR, Ramirez MA, Harley BAC. The development of collagen-GAG scaffold-membrane composites for tendon tissue engineering. Biomaterials. 2011;32:8990–8998. doi: 10.1016/j.biomaterials.2011.08.035. [DOI] [PMC free article] [PubMed] [Google Scholar]
- Clegg PD, Strassburg S, Smith RK. Cell phenotypic variation in normal and damaged tendons. Int. J. Exp. Pathol. 2007;88:227–235. doi: 10.1111/j.1365-2613.2007.00549.x. [DOI] [PMC free article] [PubMed] [Google Scholar]
- Doroski DM, Levenston ME, Temenoff JS. Cyclic tensile culture promotes fibroblastic differentiation of marrow stromal cells encapsulated in poly(ethylene glycol)-based hydrogels. Tissue Eng. Part A. 2010;16:3457–3466. doi: 10.1089/ten.tea.2010.0233. [DOI] [PMC free article] [PubMed] [Google Scholar]
- Duffy GP, McFadden TM, Byrne EM, Gill SL, Farrell E, O’Brien FJ. Towards in vitro vascularisation of collagen-GAG scaffolds. Eur. Cell Mater. 2011;21:15–30. doi: 10.22203/ecm.v021a02. [DOI] [PubMed] [Google Scholar]
- Engler A, Bacakova L, Newman C, Hategan A, Griffin M, Discher D. Substrate compliance versus ligand density in cell on gel responses. Biophys. J. 2004;86:617–628. doi: 10.1016/S0006-3495(04)74140-5. [DOI] [PMC free article] [PubMed] [Google Scholar]
- Fonck E, Feigl GG, Fasel J, Sage D, Unser M, Rufenacht DA, Stergiopulos N. Effect of aging on elastin functionality in human cerebral arteries. Stroke. 2009;40:2552–2556. doi: 10.1161/STROKEAHA.108.528091. [DOI] [PubMed] [Google Scholar]
- Freyman TM, Yannas IV, Pek Y-S, Yokoo R, Gibson LJ. Micromechanics of fibroblast contraction of a collagen-GAG matrix. Exp. Cell Res. 2001a;269:140–153. doi: 10.1006/excr.2001.5302. [DOI] [PubMed] [Google Scholar]
- Freyman TM, Yannas IV, Yokoo R, Gibson LJ. Fibroblast contraction of a collagen-GAG matrix. Biomaterials. 2001b;22:2883–2891. doi: 10.1016/s0142-9612(01)00034-5. [DOI] [PubMed] [Google Scholar]
- Garvican ER, Vaughan-Thomas A, Redmond C, Clegg PD. Chondrocytes harvested from osteochondritis dissecans cartilage are able to undergo limited in vitro chondrogenesis despite having perturbations of cell phenotype in vivo. J. Orthop. Res. 2008;26:1133–1140. doi: 10.1002/jor.20602. [DOI] [PubMed] [Google Scholar]
- Gibson LJ, Ashby MF, Harley BA. Cellular Materials in Nature and Medicine. Cambridge University Press; Cambridge, UK: 2010. [Google Scholar]
- Gotoh M, Hamada K, Yamakawa H, Tomonaga A, Inoue A, Fukuda H. Significance of granulation tissue in torn supraspinatus insertions: an immunohistochemical study with antibodies against interleukin-1 beta, cathepsin D, and matrix metalloprotease-1. J. Orthop. Res. 1997;15:33–39. doi: 10.1002/jor.1100150106. [DOI] [PubMed] [Google Scholar]
- Grinnell F, Ho CH, Tamariz E, Lee DJ, Skuta G. Dendritic fibroblasts in three-dimensional collagen matrices. Mol. Biol. Cell. 2003;14:384–395. doi: 10.1091/mbc.E02-08-0493. [DOI] [PMC free article] [PubMed] [Google Scholar]
- Halasz K, Kassner A, Morgelin M, Heinegard D. COMP acts as a catalyst in collagen fibrillogenesis. J. Biol. Chem. 2007;282:31166–31173. doi: 10.1074/jbc.M705735200. [DOI] [PubMed] [Google Scholar]
- Harley BA, Freyman TM, Wong MQ, Gibson LJ. A new technique for calculating individual dermal fibroblast contractile forces generated within collagen-GAG scaffolds. Biophys. J. 2007a;93:2911–2922. doi: 10.1529/biophysj.106.095471. [DOI] [PMC free article] [PubMed] [Google Scholar]
- Harley BA, Kim HD, Zaman MH, Yannas IV, Lauffenburger DA, Gibson LJ. Microarchitecture of three-dimensional scaffolds influences cell migration behavior via junction interactions. Biophys. J. 2008;95:4013–4024. doi: 10.1529/biophysj.107.122598. [DOI] [PMC free article] [PubMed] [Google Scholar]
- Harley BA, Leung JH, Silva EC, Gibson LJ. Mechanical characterization of collagen-glycosaminoglycan scaffolds. Acta Biomater. 2007b;3:463–474. doi: 10.1016/j.actbio.2006.12.009. [DOI] [PubMed] [Google Scholar]
- Harley BA, Lynn AK, Wissner-Gross Z, Bonfield W, Yannas IV, Gibson LJ. Design of a multiphase osteochondral scaffold III: Fabrication of layered scaffolds with continuous interfaces. J. Biomed. Mater. Res. A. 2010;92:1078–1093. doi: 10.1002/jbm.a.32387. [DOI] [PubMed] [Google Scholar]
- Harley BA, Spilker MH, Wu JW, Asano K, Hsu HP, Spector M, Yannas IV. Optimal degradation rate for collagen chambers used for regeneration of peripheral nerves over long gaps. Cells Tissues Organs. 2004;176:153–165. doi: 10.1159/000075035. [DOI] [PubMed] [Google Scholar]
- Istrate OM, Chen B. Relative modulus-relative density relationships in low density polymer-clay nanocomposite foams. Soft Matter. 2011 [Google Scholar]
- James R, Kesturu G, Balian G, Chhabra AB. Tendon: biology, biomechanics, repair, growth factors, and evolving treatment options. J. Hand Surg-Am. 2008;33A:102–112. doi: 10.1016/j.jhsa.2007.09.007. [DOI] [PubMed] [Google Scholar]
- Jarvinen TA, Jozsa L, Kannus P, Jarvinen TL, Hurme T, Kvist M, Pelto-Huikko M, Kalimo H, Jarvinen M. Mechanical loading regulates the expression of tenascin-C in the myotendinous junction and tendon but does not induce de novo synthesis in the skeletal muscle. J. Cell Sci. 2003;116:857–866. doi: 10.1242/jcs.00303. [DOI] [PubMed] [Google Scholar]
- Jones GC, Corps AN, Pennington CJ, Clark IM, Edwards DR, Bradley MM, Hazleman BL, Riley GP. Expression profiling of metalloproteinases and tissue inhibitors of metalloproteinases in normal and degenerate human achilles tendon. Arthritis Rheum. 2006;54:832–842. doi: 10.1002/art.21672. [DOI] [PubMed] [Google Scholar]
- Juncosa-Melvin N, Matlin KS, Holdcraft RW, Nirmalanandhan VS, Butler DL. Mechanical stimulation increases collagen type I and collagen type III gene expression of stem cell-collagen sponge constructs for patellar tendon repair. Tissue Eng. 2007;13:1219–1226. doi: 10.1089/ten.2006.0339. [DOI] [PubMed] [Google Scholar]
- Kanungo BP, Gibson LJ. Density-property relationships in mineralized collagen-glycosaminoglycan scaffolds. Acta Biomater. 2009;5:1006–1018. doi: 10.1016/j.actbio.2008.11.029. [DOI] [PubMed] [Google Scholar]
- Kanungo BP, Gibson LJ. Density-property relationships in collagen-glycosaminoglycan scaffolds. Acta Biomater. 2010;6:344–353. doi: 10.1016/j.actbio.2009.09.012. [DOI] [PubMed] [Google Scholar]
- Kapoor A, Caporali EH, Kenis PJ, Stewart MC. Microtopographically patterned surfaces promote the alignment of tenocytes and extracellular collagen. Acta Biomater. 2010;6:2580–2589. doi: 10.1016/j.actbio.2009.12.047. [DOI] [PubMed] [Google Scholar]
- Kim YJ, Sah RL, Doong JY, Grodzinsky AJ. Fluorometric assay of DNA in cartilage explants using Hoechst 33,258. Anal Biochem. 1988;174:168–176. doi: 10.1016/0003-2697(88)90532-5. [DOI] [PubMed] [Google Scholar]
- Kuo CK, Tuan RS. Mechanoactive tenogenic differentiation of human mesenchymal stem cells. Tissue Eng. Part A. 2008;14:1615–1627. doi: 10.1089/ten.tea.2006.0415. [DOI] [PubMed] [Google Scholar]
- Lareu RR, Zeugolis DI, Abu-Rub M, Pandit A, Raghunath M. Essential modification of the Sircol Collagen Assay for the accurate quantification of collagen content in complex protein solutions. Acta Biomater. 2010;6:3146–3151. doi: 10.1016/j.actbio.2010.02.004. [DOI] [PubMed] [Google Scholar]
- Liu CF, Aschbacher-Smith L, Bathelery NJ, Dyment N, Butler DL, Wylie C. Spatial and temporal expression of molecular markers and cell signals during normal development of the mouse patellar tendon. Tissue Eng. Part A. 2011 doi: 10.1089/ten.tea.2011.0338. [DOI] [PMC free article] [PubMed] [Google Scholar]
- Li X, Xie J, Lipner J, Yuan X, Thomopoulos S, Xia Y. Nanofiber scaffolds with gradations in mineral content for mimicking the tendon-to-bone insertion site. Nano. Lett. 2009;9:2763–2768. doi: 10.1021/nl901582f. [DOI] [PMC free article] [PubMed] [Google Scholar]
- Lo IK, Marchuk LL, Hollinshead R, Hart DA, Frank CB. Matrix metalloproteinase and tissue inhibitor of matrix metalloproteinase mRNA levels are specifically altered in torn rotator cuff tendons. Am. J. Sports Med. 2004;32:1223–1229. doi: 10.1177/0363546503262200. [DOI] [PubMed] [Google Scholar]
- Mishra A, Woodall J, Jr., Vieira A. Treatment of tendon and muscle using platelet-rich plasma. Clin. Sports Med. 2009;28:113–125. doi: 10.1016/j.csm.2008.08.007. [DOI] [PubMed] [Google Scholar]
- Moffat KL, Kwei AS, Spalazzi JP, Doty SB, Levine WN, Lu HH. Novel nanofiber-based scaffold for rotator cuff repair and augmentation. Tissue Eng. Part A. 2009;15:115–126. doi: 10.1089/ten.tea.2008.0014. [DOI] [PMC free article] [PubMed] [Google Scholar]
- Murphy CM, Haugh MG, O’Brien FJ. The effect of mean pore size on cell attachment, proliferation and migration in collagen-glycosaminoglycan scaffolds for bone tissue engineering. Biomaterials. 2010;31:461–466. doi: 10.1016/j.biomaterials.2009.09.063. [DOI] [PubMed] [Google Scholar]
- O’Brien FJ, Harley BA, Waller MA, Yannas IV, Gibson LJ, Prendergast PJ. The effect of pore size on permeability and cell attachment in collagen scaffolds for tissue engineering. Technol. Health Care. 2007;15:3–17. [PubMed] [Google Scholar]
- O’Brien FJ, Harley BA, Yannas IV, Gibson L. Influence of freezing rate on pore structure in freeze-dried collagen-GAG scaffolds. Biomaterials. 2004;25:1077–1086. doi: 10.1016/s0142-9612(03)00630-6. [DOI] [PubMed] [Google Scholar]
- O’Brien FJ, Harley BA, Yannas IV, Gibson LJ. The effect of pore size on cell adhesion in collagen-GAG scaffolds. Biomaterials. 2005;26:433–441. doi: 10.1016/j.biomaterials.2004.02.052. [DOI] [PubMed] [Google Scholar]
- Olde Damink LH, Dijkstra PJ, van Luyn MJ, van Wachem PB, Nieuwenhuis P, Feijen J. Cross-linking of dermal sheep collagen using a water-soluble carbodiimide. Biomaterials. 1996;17:765–773. doi: 10.1016/0142-9612(96)81413-x. [DOI] [PubMed] [Google Scholar]
- Pelham J, Robert J, Wang Y-L. Cell locomotion and focal adhesions are regulated by substrate flexibility. Proc. Natl. Acad. Sci. USA. 1997;9:13661–13665. doi: 10.1073/pnas.94.25.13661. [DOI] [PMC free article] [PubMed] [Google Scholar]
- Peyton SR, Putnam AJ. Extracellular matrix rigidity governs smooth muscle cell motility in a biphasic fashion. J. Cell Physiol. 2005;204:198–209. doi: 10.1002/jcp.20274. [DOI] [PubMed] [Google Scholar]
- Prendergast PJ, Huiskes R, Soballe K. ESB research award 1996. Biophysical stimuli on cells during tissue differentiation at implant interfaces. J. Biomech. 1997;30:539–548. doi: 10.1016/s0021-9290(96)00140-6. [DOI] [PubMed] [Google Scholar]
- Riley GP, Harrall RL, Cawston TE, Hazleman BL, Mackie EJ. Tenascin-C and human tendon degeneration. Am. J. Pathol. 1996;149:933–943. [PMC free article] [PubMed] [Google Scholar]
- Sahoo S, Toh SL, Goh JC. A bFGF-releasing silk/PLGA-based biohybrid scaffold for ligament/tendon tissue engineering using mesenchymal progenitor cells. Biomaterials. 2010;31:2990–2998. doi: 10.1016/j.biomaterials.2010.01.004. [DOI] [PubMed] [Google Scholar]
- Spilker MH, Asano K, Yannas IV, Spector M. Contraction of collagen-glycosaminoglycan matrices by peripheral nerve cells in vitro. Biomaterials. 2001;22:1085–1093. doi: 10.1016/s0142-9612(00)00345-8. [DOI] [PubMed] [Google Scholar]
- Taylor SE, Vaughan-Thomas A, Clements DN, Pinchbeck G, Macrory LC, Smith RK, Clegg PD. Gene expression markers of tendon fibroblasts in normal and diseased tissue compared to monolayer and three dimensional culture systems. BMC Musculoskelet Disord. 2009;10:27. doi: 10.1186/1471-2474-10-27. [DOI] [PMC free article] [PubMed] [Google Scholar]
- Tierney CM, Jaasma MJ, O’Brien FJ. Osteoblast activity on collagen-GAG scaffolds is affected by collagen and GAG concentrations. J. Biomed. Mater. Res. A. 2009;91:92–101. doi: 10.1002/jbm.a.32207. [DOI] [PubMed] [Google Scholar]
- Torres DS, Freyman TM, Yannas IV, Spector M. Tendon cell contraction of collagen-GAG matrices in vitro: effect of cross-linking. Biomaterials. 2000;21:1607–1619. doi: 10.1016/s0142-9612(00)00051-x. [DOI] [PubMed] [Google Scholar]
- Waggett AD, Ralphs JR, Kwan AP, Woodnutt D, Benjamin M. Characterization of collagens and proteoglycans at the insertion of the human Achilles tendon. Matrix Biol. 1998;16:457–470. doi: 10.1016/s0945-053x(98)90017-8. [DOI] [PubMed] [Google Scholar]
- Yannas IV. Tissue and Organ Regeneration in Adults. Springer; New York: 2001. [Google Scholar]
- Yannas IV, Lee E, Orgill DP, Skrabut EM, Murphy GF. Synthesis and characterization of a model extracellular matrix that induces partial regeneration of adult mammalian skin. Proc. Natl. Acad. Sci. USA. 1989;86:933–937. doi: 10.1073/pnas.86.3.933. [DOI] [PMC free article] [PubMed] [Google Scholar]
- Yannas IV, Tobolsky AV. Cross-linking of gelatine by dehydration. Nature. 1967;215:509–510. doi: 10.1038/215509b0. [DOI] [PubMed] [Google Scholar]
- Yeung T, Georges PC, Flanagan LA, Marg B, Ortiz M, Funaki M, Zahir N, Ming W, Weaver V, Janmey PA. Effects of substrate stiffness on cell morphology, cytoskeletal structure, and adhesion. Cell Motil. Cytoskeleton. 2005;60:24–34. doi: 10.1002/cm.20041. [DOI] [PubMed] [Google Scholar]
- Yoon JH, Halper J. Tendon proteoglycans: biochemistry and function. J. Musculoskelet Neuronal Interact. 2005;5:22–34. [PubMed] [Google Scholar]
- Zaman MH, Trapani LM, Sieminski AL, Mackellar D, Gong H, Kamm RD, Wells A, Lauffenburger DA, Matsudaira P. Migration of tumor cells in 3D matrices is governed by matrix stiffness along with cell-matrix adhesion and proteolysis. Proc. Natl. Acad. Sci. USA. 2006;103:10889–10894. doi: 10.1073/pnas.0604460103. [DOI] [PMC free article] [PubMed] [Google Scholar]
- Zhu J, Li J, Wang B, Zhang WJ, Zhou G, Cao Y, Liu W. The regulation of phenotype of cultured tenocytes by microgrooved surface structure. Biomaterials. 2010;31:6952–6958. doi: 10.1016/j.biomaterials.2010.05.058. [DOI] [PubMed] [Google Scholar]