OPTICAL COHERENCE TOMOGRAPHY
Background
Optical coherence tomography (OCT) is a diagnostic imaging tool that provides cross-sectional images of the retina. It was first described in 1991 by Huang and colleagues1 and became commercially available in 1996. Since then, it has improved diagnosis and management of retinal diseases and is considered standard of care in age-related macular degeneration and diabetic retinopathy among other adult retinal diseases.
OCT works by projecting a broadband light into the eye, with the most common commercial systems centered around ~840 nm wavelength. The backscattered light is then combined for comparison with light reflected from a reference arm. The combination of both lights generates an interference signal. As the beam of light sweeps across the retina, these interference patterns are processed to form the cross-sectional images of the living tissue.
The early ophthalmic OCT design was named time domain OCT (TDOCT) because the reference arm moving mirror is translated in time to scan the depth of the retina. Because of this feature, early versions of ophthalmic OCT had limited speed of scan acquisition and limited resolution. TDOCT evolved to what is now known as spectral-domain OCT (SDOCT), an OCT imaging modality that uses a fixed mirror reference arm and analyzes the interference signal based on the wavelength of light. SDOCT became available in 2002, providing better axial image resolution and faster scan acquisition. The use of improved broader bandwidth light sources also improved the lateral resolution (Table 1).2,3 A new OCT modality with even higher speed, swept-source OCT, is currently available in research systems, with promising capabilities of imaging the retina and choroid.4,5
Table 1.
OCT modalities: technical characteristics
| TDOCT | SDOCT | Swept Source | |
|---|---|---|---|
| Signal-to-noise ratio | Low | High | High |
| Speed | 1× | 50× to 250× | 250× to 1000× |
| A-scans/s | 400 | 20,000–100,000 | 100,000–400,000 |
| Motion artifacts | Frequent | Reduced | Reduced |
| Volumetric scans | No | Yes | Yes |
| Axial resolution (μm) | >10 | <5 | 5–6 |
| Lateral resolution (μm) | 20–30 | <10 | 10–20 |
OCT Clinical Applications
There are many applications for OCT within the body (eg, skin, major vessels, heart)6; however, the first and most extensive use still remains within the eye, for cornea, lens, iridocorneal angle, retina, choroid, and optic nerve. In the retina, OCT has been used most extensively in the diagnosis and management of glaucoma and vitreoretinal diseases (Table 2) in older children and adults. In these populations, OCT also plays a major role in providing measurable end points for clinical trials in diseases such as macular degeneration or vitreous traction.7,8
Table 2.
Vitreoretinal structures and diseases evaluated by OCT
| Structure | Disease |
|---|---|
| Vitreous | Vitreomacular attachment and traction |
|
| |
| Preretinal | Epiretinal membranes |
| Neovascularization | |
| Fibrovascular tissue | |
|
| |
| Retina | Macular holes |
| Cystoid macular edema | |
| Schisis | |
| Swelling/thickening | |
| Deformation/folding | |
| Atrophy/degeneration | |
| Drug toxicity | |
| Subretinal fluid | |
| Retinal detachments | |
| Pigment epithelium detachment | |
| Choroidal neovascularization | |
|
| |
| Optic nerve | Glaucoma |
| Optic nerve malformations | |
| Swelling | |
| Atrophy | |
Normal Adult Versus Infant Macular SDOCT
SDOCT cross-sectional images of the retina (B-scans) show retinal architecture by providing information on vitreous, retinal, and foveal shape, differentiation of all retinal layers, choroid, and choroid-scleral junction. The particular spatial arrangement of cells and subcellular elements in the retina provides different reflectivity profiles, which often contrast with adjacent layers. In general, nuclear layers appear hyporeflective and axonal and dendrite layers appear hyperreflective, as seen in Fig. 1.
Fig. 1.
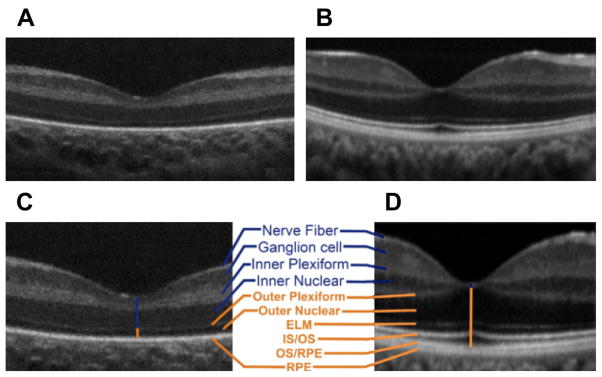
Infant versus adult retinal layers differences visualized by SDOCT. Summed SDOCT B-scans at the fovea. (A) From a 31-week-old PMA premature infant (born at 27 weeks PMA, birth weight 1205 g, ROP zone II, stage 2) and (B) from a 23-year-old adult born at term. (C, D) are magnified images of (A, B), respectively, to show retinal layers in better detail. From inner (top) to outer (bottom), the layers are nerve fiber layer, ganglion cell layer (GCL), inner plexiform layer (IPL), inner nuclear layer (INL), outer plexiform layer (OPL), outer nuclear layer, external limiting membrane, inner segment (IS) to outer segment (OS), photo-receptor OS, and retinal pigment epithelium (RPE) microvilli, and RPE. Note that the thick IRLs of the neonate (blue upper vertical line, layers listed in blue) correspond to thin condensed corresponding layers in the adult and that the thin outer retinal layers of the neonate (orange lower vertical line) became thicker layers in the adult eye (listed in orange; external limiting membrane [ELM], IS/OS, and OS/RPE were not present in the premature fovea). (From Maldonado RS, O’Connell RV, Sarin N, et al. Dynamics of human foveal development after premature birth. Ophthalmology 2011;118(12):2316; with permission.)
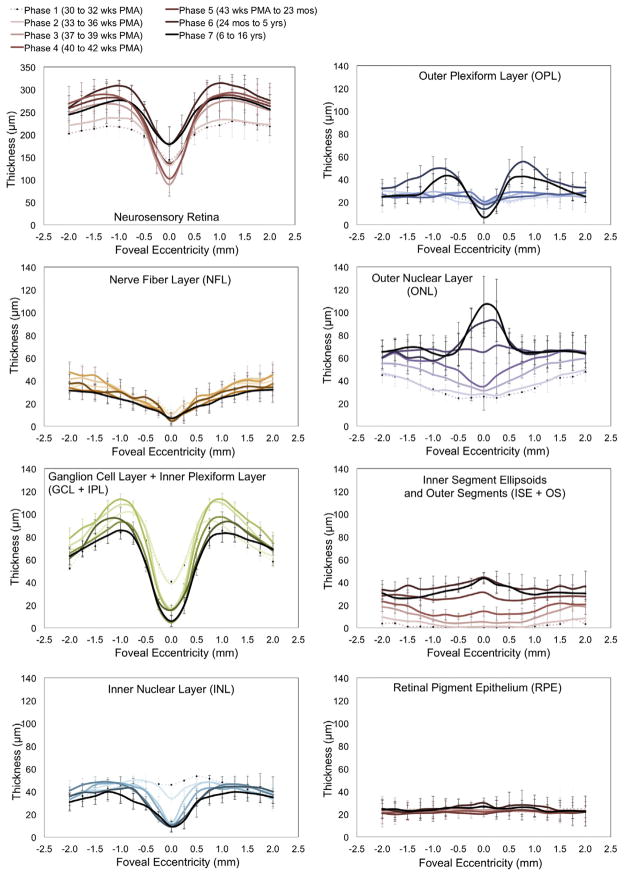
As noted on Fig. 1, the infant fovea has several differences compared with the adult fovea. This observation led to the first in vivo study of human foveal development using SDOCT,9 in which SDOCT scans of the fovea were obtained and analyzed from 31 weeks postmenstrual age (PMA) until adulthood, with observations of centrifugal inner retinal layer migration and centripetal outer retinal layer growth in the first months of life in prematurely born infants. Furthermore, with segmentation techniques, the thickness of individual retinal layers has been studied in the prenatal period, showing progressive thinning at the foveal center and thickening on the parafoveal region with increasing age, whereas the inner segment and outer segment thicknesses appear and then increase at the foveal center as the infant grows (Fig. 2).9,10
Fig. 2.
Retinal layer thickness redistribution during foveal development quantified by SDOCT image segmentation. Mean retinal layer thicknesses are represented from 30 weeks PMA to 16 years. Premature infants are in phases 1 and 2, phases 3 and 4 include term birth, and children are in phases 5 to 7. The youngest age group (phase 1) is represented by a pale dotted line with increasing color intensity up to the oldest (phase 7), a black line. Standard deviations are plotted as error bars. This figure shows a centrifugal redistribution of inner retinal layers (box plots on the left) and centripetal growth at the photoreceptor layers (box plots on the right). From Vajzovic L, Hendrickson AE, O’Connell RV, et al. Maturation of the human fovea: correlation of spectral-domain optical coherence tomography with histology. Am J Ophthalmol 2012;154(5):782; with permission.
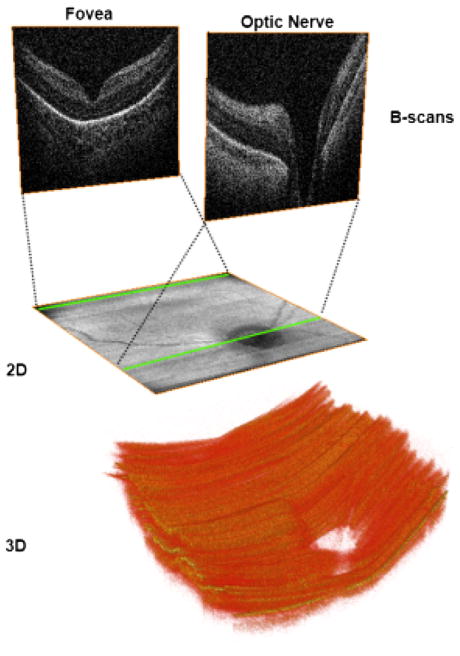
An important feature of SDOCT is the capability of producing two-dimensional maps and three-dimensional volumes from the numerous captured B-scans (Fig. 3). This feature aids in localization of structures or pathologic processes within the retina11 and is particularly useful for finding the fovea when the patient does not fixate.
Fig. 3.
Two-dimensional (2D) and three-dimensional (3D) images obtained from volumetric SDOCT scans from a 31-week-old PMA infant. Volumetric 6 × 6 mm SDOCT scan from a 31-week-old PMA infant. Sixty B-scans were acquired in less than 4 seconds, with minimal motion detected during acquisition. The foveal and optic nerve B-scans are shown in the top of the figure. By collapsing axially all the pixels from each B-scan, a 2 fundus image (middle) comparable with a fundus photo can be obtained. Using volume rendering software, a 3D reconstruction was achieved (bottom), showing the optic nerve cup and the retinal surface contour.
Need for SDOCT in the Pediatric Population
More than 1.4 million children are blind, and millions visually impaired worldwide.12 Ninety percent of blind children receive no schooling, representing one-third of the economic cost of blindness. In the United States, it is estimated that more than 50,000 children are legally blind, with retinal diseases being the leading ocular cause after cortical blindness.13
Most SDOCT systems were designed as tabletop units for adults and cooperative patients able to fixate or maintain a stable position in a chin rest during image capture. We believe that there is a need not only for SDOCT systems designed for the pediatric population but also for an imaging methodology designed for the small pediatric eye. Along with new portable devices, an adequate methodology is needed to capture and interpret SDOCT in infants, neonates, and children.
OPTIMIZING OCT FOR INFANTS, ADULTS, AND CHILDREN
Equipment: Handheld and Portable Systems
Although there have been reports of using unmounted tabletop systems for OCT in infants,14,15 we believe that this is not the ideal methodology, because the delicate neonates and infants may be exposed to unnecessary discomfort and manipulation, in addition to having to be taken out of their cribs for imaging with large systems. It is useful to have OCT systems designed to be as portable as possible to limit the impact on an infant in an intensive care setting.
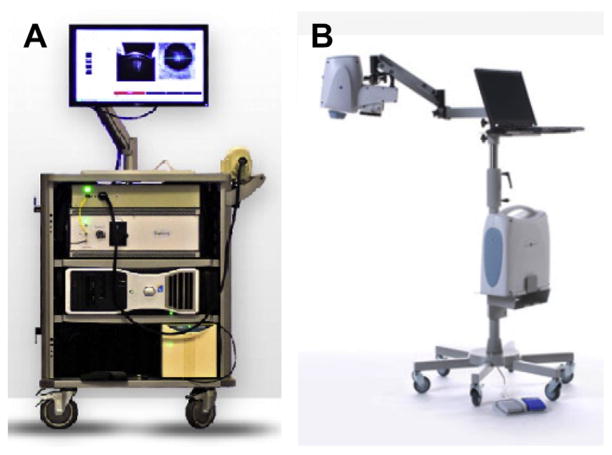
Two portable SDOCT systems are commercially available in the United States. Bioptigen (Durham, NC) has an SDOCT system mounted into a rolling cart, making it portable to different scenarios within a medical center (Fig. 4). The handheld scanner is small, weighs less than 0.9 kg (2 pounds) and fits into the imager’s hand (see Fig. 4). This system has been cleared by the US Food and Drug Administration for imaging eyes of infants and children. Optovue (Freemont, CA) has an approximately 2.3-kg (5-pound) scanner head used on an armature for imaging patients in the supine position. In addition, this device has a fundus camera to allow imager guidance to the area of interest. Both systems have been used by different groups across several countries.16–18
Fig. 4.
Commercially available portable SDOCT systems useful for supine imaging. (A) Bioptigen Envisu system. 0.9-kg (2-pound) handheld scanner. Speed of 32,000 A-scans per second and 3.3-μm axial resolution for handheld imaging of premature infants to adults. (B) Optovue iStand system with a 2.3-kg (5-pound) head scanner supported by an articulating arm, with live en face image for targeting. Speed of 26,000 A-scans per second and a 5-μm axial resolution for supine patient imaging. Product labeling in 2012 for the iVue system with the iStand does not mention pediatric use. (A: Courtesy of Bioptigen, Inc., Morrisville, NC; with permission; B: Courtesy of Optovue, Inc., Fremont, CA; with permission.)
Developing an Age-Customized Protocol
Optic properties of the infant eye
There are several anatomic and optic differences in the premature eye compared with the adult eye. Dramatic ocular growth occurs during the latter months of preterm development. Investigations with ocular echography have estimated the ocular axial length of the premature infant as 15 mm at 31 weeks PMA and reported the fastest growth to take place from 32 to 52 weeks PMA19; during the neonatal period (31–52 weeks PMA), the axial length increases 0.16 mm per week and then slows down to 1 mm per year during the first 2 years of life.20 The cornea is also steeper and astigmatic in premature infants and the spherically equivalent refraction tends to be myopic, progressing toward hyperopia only after 52 weeks PMA.21,22 Based on measurements provided by Gordon and Donzis and by Cook and colleagues,23 we calculated a premature schematic eye model that simplifies the optical power of the ocular structures into a single lens calculation, which is useful in optimizing systems to image the retina (Table 3).
Table 3.
Comparison of schematic eye models for adults, newborns, and premature infants
| Schematic Eye Properties | Gullstrand Adult | Benner-Rannets Adult-Modern | Lotmar Newborn23 | Maldonado et al Premature24 |
|---|---|---|---|---|
| Total eye power (D) | 58.64 | 60 | 84.8 | 96.54 |
| Eye axial length (mm) | 24 | 24.09 | 17.49 | 15.1 |
| Anterior focal length (mm) | −17.055 | −16.67 | −11.8 | −10.35 |
| Posterior focal length (mm) | 22.78 | 22.27 | 15.74 | 13.81 |
| Corneal power (D) | 43.05 | 43.08 | 48.9 | 55.25 |
| Corneal curvature radius | 7.7 | 7.8 | 7.26 | 6.1 |
| Lens power (D) | 19.11 | 20.83 | 43.4 | 43.5 |
| Refractive error (D) | 1 | 0 | +2.8 | −1 |
| Refractive Index | ||||
| Air | 1 | 1 | 1 | 1 |
| Cornea | 1.376 | 1.377 | 1.377 | 1.377 |
| Aqueous | 1.336 | 1336 | 1.336 | 1.336 |
| Lens | 1.386 | 1.422 | 1.43 | 1.43 |
| Vitreous | 1.336 | 1.336 | 1.334 | 1.334 |
From Maldonado RS, Izatt JA, Sarin N, et al. Optimizing hand-held spectral-domain optical coherence tomography imaging for neonates, infants and children. Invest Ophthalmol Vis Sci 2010;51:2681; with permission.
Justification for an age-customized protocol
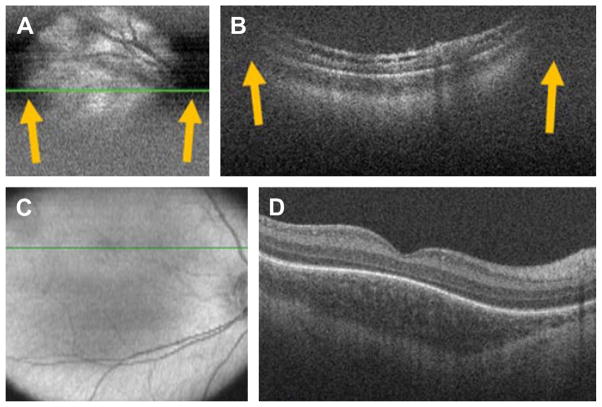
If the previously mentioned optic properties are not considered, and SDOCT in neonates or infants is performed as it would be with an adult, the following problems may be encountered (Fig. 5A, B):
Fig. 5.
SDOCT clipping correction and focus adjustment. (A, B) SDOCT scanning without age-customized protocol. Severe clipping artifacts (white arrows) on the two-dimensional retinal image (A) and on the B-scan (B) of a 38-week-old PMA infant are noted in addition to poor image quality. (C, D) Images were obtained after applying the age-customized protocol. Improved field of view in the retinal image (C) and on the B-scan (D) with improved image quality. The inner retina in (B) shows schisis in an eye with peripheral retinal detachment. The fovea in (D) shows persisting inner retinal layers in an older premature infant. (From Maldonado RS, Izatt JA, Sarin N, et al. Optimizing hand-held spectral-domain optical coherence tomography imaging for neonates, infants and children. Invest Ophthalmol Vis Sci 2010;51:2682; with permission.)
Small field of view
Magnified retinal image
Image clipping (lateral shadowing by the iris)
Poor image resolution/clarity
As a consequence, imaging in pediatric patients would remain difficult and inefficient. To correct these issues, imaging protocols need to be customized according to the infant’s eye properties based on ocular axial length. Although it would be useful to measure axial length in each infant, this is not often feasible in the nursery. Thus, to address these issues and make handheld SDOCT feasible, reproducible, and efficient, an age-customized method for performing SDOCT image capture in infants has been proposed.23 This methodology provides adjustments based on the infant’s age.
Calculating real scan length on the retina
Smaller eyes produce a magnification effect on the OCT image (see Fig. 5A). This situation is primarily a result of the shorter axial length of the eye. A correction is necessary to obtain accurate measurements in the retina. We use the infant versus adult axial length proportion to correct for the lateral magnification: thus, the OCT scan length on the infant retina equals the ratio of infant axial length/adult axial length multiplied by the expected adult OCT lateral scan length.24 In the example shown in Fig. 5C and D, the scan length entered for adult scanning by the OCT system was 11 mm. Because this infant was 38 weeks old PMA (estimated axial length of 16.1 mm), the correct scan length on the infant retina is 7 mm (36% shorter).
Reducing number of A-scans
As explained earlier, the real scan length on the retina of an infant eye is smaller than the scan size set for the adult eye on an OCT system. If the regular presets included with the system software are used, the retina may be exposed to unnecessary light for imaging. Our group proposed adjusting the number of A-scans per B-scan for SDOCT imaging in infant eyes to maintain the same scan density as in adults (Fig. 6).
Fig. 6.
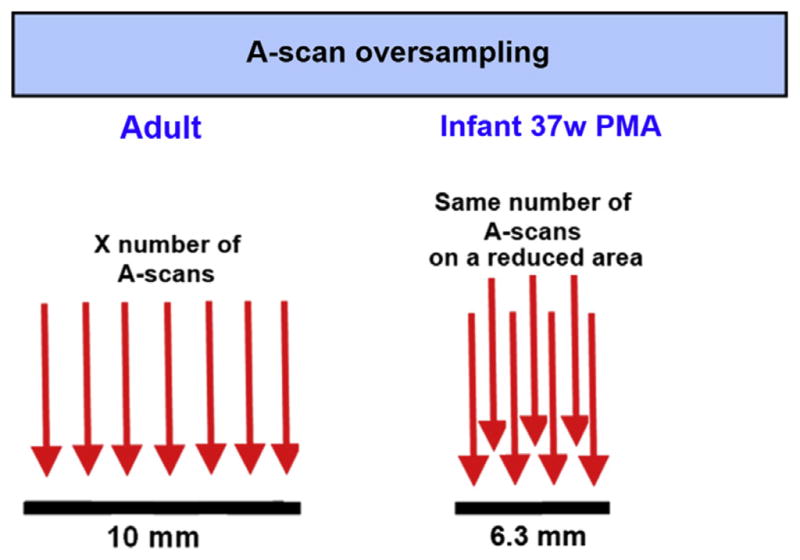
A-scan oversampling in infant retina. Because scan lengths set for an adult eye project as a shorter scan in the smaller infant eyes, the number of A-scans should be reduced to maintain the same A-scan spacing as in the adult standard eye. Most commercial SDOCT systems come with preset scans for adults, and the same settings should not be applied to infants. An ideal OCT system for infant imaging should provide the imager with the capability of modifying the number of A-scans as desired.
Improving field of view: adjusting the reference arm
The OCT beam has a pivoting point, which should be located at the level of the pupil. In shorter eyes, the pivoting point is displaced anterior to the pupil and thus the peripheral area of the image is clipped as shown in Fig. 5A and B. A correction to the reference arm position (index of refraction of the vitreous times the change in axial length of the eye) has been calculated and applied in imaging using the Bioptigen system in premature infants.24
The application of this correction provides a wider field of view, as shown in Fig. 5C and D.
GENERAL PEDIATRIC SDOCT IMAGING IN THE NEONATAL INTENSIVE CARE UNIT
Step-by-Step Procedure
A step-by-step methodology is proposed, to reduce the time spent imaging, reduce infant discomfort, and produce better imaging results. First, the infant’s age in weeks PMA, ocular refraction, and axial length are needed. The axial length and ocular refraction are generally not available but can be estimated based on the infant’s age according to biometric studies performed in infant eyes.20,21 Second, these figures are used to age-adjust the reference arm position, the focus of the lens bore of the system, and scan parameters such as scan length, number of A-scans, and number of B-scans are entered based on age. Maldonado and colleagues24 described a step-by-step lookup table convenient for performing all these adjustments.
Once all these steps have been taken, the next step is to position the baby as shown in Fig. 7 and gently open the eyelids with the tip of the imager’s fingers. No lid speculum or anesthetic drops are needed. In some instances, when the baby is restless, the imager can consider using oral sucrose. Although we normally perform SDOCT on the same day of retinopathy of prematurity (ROP) screening when the baby’s pupils are dilated, we have performed SDOCT on undilated pupils. In those cases, we found imaging to be more difficult, but we were able to image the fovea and optic nerve with success (Fig. 8).
Fig. 7.
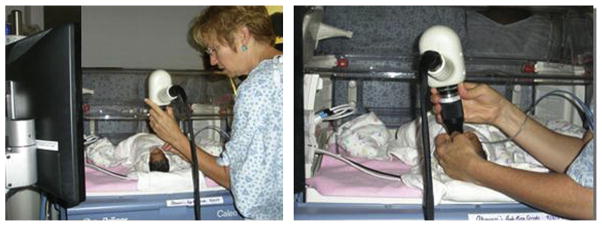
SDOCT imaging in the neonatal intensive care unit (NICU). Typical SDOCT imaging methodology in the NICU. With the infant lying comfortably in the crib (left), the imager gently opens the eyelids with the fingertips and holds the handheld SDOCT scanner over the infant’s eyes without touching the infant or the infant’s eye (right). The weight of the scanner is centered over the imager’s hand, and the distal tip of the lens system can be steadied by the fingers holding the eyelids. A second operator operates the software and captures the scans. The scanner and the infant’s head could be tilted or moved to acquire the area of interest.
Fig. 8.
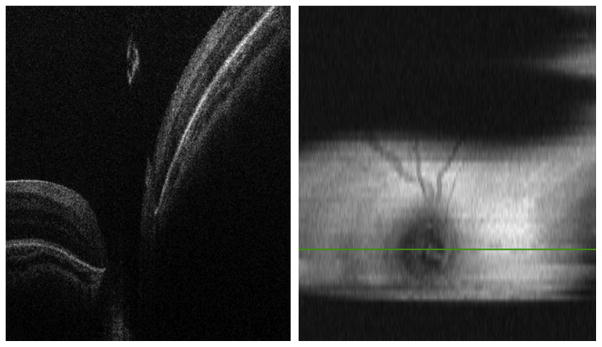
SDOCT image capturing in an infant with 3 mm pupil dilation. (Left) B-scan at the center of the optic nerve without clipping artifacts. (Right) Two-dimensional retinal image showing clipping artifacts caused by the pupil and imager/infant motion.
Impact of Applying Age-Customized Settings
In a pilot study applying the previously mentioned methodology in 113 imaging sessions,24 we reported a decrease in the time per imaging session. An adequate SDOCT image was captured in less than 1 minute in 31% of sessions, 1 to 2 minutes in 26%, and more than 2 minutes in 43%. The average time spent in an imaging session per infant was 11 minutes, including both eyes. An assessment of vital signs during imaging (heart rate, respiratory rate, and oxygen saturation) revealed no change of more than 20% from baseline in 98% of patients. No adverse events were reported by the nurses when we inquired 2 hours after the imaging session occurred.
Limitations and special situations that prevent better imaging results
Overall, this technique seems to be without discomfort for the infant. Most of the time, the infant continues sleeping and seems comfortable. The fact that we do not use a lid speculum or bright illumination such as from a fundus camera or indirect ophthalmoscope seems to help. There are some occasions when the infant seems to be restless or has, for example, a neurologic baseline problem that causes them to be constantly moving, not only their eyes but also their body. Faster low-density scans increase the chance of obtaining useful images of the fovea or optic nerve in the moving infant by reducing the time needed to complete the scans.
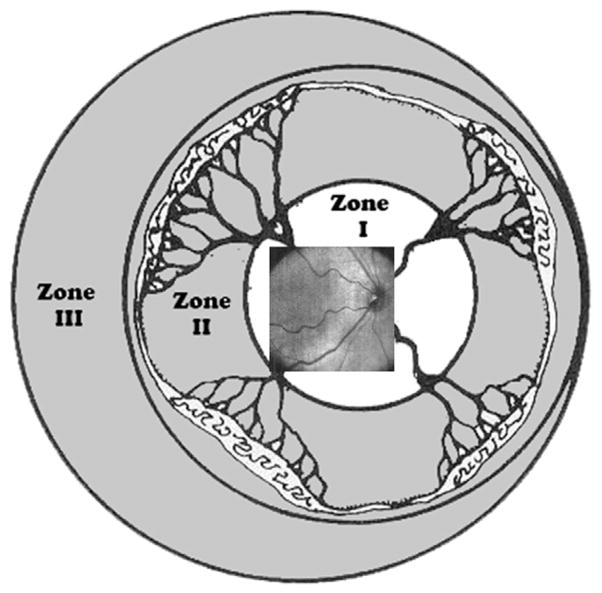
With current systems, the maximal area of SDOCT imaging covers typically only zone I (Fig. 9). Clipping caused by the pupil also prevents OCT scanning across a wider field of view, despite the age-customized protocols described earlier. During an imaging session, an experienced imager may be able to obtain more information in the periphery by scanning serially different retinal areas and making a collage of images, which could increase the field of view into zone II. Because of this situation, SDOCT is not typically effective for viewing the vascular-avascular junction.
Fig. 9.
Retinal zone imaged by SDOCT. Field of view range of retinal imaging with the portable handheld SDOCT unit. This system provides high-magnification imaging within zone I and can only infrequently capture images at the anterior border of zone I/posterior border of zone II. (From Lee AC, Maldonado RS, Sarin N, et al. Macular features from spectral-domain optical coherence tomography as an adjunct to indirect ophthalmoscopy in retinopathy of prematurity. Retina 2011;31(8):1470–82; with permission.)
Another limitation is equipment cost, which may prevent widespread use of this technique at multiple smaller medical centers.
NEW OCT IMAGING MODALITIES
Color Doppler OCT
Color Doppler OCT (CD-OCT) is a functional extension of OCT. By detecting the frequency shift of backscattered light, CD-OCT has been shown to be useful in measuring blood flow velocities and vascular perfusion. CD-OCT can provide qualitative and quantitative blood flow velocity assessments, although it is limited in clinical use because of imprecise information on the angle of the blood vessel relative to the scanning beam, which can limit precision of the data. In a laboratory experiment of fluid flow in capillary tubes, Hendargo and colleagues25 showed the color representation of flow. Flow appears in the OCT image as a uniform colored circle (Fig. 10). As flow velocity increases, colored rings appear. The number of rings is directly proportional to the flow velocity. This phenomenon is called phase wrapping. When flow velocity exceeds the limit of phase wrapping detection, the Doppler signal disappears and the washout phenomenon occurs. There are no publications using Doppler in children for evaluation of retinal disease.
Fig. 10.
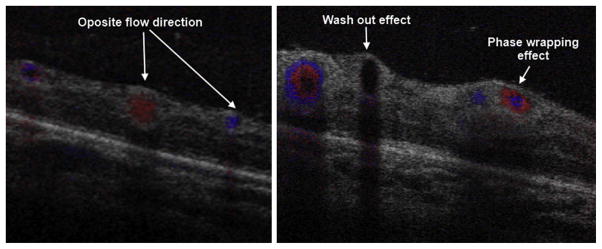
SDOCT color Doppler imaging in a 42-week-old PMA infant. The volumetric scan was of 5 × 5 mm, 500 A-scans/B-scan, 40 B-scans and 5 Doppler samples (5 repeated A-scans at each single A-scan point). The B-scans shown were located in zone I across the temporal/superior vascular arcades. (Left) B-scan distal to the optic nerve. Red and blue represent vascular flow in opposite directions with respect to the OCT beam. (Right) B-scan more proximal to the optic nerve. Red and blue rings are produced by increased flow velocity. At higher flow velocities, the Doppler signal disappears, a phenomenon known as washout effect.
Enhanced Depth Imaging
Enhanced depth imaging (EDI) enables deeper structures such as the choroid to be better evaluated. This situation is important, because the choroid provides the oxygenation and support for the photoreceptors. Choroidal thickness has recently been linked in the pathophysiology of several retinal diseases, such as central serous retinopathy and macular degeneration. SDOCT devices decrease resolution with increasing displacement from the zero delay. By displacing the zero delay of the instrument to image deeper layers, the focused portion of the illumination is at the level of the choroid and inner sclera (Fig. 11).26 There are no publications using this technique in children.
Fig. 11.
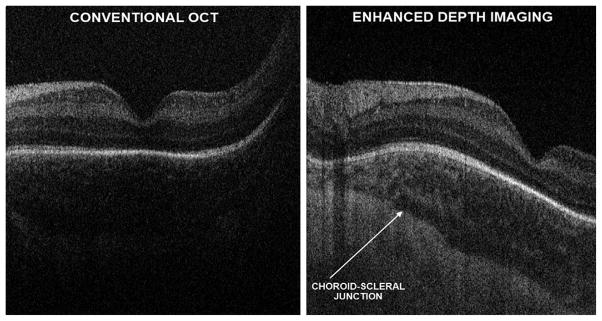
Research SDOCT imaging with and without EDI in a 38-week-old PMA infant. With conventional SDOCT, the choroid may not always be well visualized, as shown in left panel. Furthermore, the choroid-scleral junction boundary is not clearly defined in the image. On the same infant, using EDI, which does not change the SDOCT signal directed into the eye, but modifying settings for the null point (right), the choroid features could be better appreciated and the choroid-scleral junction well defined without losing resolution of the retinal layers.
ROLE OF SDOCT IN ROP: BEYOND INDIRECT OPHTHALMOSCOPY
With SDOCT performed in neonates undergoing ROP screening, subclinical findings such as preretinal tissue (popcorn retinopathy), epiretinal membranes, cystoid macular changes, retinal layer schisis, precise localization of retinal detachment, vascular changes representative of plus disease, and cellular and subcellular changes related to ROP can be identified. These findings have been described in patients with aggressive posterior ROP27 and patients with different degrees of ROP.18,28
For instance, in a study in 228 imaging sessions from 38 neonates undergoing ROP screening, Lee and colleagues28 compared findings from conventional indirect ophthalmoscopy with vitreoretinal disease detected by SDOCT. These investigators found that SDOCT was better in detecting retinal cystoid structures in 39% of imaging sessions and epiretinal membranes in 32% and that most of these distorted foveal architecture. These 2 features were not visualized by indirect ophthalmoscopy in any of the infants. In contrast to ophthalmoscopic examination, SDOCT was not able to give information regarding ROP stage, zone, or vascular abnormality such as plus or preplus.
In ROP, functional outcomes are not always related to retinal structural outcomes, although there is a good correlation.29 For example, in 606 eyes from the Early Treatment for Retinopathy of Prematurity Study (ETROP) study, Wallace and colleagues reported that 92 eyes (15.2%) had discordant outcomes: 86 eyes had unfavorable functional and favorable structural outcomes and 6 eyes had favorable functional and unfavorable structural outcomes. No OCT was available in that study, and thus the investigators could not rule out subclinical macular abnormalities. In the following sections, each ROP feature detectable with SDOCT is discussed.
Preretinal Tissue
Extraretinal isolated small masses of tissue lying over the retina can be visualized with SDOCT. We believe that these masses represent the fibrovascular isolated masses that have been described in the International Classification of ROP as isolated tissue that is not enough to meet criteria of stage 3 ROP. Traditionally, these masses have been known as popcorn retinopathy, located posterior to the ridge. OCT is an excellent methodology to evaluate preretinal tissue within zone I. Chavala and colleagues27 described preretinal tissue in aggressive posterior ROP close to the optic nerve (Fig. 12). This tissue was visualized as thick rounded masses, causing intermittent shadows on OCT, which revealed the fibrovascular nature of the tissue. The capability of SDOCT to monitor preretinal tissue at early stages of the disease may play an important role in disease monitoring; for example, Wallace and colleagues30 found that the presence of popcorn increases the risk of an eye with zone II stage 2 developing plus disease, stage 3, and requiring laser treatment.
Fig. 12.
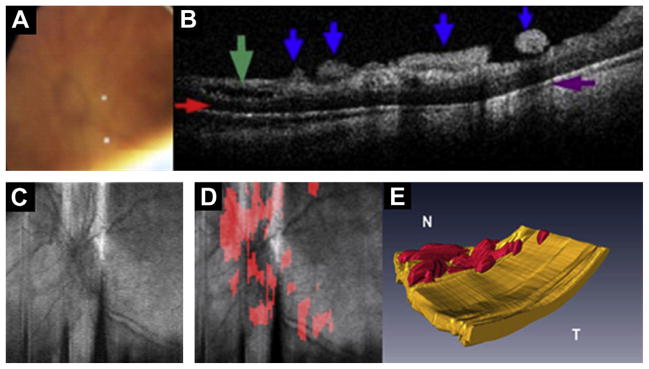
Preretinal fibrovascular tissue in aggressive posterior ROP. Images obtained from the left eye of a 23-week-old born infant imaged at 37 weeks PMA. (A) Video-indirect image of the optic nerve and posterior pole of the retina without evidence of preretinal structures. (B) SDOCT B-scan showing preretinal tissue (blue arrows), retinal schisis (green arrow), sub-retinal fluid (red arrow), and denote shadowing artifact from preretinal structures (purple arrow). (C) Retinal image of optic nerve and posterior pole. (D) Same retinal image in (C) with preretinal tissue localized (red areas in D) surrounding and overlying optic nerve. (E) Three-dimensional SDOCT image reconstruction depicts preretinal structures in the posterior pole consistent with preretinal fibrovascular tissue. (Modified from Chavala SH, Farsiu S, Maldonado R, et al. Insights into advanced retinopathy of prematurity using handheld spectral domain optical coherence tomography imaging. Ophthalmology 2009;116:2450; with permission.)
Epiretinal Membranes
Epiretinal membranes are uncommon in children. They are formed by glial cells, retinal pigment epithelium cells, macrophages, vascular endothelial cells, fibrocytes, and collagen cells. The incidence in patients younger than 19 years is 1 in 20,896 and they are mostly related to trauma, idiopathic disease, and uveitis.31 Thick epiretinal membranes have also been reported in stage 5 ROP in samples taken during vitrectomy.32
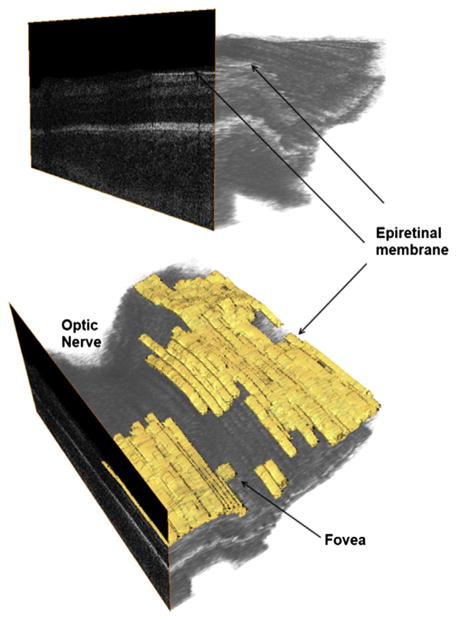
In the neonatal intensive care unit (NICU), epiretinal membranes are frequent, but these are seen generally as a thin hyperreflective line separated from the retinal surface (Fig. 13). For instance, Lee and colleagues28 detected epiretinal membranes in 74 of 236 imaging sessions (32%) from 38 neonates ages 37.5 ± 4.8 weeks PMA. None of these epiretinal membranes was detected by ophthalmoscopy. One-third of the epiretinal membranes detected in the study produced foveal contour deformation.
Fig. 13.
Epiretinal membrane (ERM) in a 37-week-old PMA infant. Epiretinal membranes are frequent in infants with ROP but appear as a very thin hyperreflective layer separated from the retina (top) in contrast to thicker membranes seen in macular pucker. The lower figure aids in localization of the ERM, which is parafoveal and away from the optic nerve.
Macular Edema of Prematurity
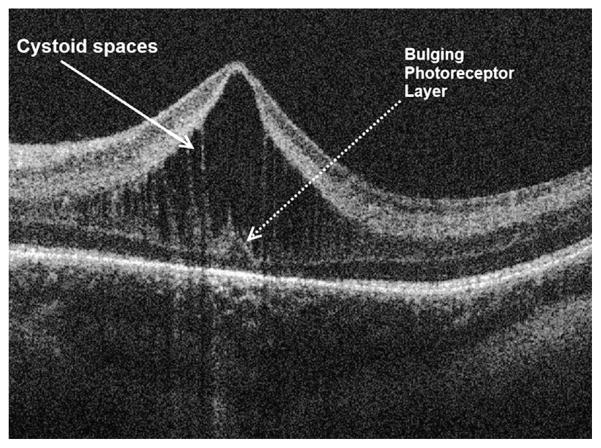
A new insight into the pathophysiology of ROP is the finding of cystoid macular edema (CME) by SDOCT in premature infants throughout the prenatal period. With the benefit of SDSOCT imaging, it is shown that macular edema is a frequent finding in premature infants during their first months of life. Prominent cystoid hyporeflective spaces are located exclusively at the level of the inner nuclear layer in premature infant eyes (Fig. 14) and appear similar to cystoid spaces detected in some cases of diabetic macular edema or postcataract surgery.9,17,28,33
Fig. 14.
Macular edema of prematurity. SDOCT cross-sectional image at the foveal center in a 38-week-old PMA infant. Prominent cystoid spaces located exclusively at the inner nuclear layer are characteristic of MEOP. Frequently, these spaces are vertically elongated and deform the fovea. Note the photoreceptor layer central dome, which is not expected at this age of development.
Because of the high frequency of this finding, plus the similar phenotype to macular edema seen in adult retinal diseases, this finding has been named macular edema of prematurity (MEOP).
In a study performed on 31 patients imaged from 31 to 42 weeks PMA (median birth weight 825 g, median gestational age 26 weeks PMA, final ROP stage <2), researchers found MEOP in 58% of patients.9 The same researchers with a larger population group but considering imaging sessions 31 to 36 weeks PMA (median birth weight 760 g, median gestation age 26 weeks PMA, ROP stage 0–3) found CME in 50% of patients.33 In both studies, CME was found in patients independently of ROP stage. Another study performed in 74 older and larger Asian-Indian neonates (average mean birth weight 1282 g, average gestational age 31 weeks PMA, ROP stages 0–2) found CME in 16% of patients, all of them with ROP stage 2, and found no CME in patients with stage 0 or 1 (Table 4).17
Table 4.
SDOCT studies in premature neonates undergoing ROP screening
| Maldonado et al33 | Vinekar et al17 | |
|---|---|---|
| Study Patient Characteristics | ||
| Number of patients | 42 | 74 |
| Body weight (g) | 760 (488–1032) | 1282 |
| Gestational age (wk PMA) | 26 (25–27) | 31 (30–33) |
| ROP stage | 0–3 | 0–2 |
| Plus | 5 | NR |
| Laser | 12 | 0 |
| Race | ||
| White | 17 (40.5) | 0 |
| African American | 22 (52.4) | 0 |
| Asian | 0 | 0 |
| Hispanic | 3 (7.1) | 0 |
| Indian | 0 | 74 (100) |
| Age at Imaging (wk) | ||
| Earliest imaging | 30 | 35 |
| Latest follow-up | 43 | 52 |
| MEOP, n (%) | ||
| CME | 21 (50) | 12 (16)a |
| CFT | 166 (91–449) | 206 (108–304) |
| CME Characteristics | ||
| Bilateral CME | 21 | NR |
| Bulging fovea | 13 (62) | 11 (47) |
| CME Resolution | ||
| CME earliest resolution | 36 | NE |
| CME latest resolution | 43 | 52 |
Abbreviations: CME, cystoid macular edema; NR, not reported.
23 eyes from a total of 146 eyes with ROP stages 0–2.
The studies mentioned earlier showed that MEOP is a transient event but the duration of edema is not well characterized. MEOP has been detected as early as 31 weeks PMA and resolved on its own. Vinekar and colleagues17 showed CME resolution in 100% of patients. Maldonado and colleagues33 reported resolution of CME as early as 36 weeks PMA, and the oldest age at which CME persisted was 43 weeks PMA. MEOP seems to be bilateral in most cases.
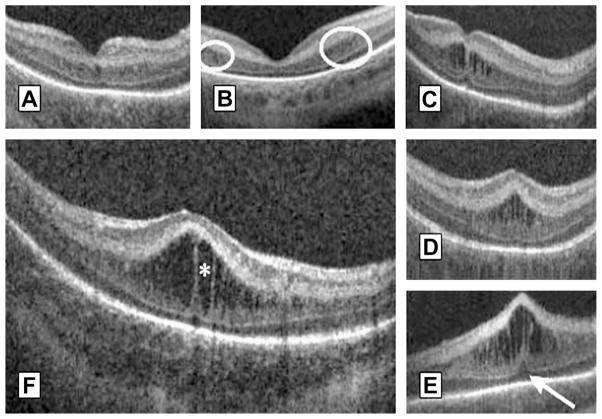
MEOP has different phenotypes and severity. Maldonado and colleagues33 presented a morphologic classification of MEOP according to number, shape, location of cystoid structures, foveal pit morphology, and photoreceptor involvement (Fig. 15). Vinekar and colleagues17 divided MEOP in 2 patterns: 1 with a dome-shaped fovea and 1 with preservation of foveal morphology. Both studies reported the bulging fovea with vertical elongated cysts to be the most prevalent.
Fig. 15.
Morphologic characteristics and phenotypes of MEOP in 42 prematurely born infants ages 31 to 37 weeks PMA. Three CME phenotypes were observed in the patients: (A) single central; (B) Parafoveal (when cystoid structures were grouped around the foveal center as shown within the white encircled areas), and (C) multiple elongated cystoid structures when the parafoveal and central fovea contained cystoid structures. For the multiple elongated CME phenotype, severity was scored as mild (C) if the foveal pit was present; moderate (D) if the fovea was bulging but Photoreceptor layer (PRL) was not affected and severe (E) when the fovea and PRL had a bulging shape (white arrow). (F) Magnified SDOCT scan to show morphologic characteristics found in severe CME. White asterisk is located within a cystoid space. (From Maldonado RS, O’Connell R, Ascher SB, et al. Spectral-domain optical coherence tomographic assessment of severity of cystoid macular edema in retinopathy of prematurity. Arch Ophthalmol 2012;130(5):572; with permission.)
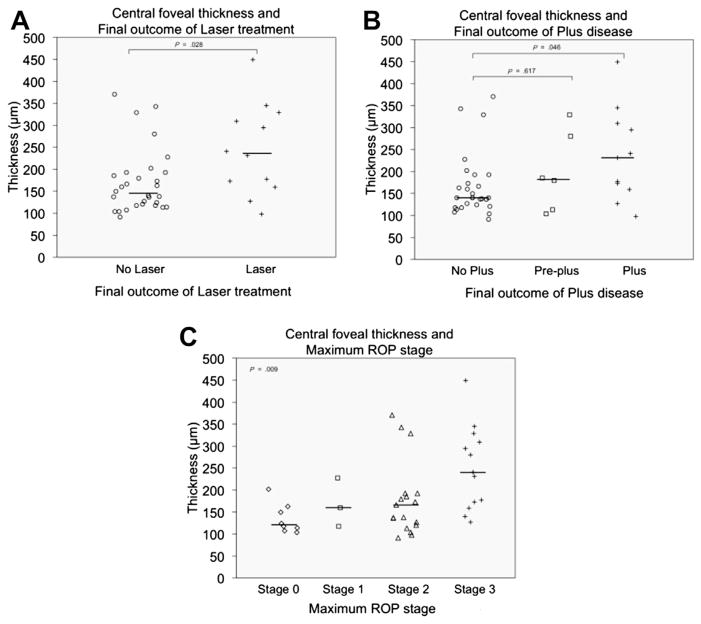
Using robust image segmentation techniques, we have been able to provide a quantitative assessment of MEOP. Central foveal thickness (CFT) was found to be similar between both eyes of all patients, confirming the bilateral nature of this finding. The severity of MEOP, represented by CFT measurements, varied from 113 to 449 μm. This measure of CME severity in SDOCT imaging before 36 weeks PMA was found to be associated with final ROP disease stage and need for laser treatment (see Table 5; Fig. 16).33 The bulge of the fovea was also objectively recorded in these infants using the ratio of foveal thickness/parafoveal thickness (1000 μm from foveal center) (foveal/parafoveal ratio) and found to be associated with final ROP disease stage and need for laser treatment.33
Table 5.
Association of cystoid macular edema severity markers to ROP outcome found in 42 neonates imaged before 37 weeks PMA
| Retinal Measurement | Median (Range)
|
P Value
|
||||||
|---|---|---|---|---|---|---|---|---|
| Progression to Laser Treatment in Study Eye
|
Vascular Outcome in Study Eye
|
|||||||
| No (n = 30) | Yes (n = 12) | P Value | No Plus (n = 25) | Preplus (n = 6) | Plus (n = 11) No Plus | Plus vs No Plus | Preplus vs No Plus | |
| CFT (μm) | 145 (91–370) | 236 (98–449) | .03 | 140 (91–370) | 182 (104–329) | 231 (98–449) | .046 | .62 |
|
| ||||||||
| IRL thickness (μm) | 108 (58–328) | 194 (68–384) | .02 | 106 (65–328) | 130 (58–215) | 194 (68–384) | .02 | .74 |
|
| ||||||||
| INL thickness (μm) | 65 (32–263) | 102 (46–316) | .11 | 65 (39–263) | 55 (32–160) | 102 (46–316) | .14 | .40 |
|
| ||||||||
| PRL thickness (μm) | 33 (13–65) | 42 (22–59) | .20 | 29 (13–65) | 46 (36–55) | 42 (22–59) | .10 | .80 |
|
| ||||||||
| Foveal/parafoveal ratio | 0.65 (0.40–1.51) | 1.09 (0.48–1.46) | .02 | 0.64 (0.40–1.36) | 0.80 (0.43–1.51) | 0.96 (0.48–1.46) | .03 | .50 |
Abbreviations: CFT, central foveal thickness; CME, cystoid macular edema; FP, foveal-to-parafoveal; INL, inner nuclear layer; IRL, inner retinal layer; PRL, photoreceptor layer.
From Maldonado RS, O’Connell R, Ascher SB, et al. Spectral-domain optical coherence tomographic assessment of severity of cystoid macular edema in retinopathy of prematurity. Arch Ophthalmol 2012;130(5):569–78; with permission.
Fig. 16.
CFT data distribution in premature infants imaged before 37 weeks PMA by final ROP outcome. The median CFT was significantly greater in the laser group than in the non-laser group (A), in the plus disease group than in the normal vasculature group (B), and in maximum stage 3 group than in patients with stages 0, 1, or 2 (C). (From Maldonado RS, O’Connell R, Ascher SB, et al. Spectral-domain optical coherence tomographic assessment of severity of cystoid macular edema in retinopathy of prematurity. Arch Ophthalmol 2012;130(5):573; with permission.)
Now that the occurrence of MEOP in ROP is known, further research is needed to clarify questions about this event. Although MEOP is frequent and transient in premature infant eyes before term, it is still unclear if MEOP is a pathologic event or a transient local reaction during the first months of life in prematurely born neonates. In this regards, it is known that CME does not occur in healthy full-term neonates; Cabrera and colleagues34 in a prospective observational study of 39 healthy full-term neonates did not find CME. In that study, 15% of neonates had subfoveal fluid similar to central serous retinopathy, which is a different event compared with CME. In premature infants, systemic factors such as gestational weight, birth weight, gender, race, surgery for Patent ductus arteriosus (PDA), sepsis, surgery for necrotizing enterocolitis (NEC), intraventricular hemorrhage, periventricular leukomalacia, bronchopulmonary dysplasia, and hydrocephalus have been evaluated and found not to be associated with the presence of MEOP.
There are some elements to support a possible pathologic role of MEOP. Number 1 is the fact that macular edema does not occur in all prematurely born neonates. Number 2 is the fact that it is exclusive to prematurely born neonates and not to healthy full-term neonates. Number 3 is the association found between MEOP severity and ROP outcome. Number 4 is the increased foveal thickness and abnormal foveal maturation found in older children with a history of ROP. Number 5 is the higher prevalence and severity of macular edema in infants of lower gestational age and lower birth weight.
If MEOP is a pathologic event, factors such as timing, duration, and severity of MEOP may be crucial in determining if foveal development and specifically photoreceptor development are affected. Visual function testing is needed to determine if MEOP has an adverse effect on normal foveal development or future visual acuity.
Peripheral Retina, Retinoschisis, and Retinal Detachments: 4A Versus 4B
As discussed earlier, OCT is restricted to imaging the posterior pole. In a single volumetric scan, SDOCT can cover zone I ROP. If the handheld probe is tilted, the posterior zone II could be imaged. Fig. 17 presents an example of stage 3 ROP obtained by tilting the probe toward the periphery. Muni and colleagues18 also reported an image of stage 3 in a patient with ROP in zone I.
Fig. 17.
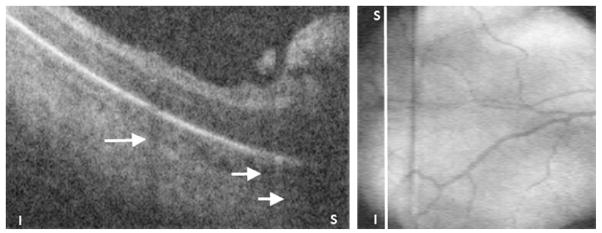
Preretinal tissue corresponding to ROP stage 3 in a 32-week-old PMA infant. (Left) SDOCT B-scan of the periphery of zone I. The ridge and likely neovascularization appear as an elevated preretinal mass separated from the retina in some segments. These preretinal tissue cast shadows (short white arrows) because of its vascular component similar to the shadowing from retinal vessels (longer white arrow). (Right) Corresponding retinal image showing the location of the B-scan from left panel (white line).
The determination of macular or foveal involvement in ROP retinal detachment is important in decision making and in predicting visual outcomes, and SDOCT imaging may be useful in making this determination. Not all eyes with 4A retinal detachment have a good functional outcome. Prener and colleagues35 reported vision worse than 20/80 in 30% of cases undergoing pars-plana vitrectomy (PPV) for 4A detachment. Joshi and colleagues15 showed the usefulness of OCT in determining foveal architecture abnormalities before surgery, which could explain why some patients did not do well despite a successfully attached retina. With SDOCT, the area detached can be mapped out and it can be distinguished with certainty if the fovea is involved or not, as shown in Fig. 18.
Fig. 18.
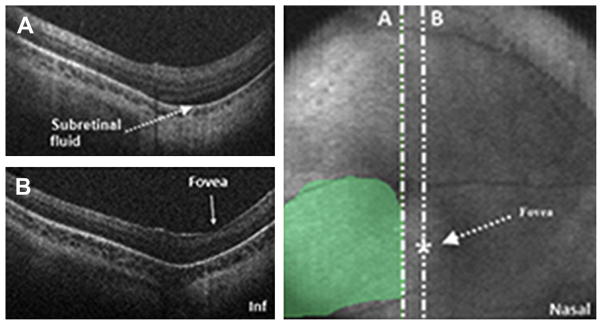
SDOCT value in determination of foveal involvement in cases of retinal detachment. SDOCT imaging session performed in an infant diagnosed with retinal detachment caused by ROP. A 6 × 6 volumetric SDOCT scan of 80 B-scans was captured. Subretinal fluid was detected (A) and confirmed the retinal detachment. The fovea had no subretinal fluid present (B). Subretinal fluid was traced over the retinal image for estimation of retinal detachment size and localization.
Plus Disease
Plus disease is the most important clinical marker in ROP screening, essentially because it is the primary indication for laser treatment. The revised International Classification of ROP36 defined a minor degree of vascular dilation and tortuosity named preplus, which has been shown to be predictive of progression to severe ROP requiring laser. Despite the clinical importance of these markers, there is disagreement among expert ROP examiners concerning plus and preplus.37 Current research is aimed toward a more objective quantification of vascular dilation and tortuosity with computer software.
OCT can provide further insight in to vascular disease by showing the anatomic changes occurring in plus disease. For example, with OCT and three-dimensional reconstruction of OCT datasets, vessel tortuosity can be observed to occur in not only 2 dimensions but also in the third dimension across the depth of the retina. Furthermore, OCT characteristics are noted in the cross-sectional images that occur in plus disease such as vessel dilation and washout phenomenon, with Doppler imaging representing increased blood flow.
ROP, Choroid, and Photoreceptor Development
ROP affects the normal development of the human fovea. Studies performed in older children with a history of ROP have shown significantly higher CFT compared with controls.38–40 Although it is commonly agreed that normal foveal development may be affected by ROP, until now it was not possible to assess when the insult affected the fovea. For the first time in history, we are able to observe, track, and quantify the in vivo development of the human fovea.9 Maldonado and colleagues reported on foveal development from 31 weeks PMA up to adulthood, describing, with segmentation techniques, the centrifugal migration of retinal layer thickness and centripetal growth of photoreceptors. Furthermore, SDOCT studies performed during the period of foveal development were validated by comparing OCT images with histologic samples.10,41 Choroid is another ocular element that might be affected or abnormal in ROP, and its relation to photoreceptor development is under evaluation.
DIFFERENT CLINICAL SCENARIOS
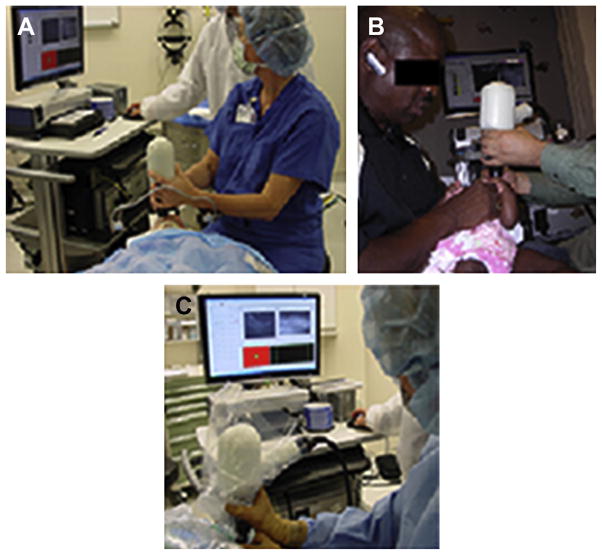
Portable SDOCT has the capability to accommodate a range of infant and child imaging. In this article, the application of SDOCT in the NICU is presented, which is perhaps the most challenging application, but other scenarios should also be mentioned, such as applications in clinic to imaging older infants with a history of ROP, or those who present with possible retinal disorder or unexplained decrease in vision with nystagmus, albinism, a history of trauma, or other optic nerve and retinal diseases. Between ages 6 months and 3 to 4 years, it may be difficult to approach the face of the young child for SDOCT imaging. SDOCT has been used during examinations under anesthesia and intraoperatively to differentiate retinal detachments involving the fovea and in older children with a history of ROP and to identify extent of epiretinal membranes and macular deformation (Fig. 19).
Fig. 19.
Application of portable SDOCT in different clinical scenarios. In addition to the application of SDOCT in the NICU for infants undergoing ROP screening, portable SDOCT technology has been used, and published data have contributed to understanding of diverse retinal disease in infants and children undergoing examination under anesthesia (A), in the ophthalmologic pediatric clinic (B), and intraoperatively (C).
MAKING SENSE OF DATA
Segmentation Techniques
Robust segmentation techniques have been developed for studying adult retinal diseases. A customized segmentation technique was developed by Chiu and colleagues42 to segment pediatric scans, which differ from adult scans in the number of layers at the foveal center (Fig. 20). This approach provides a more precise assessment of diseases and is semiautomatic.
Fig. 20.
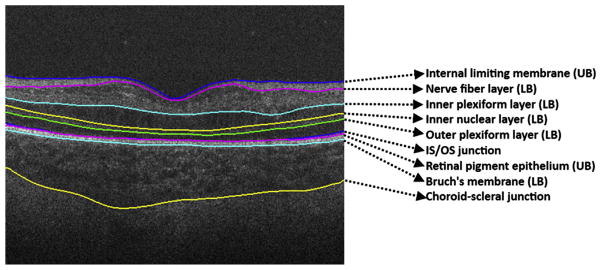
Retinal layer segmentation on pediatric scans. Retinal layer boundaries segmented by DOCTRAP software. Nine retinal boundaries are detected and from these, retinal layer thicknesses can be calculated automatically.
Three-Dimensional Volume Rendering and Retinal Thickness Maps
Our laboratory has used computer software such as ImageJ (National Institutes of Health, Bethesda, MD, USA), MatLab (MathWorks, Natick, MA, USA), AVIZO (VSG Group, Burlington, MA, USA), and custom software to create three-dimensional data sets to map structures, shapes, and abnormalities. As shown in Fig. 21, retinal vessels, subretinal fluid, and preretinal tissue, among other features, can be localized to provide additional spatial information for understanding pathologic events and the foveal extent of abnormalities.
Fig. 21.
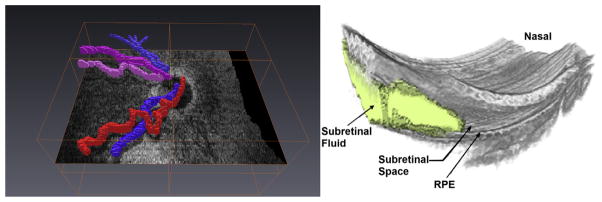
Three-dimensional reconstruction from SDOCT scans captured in infants. Retinal vessels segmented (left) show tortuosity and help in distinguishing arterioles from venules. Subretinal fluid, retinal elevation, and retinal contour visualized in 3 dimensions using manual segmentation of subretinal fluid.
THE FUTURE
Combining current SDOCT system capabilities with a proper imaging methodology has proved the usefulness of OCT in providing novel information for the infant retina. This achievement is being translated into better understanding of structures, developmental mechanisms, and disease in ROP and other retinal diseases. Portable SDOCT takes us beyond the classic view of the retina and retinal vasculature. The information gathered by this imaging technology on the retina, choroid, and vessels may bring new insights in the pathophysiology of ROP.
Hardware modifications could enhance the usefulness of this imaging technology. For example, an increased SDOCT field of view may be of great use for evaluation of peripheral zones of ROP and extramacular retinal disease in infants. This modality will be useful in evaluating the avascular area and the vascular-avascular junction in ROP. Faster scanning could also be achieved with swept-source systems,43 which can perform ultrahigh-speed imaging at more than 300,000 A-scans per second (see Table 1). This development could allow easier scan acquisition in restless babies or patients with nystagmus and would allow better Doppler imaging by reducing the scanning time required. Additional longitudinal studies relating the developmental and anomalous microanatomy to visual function outcomes are imperative to interpret infant anatomic OCT findings.
It is hoped that identifying early in the development of ROP eyes at greatest risk for lower visual acuity or other poor outcomes will allow for better and potentially new therapies for the disease. Furthermore, SDOCT may provide novel measurable end points for future treatments. It is an exciting present and a promising future for understanding mechanisms leading to different outcomes from ROP.
KEY POINTS.
Optical Coherence Tomography (OCT) is a relatively new imaging technology capable of imaging ocular structures in cross section at high resolution. Utilizing this imaging modality one can visualize the retina, choroid and optic nerve at microscopic level.
An age-customized approach to perform OCT in neonates, infants and children is necessary to improve image quality and efficacy. Time per imaging session is also reduced.
OCT can provide sub-clinical information.
OCT can show the in-vivo maturation of the human fovea at the cellular and sub-cellular level.
Spectral Domain OCT is a faster OCT modality that allows acquisition of retinal volumetric scans. Other new SDOCT modalities such as enhanced depth imaging (EDI) and color doppler are discussed.
Acknowledgments
Funding for this research was provided by The Hartwell Foundation; Research to Prevent Blindness and Grant 1UL1 RR024128-01 from the National Center for Research Resources (NCRR), a component of the National Institutes of Health (NIH); and NIH Roadmap for Medical Research. Dr. Toth receives other research support from Bioptigen.
References
- 1.Huang D, Swanson EA, Lin CP, et al. Optical coherence tomography. Science. 1991;22:254. doi: 10.1126/science.1957169. [DOI] [PMC free article] [PubMed] [Google Scholar]
- 2.Wojtkowski M, Leitgeb R, Kowalczyk A, et al. In vivo human retinal imaging by Fourier domain optical coherence tomography. J Biomed Opt. 2002;7(3):457–63. doi: 10.1117/1.1482379. [DOI] [PubMed] [Google Scholar]
- 3.Yaqoob Z, Wu J, Yang C. Spectral domain optical coherence tomography: a better OCT imaging strategy. Biotechniques. 2005;39(Suppl 6):S6–13. doi: 10.2144/000112090. [DOI] [PubMed] [Google Scholar]
- 4.Liu B, Brezinski ME. Theoretical and practical considerations on detection performance of time domain, Fourier domain, and swept source optical coherence tomography. J Biomed Opt. 2012;12(4):044007. doi: 10.1117/1.2753410. [DOI] [PubMed] [Google Scholar]
- 5.Potsaid B, Baumann B, Huang D, et al. Ultrahigh speed 1050nm swept source/Fourier domain OCT retinal and anterior segment imaging at 100,000 to 400,000 axial scans per second. Opt Express. 2011;18(19):20029–48. doi: 10.1364/OE.18.020029. [DOI] [PMC free article] [PubMed] [Google Scholar]
- 6.Fercher AF. Optical coherence tomography–development, principles, applications. Z Med Phys. 2010;20(4):251–76. doi: 10.1016/j.zemedi.2009.11.002. [DOI] [PubMed] [Google Scholar]
- 7.Martin DF, Maguire MG, Fine SL, et al. Ranibizumab and bevacizumab for treatment of neovascular age-related macular degeneration: two-year results. Ophthalmology. 2012;119(7):1388–98. doi: 10.1016/j.ophtha.2012.03.053. [DOI] [PMC free article] [PubMed] [Google Scholar]
- 8.DeCroos FC, Toth CA, Stinnett SS, et al. Optical coherence tomography grading reproducibility during the comparison of age-related macular degeneration treatments trials. Ophthalmology. 2012;119(12):2549–57. doi: 10.1016/j.ophtha.2012.06.040. [DOI] [PMC free article] [PubMed] [Google Scholar]
- 9.Maldonado RS, O’Connell RV, Sarin N, et al. Dynamics of human foveal development after premature birth. Ophthalmology. 2011;118(12):2315–25. doi: 10.1016/j.ophtha.2011.05.028. [DOI] [PMC free article] [PubMed] [Google Scholar]
- 10.Vajzovic L, Hendrickson AE, O’Connell RV, et al. Maturation of the human fovea: correlation of spectral-domain optical coherence tomography findings with histology. Am J Ophthalmol. 2012;154(5):779–789. e2. doi: 10.1016/j.ajo.2012.05.004. [DOI] [PMC free article] [PubMed] [Google Scholar]
- 11.Stopa M, Bower BA, Davies E, et al. Correlation of pathologic features in spectral domain optical coherence tomography with conventional retinal studies. Retina. 2008;28(2):298–308. doi: 10.1097/IAE.0b013e3181567798. [DOI] [PubMed] [Google Scholar]
- 12.World Health Organization. A Global Overview of Blindness, Childhood and VISION 2020 The Right to Sight. London, UK: 2010. Vision for Children. [Google Scholar]
- 13.Foster A. Childhood blindness. Eye (Lond) 1988;2(Suppl):S27–36. doi: 10.1038/eye.1988.131. [DOI] [PubMed] [Google Scholar]
- 14.Vinekar A, Sivakumar M, Shetty R, et al. A novel technique using spectral-domain optical coherence tomography (Spectralis, SD-OCT+HRA) to image supine non-anaesthetized infants: utility demonstrated in aggressive posterior retinopathy of prematurity. Eye (Lond) 2010;24(2):379–82. doi: 10.1038/eye.2009.313. [DOI] [PubMed] [Google Scholar]
- 15.Joshi MM, Trese MT, Capone A. Optical coherence tomography findings in stage 4A retinopathy of prematurity: a theory for visual variability. Ophthalmology. 2006;113(4):657–60. doi: 10.1016/j.ophtha.2006.01.007. [DOI] [PubMed] [Google Scholar]
- 16.Giordano VE, Hernandez-Vargas JA, Schoonewolff F. Comparison of optical coherence tomography macular findings in 5 year old patients with a history of pre-threshold or threshold retinopathy of prematurity treated with intravitreal bevacizumab as monotherapy. ARVO meeting; Fort Lauderdale, FL. 2012. [Google Scholar]
- 17.Vinekar A, Avadhani K, Sivakumar M, et al. Understanding clinically undetected macular changes in early retinopathy of prematurity on spectral domain optical coherence tomography. Invest Ophthalmol Vis Sci. 2011;52(8):5183–8. doi: 10.1167/iovs.10-7155. [DOI] [PubMed] [Google Scholar]
- 18.Muni RH, Kohly RP, Charonis AC, et al. Retinoschisis detected with handheld spectral-domain optical coherence tomography in neonates with advanced retinopathy of prematurity. Arch Ophthalmol. 2010;128(1):57–62. doi: 10.1001/archophthalmol.2009.361. [DOI] [PubMed] [Google Scholar]
- 19.Mactier H, Maroo S, Bradnam M, et al. Ocular biometry in preterm infants: implications for estimation of retinal illuminance. Invest Ophthalmol Vis Sci. 2008;49(1):453–7. doi: 10.1167/iovs.07-0540. [DOI] [PubMed] [Google Scholar]
- 20.Gordon RA, Donzis PB. Refractive development of the human eye. Arch Ophthalmol. 1985;103(6):785–9. doi: 10.1001/archopht.1985.01050060045020. [DOI] [PubMed] [Google Scholar]
- 21.Cook A, White S, Batterbury M, et al. Ocular growth and refractive error development in premature infants with or without retinopathy of prematurity. Invest Ophthalmol Vis Sci. 2008;49(12):5199–207. doi: 10.1167/iovs.06-0114. [DOI] [PubMed] [Google Scholar]
- 22.Fledelius HC, Fledelius C. Eye size in threshold retinopathy of prematurity, based on a Danish preterm infant series: early axial eye growth, pre- and postnatal aspects. Invest Ophthalmol Vis Sci. 2012;53(7):4177–84. doi: 10.1167/iovs.12-9516. [DOI] [PubMed] [Google Scholar]
- 23.Lotmar W. A theoretical model for the eye of new-born infants. Albrecht Von Graefes Arch Klin Exp Ophthalmol. 1976;198(2):179–85. doi: 10.1007/BF00410018. [DOI] [PubMed] [Google Scholar]
- 24.Maldonado RS, Izatt JA, Sarin N, et al. Optimizing hand-held spectral domain optical coherence tomography imaging for neonates, infants, and children. Invest Ophthalmol Vis Sci. 2010;51(5):2678–85. doi: 10.1167/iovs.09-4403. [DOI] [PMC free article] [PubMed] [Google Scholar]
- 25.Hendargo HC, McNabb RP, Dhalla AH, et al. Doppler velocity detection limitations in spectrometer-based versus swept-source optical coherence tomography. Biomed Opt Express. 2011;2(8):2175–88. doi: 10.1364/BOE.2.002175. [DOI] [PMC free article] [PubMed] [Google Scholar]
- 26.Spaide RF, Koizumi H, Pozzoni MC, et al. Enhanced depth imaging spectral-domain optical coherence tomography. Am J Ophthalmol. 2008;146(4):496–500. doi: 10.1016/j.ajo.2008.05.032. [DOI] [PubMed] [Google Scholar]
- 27.Chavala SH, Farsiu S, Maldonado R, et al. Insights into advanced retinopathy of prematurity using handheld spectral domain optical coherence tomography imaging. Ophthalmology. 2009;116(12):2448–56. doi: 10.1016/j.ophtha.2009.06.003. [DOI] [PMC free article] [PubMed] [Google Scholar]
- 28.Lee AC, Maldonado RS, Sarin N, et al. Macular features from spectral-domain optical coherence tomography as an adjunct to indirect ophthalmoscopy in retinopathy of prematurity. Retina. 2011;31(8):1470–82. doi: 10.1097/IAE.0b013e31821dfa6d. [DOI] [PMC free article] [PubMed] [Google Scholar]
- 29.Wallace DK, Bremer DL, Good WV, et al. Correlation of recognition visual acuity with posterior retinal structure in advanced retinopathy of prematurity. Arch Ophthalmol. 2012;130(12):1512–6. doi: 10.1001/archophthalmol.2012.2118. [DOI] [PubMed] [Google Scholar]
- 30.Wallace DK, Kylstra JA, Greenman DB, et al. Significance of isolated neovascular tufts (‘popcorn’) in retinopathy of prematurity. J AAPOS. 1998;2(1):52–6. doi: 10.1016/s1091-8531(98)90111-2. [DOI] [PubMed] [Google Scholar]
- 31.Khaja HA, McCannel CA, Diehl NN, et al. Incidence and clinical characteristics of epiretinal membranes in children. Arch Ophthalmol. 2008;126(5):632–6. doi: 10.1001/archopht.126.5.632. [DOI] [PMC free article] [PubMed] [Google Scholar]
- 32.Fei P, Zhao PQ, Chen RJ, et al. Histopathological study of epiretinal membranes in retinopathy of prematurity. Zhonghua Yan Ke Za Zhi. 2008;44(7):629–33. [in Chinese] [PubMed] [Google Scholar]
- 33.Maldonado RS, O’Connell R, Ascher SB, et al. Spectral-domain optical coherence tomographic assessment of severity of cystoid macular edema in retinopathy of prematurity. Arch Ophthalmol. 2012;130(5):569–78. doi: 10.1001/archopthalmol.2011.1846. [DOI] [PMC free article] [PubMed] [Google Scholar]
- 34.Cabrera MT, Maldonado RS, Toth CA, et al. Subfoveal fluid in healthy full-term newborns observed by handheld spectral-domain optical coherence tomography. Am J Ophthalmol. 2012;153(1):167–75. doi: 10.1016/j.ajo.2011.06.017. [DOI] [PMC free article] [PubMed] [Google Scholar]
- 35.Prenner JL, Capone A, Trese MT. Visual outcomes after lens-sparing vitrectomy for stage 4A retinopathy of prematurity. Ophthalmology. 2004;111(12):2271–3. doi: 10.1016/j.ophtha.2004.06.021. [DOI] [PubMed] [Google Scholar]
- 36.International Committee for the Classification of Retinopathy of Prematurity. The International Classification of Retinopathy of Prematurity revisited. Arch Ophthalmol. 2005;123(7):991–9. doi: 10.1001/archopht.123.7.991. [DOI] [PubMed] [Google Scholar]
- 37.Wallace DK, Quinn GE, Freedman SF, et al. Agreement among pediatric ophthalmologists in diagnosing plus and pre-plus disease in retinopathy of prematurity. J AAPOS. 2008;12(4):352–6. doi: 10.1016/j.jaapos.2007.11.022. [DOI] [PMC free article] [PubMed] [Google Scholar]
- 38.Children F, Ecsedy M, Szamosi A, et al. A comparison of macular structure imaged by optical coherence tomography in preterm and full-term children. Invest Ophthalmol Vis Sci. 2007;48(11):5207–11. doi: 10.1167/iovs.06-1199. [DOI] [PubMed] [Google Scholar]
- 39.Park KA, Oh SY. Analysis of spectral-domain optical coherence tomography in preterm children: retinal layer thickness and choroidal thickness profiles. Invest Ophthalmol Vis Sci. 2012;53(11):7201–7. doi: 10.1167/iovs.12-10599. [DOI] [PubMed] [Google Scholar]
- 40.Recchia FM, Recchia CC. Foveal dysplasia evident by optical coherence tomography in patients with a history of retinopathy of prematurity. Retina. 2006;27(9):1221–6. doi: 10.1097/IAE.0b013e318068de2e. [DOI] [PubMed] [Google Scholar]
- 41.Dubis AM, Costakos DM, Subramaniam CD, et al. Evaluation of normal human foveal development using optical coherence tomography and histologic examination. Arch Ophthalmol. 2012;130(10):1291–300. doi: 10.1001/archophthalmol.2012.2270. [DOI] [PMC free article] [PubMed] [Google Scholar]
- 42.Chiu SJ, Li XT, Nicholas P, et al. Automatic segmentation of seven retinal layers in SDOCT images congruent with expert manual segmentation. Opt Express. 2010;18(18):19413. doi: 10.1364/OE.18.019413. [DOI] [PMC free article] [PubMed] [Google Scholar]
- 43.Drexler W, Fujimoto JG. State-of-the-art retinal optical coherence tomography. Prog Retin Eye Res. 2008;27(1):45–88. doi: 10.1016/j.preteyeres.2007.07.005. [DOI] [PubMed] [Google Scholar]


