Abstract
Steroid receptors assemble at DNA response elements as dimers, resulting in coactivator recruitment and transcriptional activation. Our work has focused on dissecting the energetics associated with these events and quantitatively correlating the results with function. A recent finding is that different receptors dimerize with large differences in energetics. For example, estrogen receptor-α (ER-α) dimerizes with a ΔG = −12.0 kcal/mol under conditions in which the glucocorticoid receptor (GR) dimerizes with a ΔG ≤ −5.1 kcal/mol. To determine the molecular forces responsible for such differences, we created a GR/ER chimera, replacing the hormone-binding domain (HBD) of GR with that of ER-α. Cellular and biophysical analyses demonstrate that the chimera is functionally active. However, GR/ER dimerization energetics are intermediate between the parent proteins and coupled to a strong ionic linkage. Since the ER-α HBD is the primary contributor to dimerization, we suggest that GR residues constrain an ion-regulated HBD assembly reaction.
Keywords: glucocorticoid receptor, estrogen receptor, protein-DNA interactions, quantitative footprinting, analytical ultracentrifugation, thermodynamics
Introduction
Steroid receptors comprise a family of ligand-activated transcription factors [1]. The members include the androgen receptor (AR); the two estrogen receptor isoforms (ER-α and ER-β); the glucocorticoid receptor (GR); the mineralocorticoid receptor (MR); and the two progesterone receptor isoforms (PR-A and PR-B). As shown in Figure 1A, all receptors share a centrally located DNA binding domain (DBD), a C-terminal hormone-binding domain (HBD) and a natively disordered N-terminal region. The HBD is thought to be primarily responsible for receptor dimerization in the absence of DNA. Additionally, like the N-terminal region, it contains a transcriptional activation function (AF).
Figure 1. Schematic representation of human steroid receptors, receptor-promoter binding, and chimeric GR/ER receptor.

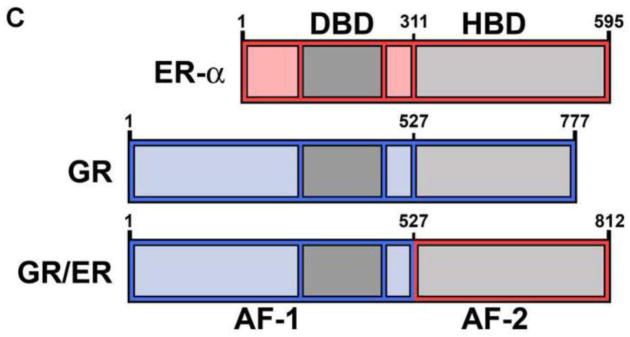
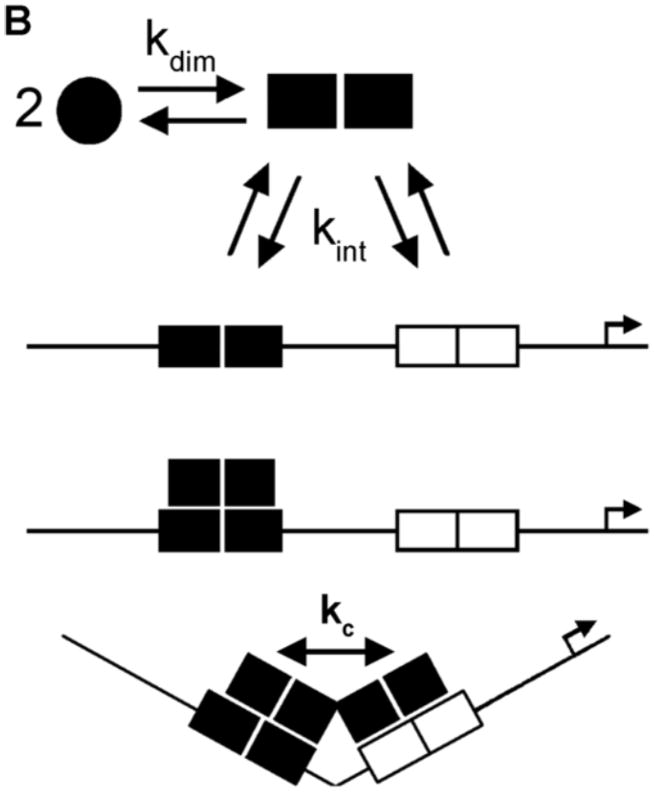
(A) Generic primary structure schematic. Functional domains are as indicated: DBD, DNA binding domain; HBD, hormone binding domain. An activation function is located within both the N-terminal region and the HBD (AF-1 and AF-2, respectively) (B) HRE2 promoter assembly model. Macromolecular species and interactions are as indicated: circles, hormone-bound receptor monomers; squares, receptor dimers. Dimerization (kdim) is coupled to response element binding (kint); complete occupancy is coupled to an inter-site cooperative interaction (kc). Arrow refers to the direction of transcriptional start site. (C) Chimeric GR/ER; N-terminal region and DBD of GR is fused to the HBD of ER-α. Amino acid number is indicated above each receptor. Functional regions are as indicated for Panel A.
The biochemical model of receptor function posits that upon binding hormone, the receptors translocate to the nucleus, dimerize, and bind to imperfect palindromic response elements typically located upstream of transcriptional start sites. Response element binding is coupled to coactivator recruitment and subsequent transcriptional activation [1]. Although this model has provided a strong qualitative framework for function, it nonetheless remains incomplete. For example, all steroid receptors bind identical or nearly identical response elements in vitro yet regulate distinct but overlapping gene networks in vivo [2–4]. The quantitative mechanisms by which receptors maintain such functional specificity are largely unknown; our long-term goal is to determine their physico-chemical origins.
As a step toward this goal, we resolved the microstate energetics of steroid receptor-promoter interactions for a majority of the receptors and under identical solution conditions [5–8]. Shown in Figure 1B are representative assembly states and microscopic interaction parameters for receptor assembly at a promoter containing two hormone response elements (HRE2). Based on the traditional dimer-binding model, receptors dimerize in the absence of DNA (kdim) and bind as pre-formed dimers to their response elements (kint). Binding to a promoter such as HRE2 may also be coupled to inter-site cooperativity (kc). In the context of the traditional dimer-binding model, we find that the receptors analyzed to date share largely identical intrinsic DNA binding energetics (kint). This is not surprising since the receptor DBD is highly conserved both in sequence and in tertiary structure [9–12]. By contrast, dimerization energetics (kdim) vary enormously. For example, our indirect analyses place the ER-α equilibrium dimerization constant at 0.35 nM (−12 kcal/mol), whereas direct determination of PR isoform dimerization reveals constants of 1–2 μM, or ~1,000-fold weaker. Surprisingly, GR shows no evidence for dimerization, allowing us to place only a lower limit on kdim at 100 μM (≤ −5.1 kcal/mol), or at least 100,000-fold weaker than ER-α. Cooperative binding energetics (kc) also vary significantly and inversely to dimerization. For example, ER-α exhibits essentially no cooperativity (kc = 1.4) whereas GR maintains strong cooperative stabilization (kc = 70).
We have speculated that the ability of steroid receptors to maintain large differences in promoter binding energetics serves as a framework for generating receptor-specific gene regulation. As described in more detail in our previous work, simulations demonstrate that such differences allow preferential promoter occupancy as a function of promoter architecture – even in the presence of multiple receptor populations competing for identical DNA binding sites. Importantly, these results are consistent with our recent studies demonstrating that the energetics of receptor-DNA interactions in vitro are the primary determinant of sequence-specific gene regulation in vivo [13]. Thus a critical concern is to identify the molecular forces responsible for receptor-specific differences in energetics, particularly for the (at least) 100,000-fold difference in ER-α and GR dimerization.
Unfortunately, ER-α and GR dimerization energetics are not accessible experimentally. Indeed, ER-α dimerization affinity could only be estimated by indirect methods [7]. By direct analysis we can only place an upper limit for ER-α dimerization and a lower limit for GR. We therefore created a chimeric receptor, replacing the HBD of GR with that of ER-α (GR/ER; see Figure 1C). We then used analytical ultracentrifugation and quantitative DNase footprint titrations to examine GR/ER self-association and promoter binding energetics; transient transfection assays were used to examine in vivo transcriptional activity. We find that the chimera is functionally active in a cellular environment, consistent with previous reports [14]. However, our thermodynamic dissection of GR/ER dimerization reveals energetics intermediate between the parent proteins and a strong linkage to net ion release. Noting that the HBD of ER-α is thought to be the primary contributor to dimerization, we suggest therefore that residues unique to GR structurally constrain an ion-dependent HBD assembly mechanism.
Materials and Methods
Construction of GR/ER cDNA
The human GR DNA sequence corresponding to residues 1–527 and the human ER-α DNA sequence corresponding to residues 311–595 were generated by PCR amplification using the oligonucleotides:
GR5′: 5′-CGATGGATCCGAATGGACTCCAAAG-3′
GR 3′: 5′-GATCGCTAGCCTCACCCCTACCCTGGTGTCA-3′
ER-α 5′: 5′-GATCGCTAGCACGGCCGACCAGATGGTCAGT-3′
ER-α 3′: 5′-AGATCTCGAGTCAGACCGTGGCA-3′
Following amplification, the products were digested with NheI and ligated overnight. The ligation product was digested with BamHI and XhoI, made blunt using Klenow and ligated into a pBAC baculovirus/insect cell vector (Novagen) that had been digested with SmaI. This vector, pBAC-GR/ER, was used as a template for site-directed mutagenesis (Quick Change, Stratagene) to remove the NheI site at the GR-ER splice junction. To construct a mammalian expression vector containing the GR/ER cDNA, pBAC-GR/ER was digested with EcoRV and XhoI to excise the GR/ER cDNA. This fragment was ligated into pcDNA3.1 that had been digested with EcoRV and XhoI generating pcDNA3.1-GR/ER. All sequences were confirmed by DNA sequencing.
Expression and purification of GR/ER
pBAC-GR/ER was used to express hexahistidine-tagged GR/ER (residues 1-812) in baculovirus-infected Sf9 cells as previously described [15]. Cells containing GR/ER were treated with 1 μM 17β-estradiol (E2) 24 hours post-infection, and harvested 24 hours later. All purification steps were carried out at 4°C and in the presence of 10 μM E2. The cells were Dounce homogenized in a lysis buffer containing 20 mM Tris pH 8.0, 500 mM NaCl, 10% glycerol, 25 mM imidazole, 10 mM β-mercaptoethanol (β-Me), 10 μM E2 and protease inhibitors. Following centrifugation, GR/ER was purified from the supernatent using Ni–NTA agarose resin (Qiagen). The resin was extensively washed with lysis buffer, and the receptor was eluted with the same buffer now containing 250 mM imidazole. The eluted receptor was then fractionated by size-exclusion chromatography using a Sephacryl S-300 HR column (GE Life Sciences) and lysis buffer less imidazole. GR/ER was flash-frozen and stored in liquid nitrogen; average yield was 6 mg/L of cell culture. GR/ER concentration was determined using an extinction coefficient of 52,830 M−1 cm−1 [16]. The identity of GR/ER was confirmed by mass spectrometry and immunoblot analysis.
Limited proteolysis
Limited proteolysis was carried out to compare the gross structure of GR/ER to that of GR. Sequencing-grade chymotrypsin was obtained from Roche Applied Science. GR/ER and GR (1 μM) were digested at 4 °C, pH 8.0 in a buffer containing 50 mM NaCl and otherwise identical conditions to those described for the sedimentation and quantitative footprinting studies. (We find no evidence for differences in proteolysis of either GR/ER or GR in buffers containing 50 or 500 mM NaCl). Enzyme was added at a receptor:enzyme mass ratio of 50:1. Each reaction proceeded for 90 min with aliquots removed as a function of time. Reactions were terminated by addition of SDS-PAGE loading dye and boiling for 5 min; 5 μg of receptor was electrophoresed by 10% SDS-PAGE and visualized by silver-staining.
Transient transfection
Transient transfections were carried out in 6-well plates. COS7 cells were seeded at a density of 2 × 10⁵ cells/well. Twenty-four hours later, the cells were transfected by adding: 1000 ng/well of a pA3 promoter-reporter construct and either 3.2, 10, 32, 100, 316, 1000, 1258 or 1500 ng/well pcDNA3.1-GR/ER expression vector. For comparative purposes, we also carried out identical studies using a pcDNA3.1-GR expression vector. The total DNA amount was kept constant at 2,500 ng/well using empty pcDNA 3.1. DNA complexes were prepared using TransIT-LT1 transfection reagent (Mirus Bio). After 24 hours, the growth medium was replaced with growth medium containing ethanol control or 10 nM E2 for GR/ER transfected cells and 10 nM triamcinolone acetonide (TA) for GR transfected cells. Each condition was assayed in triplicate. Luciferase assays were performed 24 hr following hormone treatment.
Luciferase assays
Cell monolayers were rinsed with cold phosphate buffered saline. Cells were lysed by the addition of 0.5 ml lysis buffer (20 mM K2PO4, pH 7.8, 5 mM MgCl2, 0.5% Triton X-100). The lysate was transferred to a microfuge tube and centrifuged for 10 min at 16,100 × g to pellet cell debris, and the supernatant transferred to a new tube.
Luciferase assays were performed as described previously [17]. The protein concentration of each extract was determined by BCA assay (Pierce). Ethanol and hormone-induced luciferase activities were measured and normalized to mg of extract protein and reported as RLU/mg. The activities from each of the three ethanol and hormone-treated wells were averaged and the error reported ± standard error of the mean (SEM). Fold-activation was calculated by dividing the averaged hormone-treated activity by the ethanol activity. The fold-activation measurements were carried out in triplicate, values were averaged and the error reported as ± SEM.
Immunoblot analysis was used to demonstrate that protein expression linearly relates to ng expression plasmid, and that equal amounts of either GR/ER or GR plasmid result in the same level of expression for each receptor. Whole cell lysate samples from GR/ER and GR-transfected cells were probed with the GR-specific antibody E20 (Santa Cruz Biotechnology) and an anti-β-actin antibody (Sigma). Band densities were determined using the program ImageQuant (Molecular Dynamics); relative expression for GR/ER was calculated from the band intensity ratios of each receptor to β-actin.
Sedimentation Velocity and Equilibrium Analyses
All sedimentation analyses were carried out on a Beckman XL-A analytical ultracentrifuge equipped with absorbance optics and an An-50 Ti rotor. For the velocity studies, GR/ER was loaded at an initial concentration of 2, 1 and 0.5 μM. The receptor was sedimented at 50,000 rpm and 4°C in a buffer containing 20 mM Tris, pH 8.0, 2.5 mM MgCl2, 1 mM CaCl2, 1 mM DTT, 10−5 M E2 and NaCl concentrations ranging from 100–750 mM. Data was collected at 230 nm and as quickly as the instrument would allow (typically every 4 minutes). A two channel Epon centerpiece was used in all experiments. The sedimentation coefficient distribution, c(s), at each GR/ER concentration was calculated as implemented in the program Sedfit [18]. Each distribution was corrected to 20°C and water (s20,w) using standard methods [19], where s20,w is defined as:
| (Eq. 1) |
M is the weight-average molecular weight as determined by the amino acid sequence and assembly stoichiometry, ν̄ is the partial specific volume of GR/ER at 20°C, ρ is the water density at 20°C, N is Avogadro’s number, and f is the frictional coefficient. The partial specific volume was calculated by summing up the partial specific volumes of each individual amino acid (0.7293 ml/g) [20].
Sedimentation equilibrium studies were carried out under identical buffer and temperature conditions as described for the sedimentation velocity experiments. Samples were allowed to reach equilibrium using six channel Epon centerpieces. GR/ER was loaded at three concentrations, identical to those used in the sedimentation velocity studies. Samples were equilibrated at 14,000, 17,000, and 21,000 rpm and judged to be at equilibrium by successive subtraction of scans. The nine datasets (three concentrations collected at three rotor speeds) were analyzed individually and globally using nonlinear least squares (NLLS) parameter estimation as implemented in the program NONLIN [21].
Data were fit to the following equation in order to resolve the dimerization constant, kdim
| (Eq. 2) |
where Yr is absorbance at radius r, δ is the baseline offset, and α the monomer absorbance at the reference radius, r0. σ is the reduced molecular weight (Equation 3), and kdim is the dimerization association constant of the reaction 2·X ↔ X2.
σ the reduced molecular weight, is defined as:
| (Eq. 3) |
where M is the molecular weight of a single, ideal species, ν̄ is the partial specific volume, ρ is the solvent density (as calculated on the basis of the salt composition and temperature [22]), ω is the angular velocity, R is the gas constant, and T is the absolute temperature. The σ for the global analysis was fixed at a value corresponding to the molecular weight and partial specific volume of the GR/ER monomer. Resolved values of kdim were converted from absorbance to molar association constants on the basis of the calculated ε230. Free energies for the assembly reactions were calculated using ΔGdim = −RT ln kdim. In all experiments used for analysis, salt-dependent changes in pH were determined to be negligible, as were any salt-induced changes in water activity [23]. Under conditions where GR/ER dimerization energetics were too strong to accurately determine, the data were fit to the following equation to resolve M, here defined as the weight-average molecular weight:
| (Eq. 4) |
DNA Preparation for DNase I Footprinting
A vector containing a promoter made up of two tandemly linked HREs (HRE2) [24] was donated by Dr. Kathryn Horwitz (University of Colorado Anschutz Medical Campus). Each HRE corresponds to the palindromic tyrosine aminotransferase (TAT) promoter sequence, TGTACAGGATGTTCT [25] spaced 25 base pairs apart. A reduced-valency template (HRE1-) containing a G-to-T point mutation in each half-site of the distal HRE (designated as site 1) was created in-house. Each template was excised from its respective vector to generate a 975 bp promoter fragment and 32P-end-labeled. The proximal HRE of each fragment (site 2) was positioned 100 bp from the 3′ end of the labeled strand.
Individual-site binding measurements
Quantitative DNase footprint titrations were carried out as originally described by Ackers and co-workers [26, 27] with slight modifications [28]. All reactions were carried out in assay buffer identical to that used in the 100 mM NaCl sedimentation studies, but now containing 100 μg/ml BSA and 2 μg/ml salmon sperm DNA. Each reaction contained 15,000 cpm of freshly labeled promoter DNA. Purified GR/ER was added to each reaction mix covering a concentration range from sub-nanomolar to micromolar, and the samples were allowed to equilibrate at 4°C for at least 1 hour. Promoter DNA concentrations were kept well below GR/ER binding affinity, thus justifying the assumption that GR/ERfree ≈ GR/ERtotal. All studies were carried out with DNase concentrations low enough to ensure “single-hit kinetics” [26], thus generating thermodynamically valid binding isotherms. Digestion products were electophoresed on 6% acrylamide-urea gels and visualized using phosphorimaging. Band densities were determined using the program ImageQuant TL 7.0 (GE Healthcare, Piscataway, NJ) and individual-site binding isotherms were calculated as described previously [26, 28].
Resolution of microscopic GR/ER-promoter assembly parameters
The DNase I footprint titration technique resolves the fractional occupancy of binding at each HRE. The statistical thermodynamic expressions that describe the individual-site binding isotherms are constructed by summing the probabilities of each microscopic configuration that contributes to binding at each site. A detailed approach for generating each mathematical formulation has been presented previously [26]. Briefly, the probability (fs) of any microscopic configuration is defined as [29]:
| (Eq. 5) |
Where ΔGs is the free energy of configuration state s relative to the unliganded reference state, x is the GR/ER monomer concentration, j is the stoichiometry of GR/ER dimer bound to a response element, R is the gas constant and T is the absolute temperature. The GR/ER monomer and dimer concentrations are calculated using the experimentally determined dimerization constant (kdim) from the sedimentation equilibrium studies and the appropriate conservation of mass equation.
The derivation of the equations used to analyze HRE2 footprinting data have been presented previously [5–7, 28]. The equation for GR/ER dimer binding to site 1 of the HRE2 promoter is:
| (Eq. 6) |
Where kdim and x are as defined previously, kint is the intrinsic association constant for a pre-formed dimer binding to a HRE, and kc corresponds to the inter-site cooperativity term. Because the HREs are identical in sequence, Eq. 6 also describes binding to site 2 of the HRE2 promoter. Using the same theoretical approach, the equation describing the fractional saturation of site 2 of the HRE1- promoter is:
| (Eq. 7) |
In order to resolve the interaction parameters describing GR/ER:DNA binding, the isotherms from each footprint titration were analyzed globally using the program Scientist (Micromath, Inc., St. Louis, MI). Finally, because protein interactions at DNA binding sites do not afford complete protection from DNase activity, binding data were treated as transition curves where the apparent fractional occupancy (Ȳapp) was fit to upper (m) and lower (b) endpoints:
| (Eq. 8) |
Results
An 812 amino acid human GR/ER chimera (Figure 1C) was expressed in baculovirus-infected Sf9 cells. GR/ER was purified to greater than 95% purity as judged by SDS-PAGE (Figure 2A). GR/ER gross structure was first compared to that of wild-type human GR by limited proteolysis. As shown in Figure 2B, both receptors generate similar proteolysis patterns, suggesting that the heterologous ER-α domain does not grossly perturb GR structure. Immunoblotting (not shown) indicates that the slight increase in molecular weight for GR/ER cleavage products greater than 50 kDa, relative to those of GR, arises from the increased molecular weight of the ER-α HBD (see Figure 1C).
Figure 2. GR/ER purification and analysis by proteolysis.
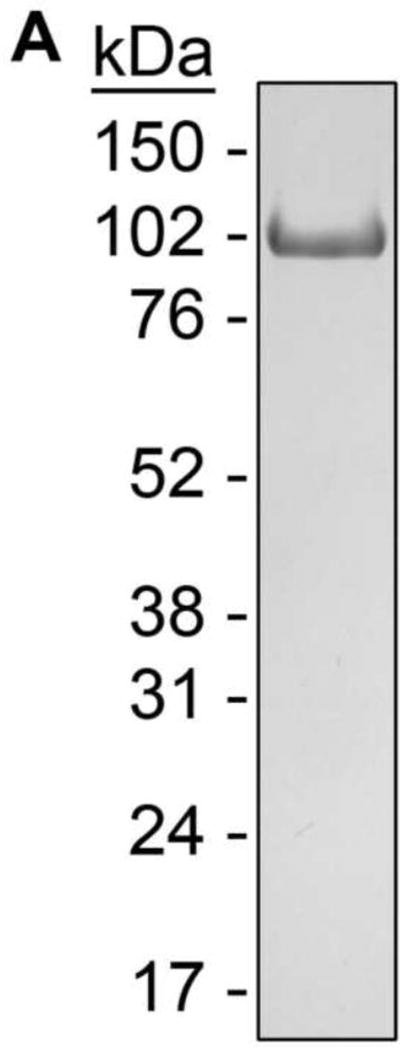
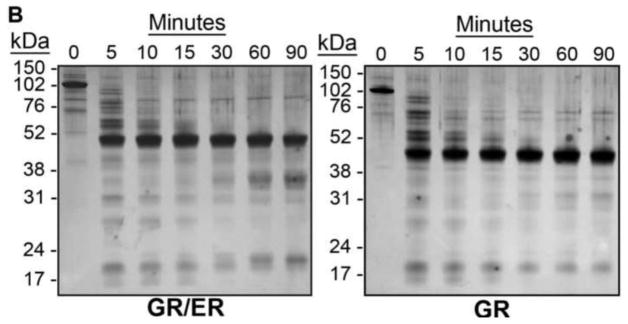
(A) Coomassie-stained SDS-PAGE image of 5 μg purified GR/ER. (B) Silver-stained SDS-PAGE of chymotryptic digestions of 1.0 μM GR/ER and GR as a function of time. Purification and biophysical characterization of full-length human GR was described previously [8].
GR/ER maintains sequence-specific transcriptional activity
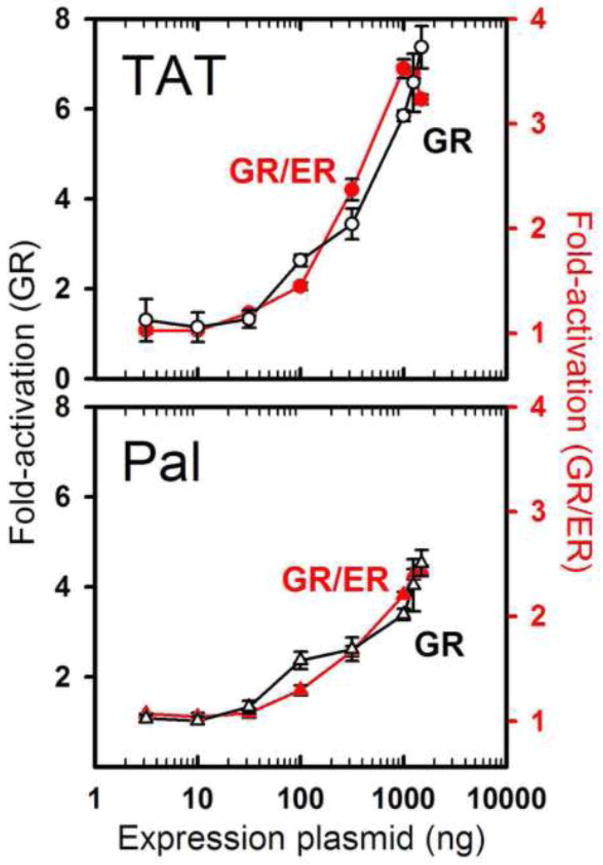
To determine if the chimera is functionally active in vivo, we measured its E2-dependent increase in transcriptional activity by transient transfection dose-response. Activity measurements were made using a single glucocorticoid response element embedded within a minimal promoter linked to a luciferase reporter gene. We then compared these results to those of wild-type GR. Shown in Figure 3 are GR/ER and GR dose-response curves for two response elements, the TAT sequence (corresponding to the HRE1- in our footprinting studies) and a synthetic palindromic sequence (Pal; AGAACAAAATGTTCT). The chimera achieves only 50% of the maximal transcriptional activity relative to wild-type GR for both sequences (compare left and right vertical axes); however, once normalized using a single common y-axis scaling factor, HRE-specific transcriptional activity is superimposable with that of wild-type GR. Immunoblot analysis indicates that these results are not influenced by either differences in the cellular expression of the two receptors or nonlinear expression as a function of plasmid dose. (Figure S1). Thus, the chimera retains the ability to functionally discriminate between different response element sequences.
Figure 3. GR/ER and GR maintain identical sequence-specific differences in transcriptional activity.
Ligand-dependent increase in GR/ER and GR transcriptional activity is plotted as a function of respective expression plasmid. E2-induced GR/ER (red, right axis) and TA-induced GR (black, left axis) dose-response curves measured for the TAT (upper) and Pal (lower) response element sequences. GR/ER curves were overlaid with GR curves using a common y-axis scaling factor. Data were collected in COS7 cells using a pA3 promoter-reporter construct. Cellular expression levels of GR/ER and GR were linear with respect to amount of expression plasmid; see Figure S1.
GR/ER is a structurally homogeneous dimer
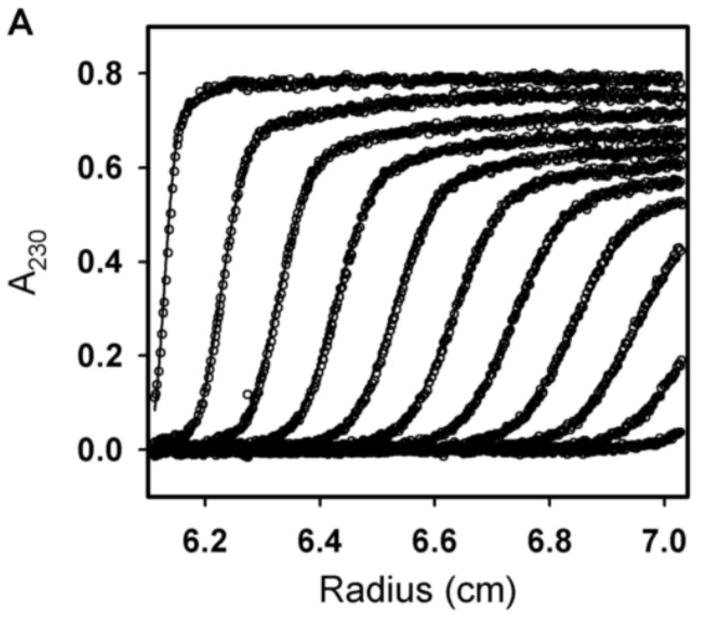
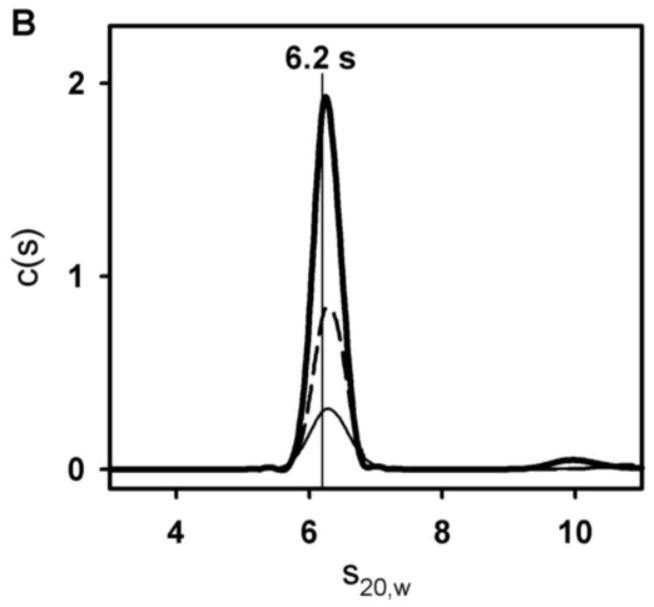
Sedimentation velocity was carried out to determine GR/ER hydrodynamic and self-association properties. The chimera was sedimented at initial concentrations of 2, 1 and 0.5 μM in a 100 mM NaCl buffer identical to that used in our footprinting studies described below. Shown in Figure 4A are representative sedimentation velocity scans; in Figure 4B are the resultant c(s) distributions for each of the three receptor concentrations. Regardless of protein concentration, the receptor sediments as a single 6.2 s species. (The minor 10 S species seen at the highest GR/ER concentration is a non-interacting contaminant that represents no more than 5% of the total material regardless of loading concentration. It is typically located between 8 and 10 s (see also Figure 6) depending on GR/ER purification.) C(M) analysis of the primary 6.2 s peak resolves a molecular weight of 150,436 Da, most comparable to the predicted dimer molecular weight of 187,820 Da. The resolved molecular weight was confirmed using direct boundary analysis as implemented in Sedanal [30], which returned a value of 144,138 Da (68% confidence interval 136,359–152,611 Da). Noting that the lowest GR/ER concentration is 0.5 μM, and sedimentation techniques should be capable of detecting at least 10% monomer, the GR/ER dimerization constant (kdim) under these conditions must be no weaker than 50 nM.
Figure 4. Sedimentation velocity analysis of GR/ER at 100 mM NaCl, pH 8.0 and 4°C.
(A) Sedimentation velocity data and fit of 2 μM GR/ER at 100 mM NaCl, pH 8.0 and 4°C. Only every fourth scan is shown for clarity. (B) Sedfit [18] c(s) analysis of 2 (thick solid line), 1 (dashed line) and 0.5 (thin solid line) μM GR/ER sedimentation velocity data. As indicated by vertical line, position of major peak is 6.2 s.
Figure 6. Sedimentation velocity analysis of GR/ER at 500 mM NaCl, pH 8.0 and 4°C.
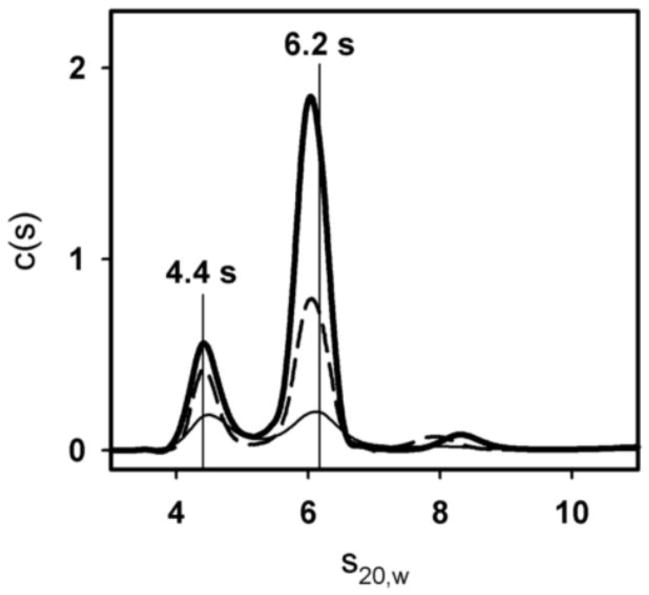
c(s) distributions determined by Sedfit [18] for 2 (solid thick line), 1 (dashed line) and 0.5 (solid thin line) μM GR/ER. As indicated by vertical lines, major peak positions are 4.4 and 6.2 s.
To directly determine the molecular weight of the 6.2 s species, we carried out sedimentation equilibrium studies under identical buffer conditions. Shown in Figure 5 are the three GR/ER concentrations used in the velocity studies now equilibrated at three rotor speeds. The nine data sets were globally fit to a single-species model, resolving a weight-average molecular weight of 179,838 Da (68% confidence interval 175,053–184,776) nearly identical to that of a GR/ER dimer. Moreover, the near concordance in sedimentation velocity and equilibrium molecular weight estimates suggests that the GR/ER dimer is largely structurally homogeneous, since even small amounts of heterogeneity tend to dramatically underestimate molecular weight estimates when determined by sedimentation velocity [31, 32].
Figure 5. Sedimentation equilibrium analysis of GR/ER at 100 mM NaCl, pH 8.0 and 4°C.
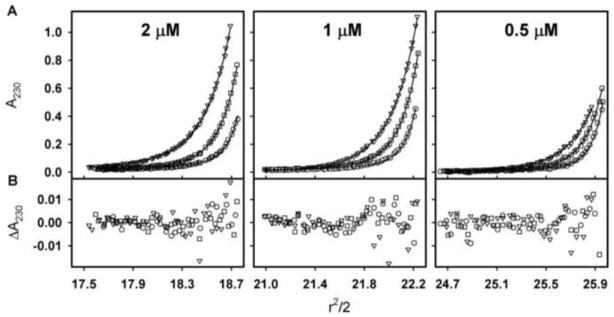
(A) Sedimentation equilibrium of 2, 1 and 0.5 μM GR/ER collected at 14,000 (triangles), 17,000 (squares) and 21,000 (circles) rpm. Lines represent global analysis of data using a single-species model as implemented in the program NONLIN [21]. (B) Residuals of fit to single-species model, only every other residual is shown for clarity. Symbols are as indicated for Panel A.
GR/ER self-association is coupled to ion release
To determine the molecular forces responsible for GR/ER dimer assembly, we next carried out sedimentation studies as a function of NaCl concentration. Shown in Figure 6 are c(s) analyses of the three GR/ER concentrations analyzed earlier, now determined at 500 rather than 100 mM NaCl. In addition to the 6.2 s species seen already (Figure 4B), a second species appears at 4.4 s. Moreover, the proportion of the 4.4 s species increases as the total protein concentration is reduced. These results strongly suggest that at high salt concentrations, GR/ER is in reversible monomer-dimer equilibrium. Indeed, a c(M) analysis returns mass estimates of 80 kDa for the 4.4 s species and 140 kDa for the 6.2 s species. These estimates are again comparable to the calculated masses of a 94 kDa monomer and 188 kDa dimer, respectively.
We directly tested the hypothesis that GR/ER undergoes reversible self-association at 500 mM NaCl by sedimentation equilibrium. Shown in Figure 7 are the three protein concentrations used in the velocity studies, now equilibrated at three rotor speeds. Analysis of the individual data sets revealed an increase in GR/ER weight-average molecular weight with increasing receptor loading concentration (data not shown). Consistent with this, attempts to globally analyze the nine data sets using a single-species model resulted in a poor quality of fit and an average molecular weight intermediate between GR/ER monomer and dimer. We therefore globally analyzed the data using a monomer-dimer self-association model, which resulted in an improved quality of fit as judged by F-statistics [33] and a dimerization free energy of −7.5 kcal/mol, which corresponds to a dissociation constant of 1.2 μM (68% confidence interval 1.0–1.5). Globally fitting the data to different interaction stoichiometries (e.g. monomer-tetramer) or to more complex models (e.g. monomer-dimer-trimer) did not improve the quality of fit, indicating that a monomer-dimer model is most appropriate to describe the experimental data. Moreover, noting that the sedimentation velocity analysis revealed monomer and dimer peak positions that remained constant as a function of GR/ER loading concentration, this suggests that the dimerization off-rate is slower than the timescale of the experiment or on the order of 10−5 s−1 or less [34, 35].
Figure 7. Sedimentation equilibrium analysis of GR/ER at 500 mM NaCl, pH 8.0 and 4°C.
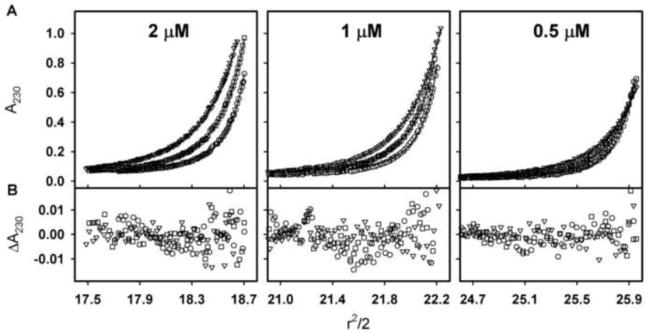
(A) Sedimentation equilibrium of 2, 1 and 0.5 μM GR/ER collected at 14,000 (triangles), 17,000 (squares) and 21,000 (circles) rpm. Lines represent global analysis of all data using a monomer-dimer self-association model as implemented in the program NONLIN [21]. (B) Residuals of fit to monomer-dimer model, only every other residual is shown for clarity. Symbols are as indicated for Panel A.
Using the experimentally determined sedimentation coefficients and calculated molecular weights of the GR/ER monomer and dimer, we determined the hydrodynamic properties for both species. The frictional coefficient for the monomer is 0.96 × 10⁻⁷ g/s, and 1.37 × 10⁻⁷ g/s for the dimer. Comparison of each frictional coefficient to that of a compact hydrated sphere of equivalent mass yielded frictional ratios (f/fo) of 1.51 for the monomer and 1.70 for the dimer, indicative of significant structural asymmetry [36]. If modeled as prolate ellipsoids, the monomer and dimer have axial ratios of 9:1 and 13:1, respectively. Finally, the Stokes radius for the monomer was determined to be 51 Å and that of the dimer was 72 Å [36]. All hydrodynamic parameters are summarized in Table 1. For comparative purposes, the analogous parameters for intact ER-α [7] and GR [8] determined under identical conditions are also shown.
Table 1.
Hydrodynamic parameters for GR/ER, ER-α and GR.a
| GR/ER | ER-α | GR | ||
|---|---|---|---|---|
| Monomer | Dimer | Dimer | Monomer | |
| s20,w (s) | 4.4 | 6.2 | 5.7 | 4.1 |
| f (g/s) | 0.96 × 10⁻⁷ | 1.37 × 10⁻⁷ | 1.12 × 10⁻⁷ | 1.00 × 10⁻⁷ |
| f/fo | 1.51 | 1.70 | 1.53 | 1.59 |
| Stokes Radius (Å) | 51 | 72 | 59 | 53 |
| Axial ratio | 9:1 | 13:1 | 10:1 | 11:1 |
Hydration was assumed to be 0.3 g water/g protein in all relevant calculations.
To determine the thermodynamic linkage between GR/ER dimerization and NaCl concentration, we carried out sedimentation equilibrium over a range of NaCl concentrations. Nine data sets were collected at each salt concentration (three GR/ER concentrations equilibrated at three rotor speeds), and each set was globally analyzed using a monomer-dimer model. The resultant dimerization energetics were determined (Table 2) and plotted as a function of NaCl concentration. As shown in Figure 8, there is a strong linear relationship between the two values – a fit of the data generates a slope of −2.5 ± 0.2 indicating that a net 2.5 thermodynamic ions are released from GR/ER upon dimer formation. Furthermore, extrapolation to 100 mM NaCl predicts a dimerization free energy of −9.8 ± 0.3 kcal/mol or a 17 ± 5 nM dissociation constant.
Table 2.
Resolved GR/ER dimerization energetics at pH 8.0, 4°C and as a function of NaCl concentration.a
| [NaCl] (mM) | ΔGdim (kcal/mol) |
|---|---|
| 100 | −10.0 ± 0.3b |
| 150 | −9.1 (−8.9–−9.4) |
| 200 | −9.0 (−8.7–−9.4) |
| 300 | −8.5 (−8.3–−8.7) |
| 500 | −7.5 (−7.4–−7.6) |
| 750 | −7.0 (−6.9–−7.1) |
Figure 8. Linkage analysis of GR/ER dimerization energetics and NaCl concentration.
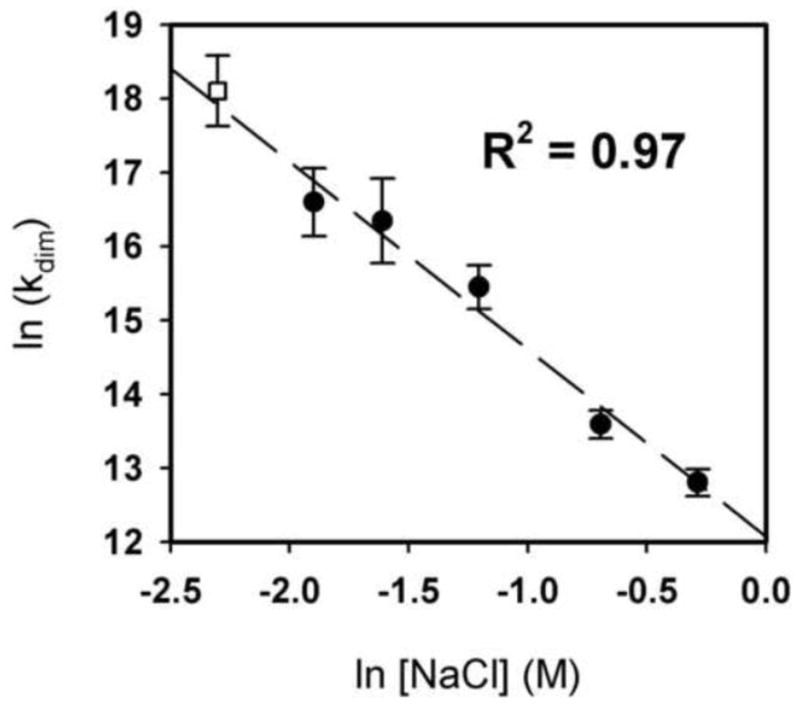
Shown are the resolved dimerization constants plotted as ln(kdim). Values were determined at pH 8.0 and 4°C, in a buffer containing 100, 150, 200, 300, 500, or 750 mM NaCl. Open square, 100 mM NaCl as estimated by quantitative footprinting. Filled circles, 150 to 750 mM NaCl as determined by sedimentation equilibrium. Line represents linear regression of filled circles only. Error bars represent 68% confidence intervals as determined by the program NONLIN [21].
GR/ER dimers assemble at a two-site promoter with nanomolar intrinsic affinity and slight anti-cooperativity
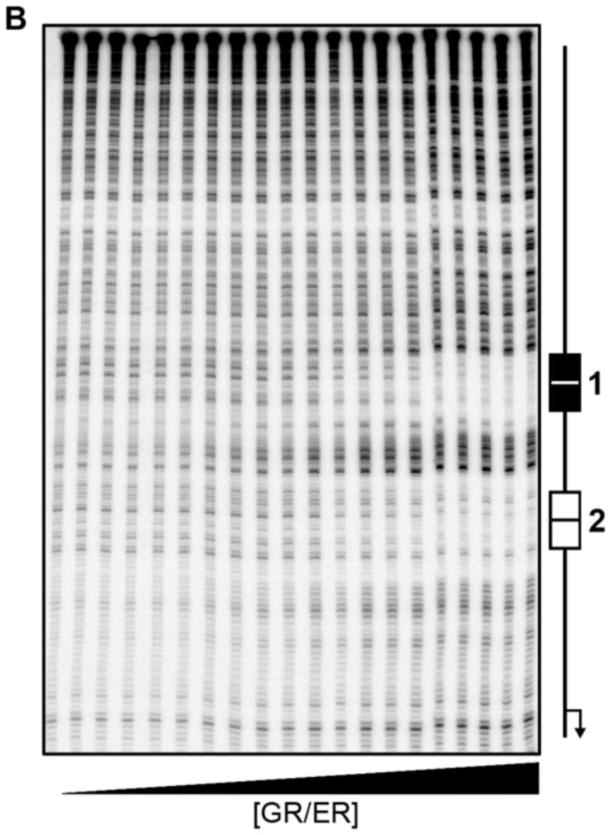
The microstate energetics of GR/ER assembly at a two-site promoter (HRE2; Figures 1B and 9A) were determined using quantitative footprint titration. Shown in Figure 9B is a representative titration of the HRE2 promoter under conditions identical to the low salt buffer (100 mM NaCl) used in our initial sedimentation studies. As seen in our previous work on GR, ER-α and both PR isoforms [5–8], binding to the two HREs is highly specific.
Figure 9. Quantitative analysis of GR/ER HRE2 assembly.

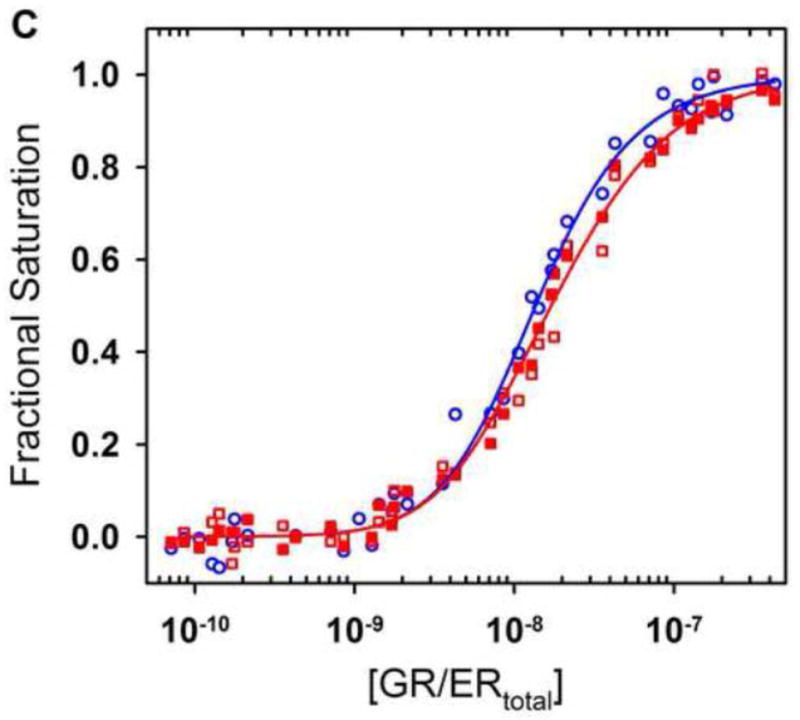
(A) DNA sequence and response element position within the HRE2 promoter. (B) Representative quantitative footprint titration of the HRE2 promoter determined at pH 8.0, 100 mM NaCl and 4°C. Schematic to the right indicates the location of the HRE binding sites; arrow refers to direction and approximate location of the transcriptional start site. (C) Shown in red is GR/ER binding to site 1 (closed squares) and 2 (open squares) of the HRE2 promoter from two independent footprint titrations. Shown in blue is GR/ER binding to site 2 (open circles) of the reduced valency HRE1- promoter from two independent footprint titrations. Lines represent a simultaneous best fit analysis of the HRE2 (red) and HRE1- (blue) data sets using the dimer binding model (Eqs. 6 and 7 and Figure 1B). GR/ER binds to sites 1 and 2 on the HRE2 with equal affinity; therefore a single (red) line describes binding to both sites.
Shown in Figure 9C are the two individual-site binding isotherms from the HRE2 promoter. Also shown is a single binding isotherm from the HRE1- reduced-valency promoter. Noting the high quality of the footprint titration data, we globally analyzed the isotherms including the dimerization constant (kdim) as a fitted parameter. Using such an approach, we resolved an intrinsic DNA binding free energy of −10.7 ± 0.1 kcal/mol, a cooperative free energy of +0.3 ± 0.1 kcal/mol, and a dimerization free energy of −10.0 ± 0.3 kcal/mol (corresponding to a dissociation constant of 13 nM).
Noting that the extrapolated dimerization affinity in 100 mM NaCl was determined to be 17 nM (see Figure 8), the three isotherms were also globally fit to the dimer-binding model using this latter constant as a fixed parameter. This analysis resolved an intrinsic DNA binding free energy of −10.8 ± 0.1 kcal/mol (corresponding to a dissociation constant of 3 nM) and a cooperative free energy of +0.33 ± 0.01 kcal/mol. Thus, the two fits resolved statistically identical intrinsic and cooperative free energies. Moreover, using two orthogonal approaches, we resolved statistically identical estimates of the dimerization constant. These results thus predict that the 100 mM NaCl sedimentation velocity data (Figure 4) should contain a small proportion of GR/ER monomer, potentially allowing us to determine molecular properties of this species. However, despite repeated attempts using direct fitting approaches [30] we were unable to extract useful information. This is most likely a result of the small predicted percentage of GR/ER monomer (3.8–7.4% of the initial GR/ER loading concentration), the limited range of GR/ER concentrations analyzed, and decreased signal to noise ratios at the lower GR/ER concentrations. All resolved parameters from the sedimentation equilibrium and footprinting analyses are shown in Table 3. For comparative purposes, the analogous parameters for intact ER-α and GR determined under identical conditions are also shown.
Table 3.
Resolved microstate energetics for GR/ER, GR and ER-α assembly at the HRE2 promoter.a
| GR/ERb (kcal/mol) | GR/ERc (kcal/mol) | ER-αd (kcal/mol) | GRe (kcal/mol) | |
|---|---|---|---|---|
| ΔGint | −10.8 ± 0.1 | −10.7 ± 0.1 | −11.7 ± 0.2 | −12.3 ± 0.2 |
| ΔGc | +0.3 ± 0.1 | +0.3 ± 0.1 | −0.2 (0–−0.5)f | −2.3 ± 0.2 |
| ΔGdim | −9.9 ± 0.2g | −10.0 ± 0.3h | −11.4 ± 1.2 | ≥ −5.1i |
| SD of Fitj | 0.036 | 0.036 | 0.077 | 0.068 |
Values calculated using standard relationship ΔGi = −RTln(ki). Unless otherwise noted, errors represent one SD reported from the program Scientist.
Values reported from the fit to the footprint titration data using kdim as a fixed parameter.
Values reported from the fit to the footprint titration data including kdim as a fitted parameter.
Values previously reported [7].
Values previously reported [8].
Associated error represents 68% confidence interval determined using a Monte Carlo approach [7].
Extrapolated value determined in Figure 8.
Value resolved from quantitative footprint titration.
Because GR shows no evidence of dimerization, this value represents a lower limit.
SD of fit in units of fractional saturation.
Discussion
Historically, steroid receptors were thought to function via independent and non-communicating domains. More recent work has demonstrated that receptor activity is considerably more complex, accompanied by allosteric linkages to ligand, coactivator and DNA binding [37, 38]. This view could suggest that introduction of the heterologous ER-α domain should compromise GR structure and function. However, using a rigorous approach we find that GR/ER is functionally active, largely structurally homogeneous, capable of dimerizing, and binds its response elements with high affinity and specificity. Thus, the GR N-terminal region and DBD can readily accommodate the heterologous ER-α HBD. Consequently, we can reliably probe the molecular forces responsible for receptor dimerization, for which little is known.
Biophysical and functional characteristics of the GR/ER chimera
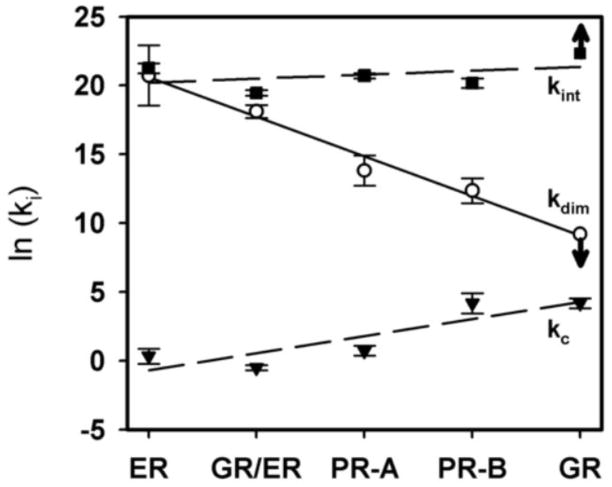
Plotted in Figure 10 are the HRE2 interaction energetics for GR/ER, alongside those of four wild-type steroid receptors (ER-α, PR-A, PR-B and GR). The values for all receptors were determined under identical low salt (100 mM) conditions and are rank-ordered by dimerization energetics. As we highlighted in the introduction, the intrinsic energetics of dimer binding (kint) are similar for all proteins, including GR/ER. By contrast, dimerization energetics (kdim) vary significantly and are inversely correlated to cooperativity (kc). Interestingly, GR/ER energetics are consistent with this correlation, having an energetic profile under these conditions that is most comparable to that of wild-type ER-α.
Figure 10. Distribution of microstate energetics for steroid receptor dimer assembly at the HRE2 promoter.
Measured dimer intrinsic (kint – closed squares), dimerization (kdim – open circles) and cooperative (kc – closed triangles) energetics. Linear regression of each parameter is shown to emphasize each trend across receptor family members. The values for ER-α, PR-A, PR-B and GR have been previously reported [5, 7, 8]; values for GR/ER are taken from Table 3 (global fit including kdim as a fitted parameter). Since there is no evidence for GR dimerization, kdim (100 μM) is plotted as a lower limit; this is represented by the downward arrow. Because GR intrinsic affinity (kint) was resolved using the assumed dimerization affinity of 100 μM, it is also presented as a limit via an upward arrow [8].
The current results suggest that GR/ER follows structural and functional rules consistent with those of other steroid receptors. Therefore, the correlation pattern seen in Figure 10 could suggest that HBDs control not only dimerization but also cooperativity. How this might occur will require further study; however, we speculate that a highly stable HBD dimeric interface structurally constrains cooperative protein-protein interactions with other receptor dimers. By contrast, loss of this quaternary constraint (via weakened dimerization affinity) allows additional degrees of freedom in which cooperative protein-protein interactions can occur. We emphasize that this does not imply that HBDs are “cooperativity domains” per se; the quaternary constraints may not be unique to the HBD. High resolution crystallographic studies should allow further insight into the structural mechanisms responsible for switching between dimerization and cooperativity.
An alternative explanation for our results is that introduction of the ER-α HBD has simply converted a monomeric protein to a dimer. Moreover, because the domains are heterologous it is possible that the ER-α HBD has simply disrupted GR cooperative structure and function. Thus the lack of cooperativity in the chimera may simply be a consequence of analyzing a functionally disabled protein. Yet if this is the case, it is worth considering that this is a highly selective result – as summarized earlier, many other functional and structural properties are retained. Moreover, some of these properties are system-wide (e.g. transcriptional activation and gross receptor structure) indicating that the chimera is structurally and functionally intact.
Finally, we note that GR/ER functionally discriminates between two different DNA response elements in a manner identical to that of wild-type GR (Figure 3). This is surprising in light of recent work suggesting that individual response elements allosterically modulate GR function [39]. If this type of allostery is in operation, one might expect that sequence-specific transcriptional activity would be disrupted upon addition of a heterologous functional domain. Thus the results in Figure 3 suggest that the inter-domain communication postulated as part of sequence-specific GR function does not necessarily include the GR HBD.
Mechanistic implications for receptor dimerization
Although GR/ER maintains dimerization energetics most comparable to ER-α under low salt conditions, the energetics weaken considerably as salt concentration is increased (Figure 8). This is due to thermodynamic coupling between dimerization and net ion release. Based on the observed linear relationship, we speculate that the coupling arises from ionic screening of charge-charge interactions within the GR/ER dimer. With regard to the structural origins of this effect, three possibilities exist: 1) Dimerization of the ER-α HBD is regulated by ionic interactions; however, the GR N-terminal region acts as a steric constraint. As a consequence, HBD dimerization affinity is weakened from the experimentally inaccessible nanomolar range to a more amenable micromolar range. 2) The GR N-terminal regions dimerize via an ion-dependent mechanism; however, the strong ER-α HBD dimerization domain strengthens the GR interaction from the high micromolar (>100 μM) to a more experimentally tractable low micromolar range. 3) The linkage is a composite result arising from both ER-α and GR interactions. (A fourth possibility – that the linkage reflects an amalgam of different interactions due to polydisperse or heterologous GR/ER – seems highly unlikely given our analytical ultracentrifugation results).
Of the three explanations, we favor the first for the following reasons. As we have already noted, biochemical studies indicate that the ER-α HBD is the primary mediator of receptor dimerization in the absence of DNA [40]. By contrast, there is no evidence to suggest that the DNA binding domain or N-terminal region of GR self-associates [9, 41]. Consistent with this interpretation, crystallographic analysis of the ER-α HBD dimer shows that although the bulk of the dimer interface is hydrophobic in nature, several charged residues also contribute [42]. Nonetheless, we emphasize that the thermodynamic nature of our studies makes it impossible to assign the observed linkage to any discrete residue or interaction. Indeed, if dimerization of intact ER-α maintains an identical linkage as GR/ER (−2.5 net ions), then based on the 0.35 nM ER-α dimerization affinity at 100 mM NaCl [7], the predicted affinity at 1 M NaCl would be 121 nM. Such an affinity should be detectable using an analytical ultracentrifuge equipped with absorbance-based optics. However, since we were unable to detect a monomer-dimer equilibrium at this salt concentration [7], it is likely that dimerization in the holoprotein reflects contributions beyond those of the HBD. We reached a similar conclusion in our analysis of the molecular forces driving PR isoform dimerization [43, 44]. In summary, more work is needed to fully assess the molecular forces responsible for intact ER-α (and GR) self-association. For strongly interacting receptors such as ER-α, methods such as fluorescence-based analytical ultracentrifugation may prove useful [45]. More detailed structural and thermodynamic studies will also be necessary for delineating the role of individual domains in ion-regulated assembly of both dimerization and cooperative DNA binding.
Supplementary Material
Data points represent receptor:β-actin band intensity ratios of GR/ER (closed circles) and GR (open circles) transfected cells at eight expression vector amounts. Dashed and solid lines represent linear regression of GR/ER (R2 = 0.93) and GR (R2 = 0.93), respectively. Inset shows enhanced resolution of the lower three DNA amounts.
Highlights.
Homologous steroid receptors exhibit large differences in dimerization energetics
The molecular origins were probed using a glucocorticoid-estrogen receptor chimera
Dimerization energetics of the chimera are coupled to a strong ionic linkage
Residues unique to the glucocorticoid receptor constrain ion-regulated assembly
Acknowledgments
We thank Rolando W. De Angelis for helpful input and discussion; Ms. Fran Crawford and the Kapplar/Marrack laboratory (National Jewish Medical and Research Center) for assistance and training in insect cell/baculovirus protein expression systems; and the Mass Spectrometry Core Facility of the Skaggs School of Pharmacy and Pharmaceutical Sciences, University of Colorado Anschutz Medical Center. This work was supported by NIH grants DK61933 and DK88843 and the Avon Foundation for Women.
Footnotes
Publisher's Disclaimer: This is a PDF file of an unedited manuscript that has been accepted for publication. As a service to our customers we are providing this early version of the manuscript. The manuscript will undergo copyediting, typesetting, and review of the resulting proof before it is published in its final citable form. Please note that during the production process errors may be discovered which could affect the content, and all legal disclaimers that apply to the journal pertain.
References
- 1.Tsai MJ, O’Malley BW. Molecular mechanisms of action of steroid/thyroid receptor superfamily members. Annu Rev Biochem. 1994;63:451–486. doi: 10.1146/annurev.bi.63.070194.002315. [DOI] [PubMed] [Google Scholar]
- 2.Monroe DG, Getz BJ, Johnsen SA, Riggs BL, Khosla S, Spelsberg TC. Estrogen receptor isoform-specific regulation of endogenous gene expression in human osteoblastic cell lines expressing either ERα or ERβ. J Cell Biochem. 2003;90:315–326. doi: 10.1002/jcb.10633. [DOI] [PubMed] [Google Scholar]
- 3.Richer JK, Jacobsen BM, Manning NG, Abel MG, Wolf DM, Horwitz KB. Differential gene regulation by the two progesterone receptor isoforms in human breast cancer cells. J Biol Chem. 2002;277:5209–5218. doi: 10.1074/jbc.M110090200. [DOI] [PubMed] [Google Scholar]
- 4.Wan Y, Nordeen SK. Overlapping but distinct gene regulation profiles by glucocorticoids and progestins in human breast cancer cells. Mol Endocrinol. 2002;16:1204–1214. doi: 10.1210/mend.16.6.0848. [DOI] [PubMed] [Google Scholar]
- 5.Connaghan-Jones KD, Heneghan AF, Miura MT, Bain DL. Thermodynamic analysis of progesterone receptor-promoter interactions reveals a molecular model for isoform-specific function. Proc Natl Acad Sci U S A. 2007;104:2187–2192. doi: 10.1073/pnas.0608848104. [DOI] [PMC free article] [PubMed] [Google Scholar]
- 6.Heneghan AF, Connaghan-Jones KD, Miura MT, Bain DL. Cooperative DNA binding by the B-isoform of human progesterone receptor: Thermodynamic analysis reveals strongly favorable and unfavorable contributions to assembly. Biochemistry. 2006;45:3285–3296. doi: 10.1021/bi052046g. [DOI] [PMC free article] [PubMed] [Google Scholar]
- 7.Moody AD, Miura MT, Connaghan KD, Bain DL. Thermodynamic dissection of estrogen receptor-promoter interactions reveals that steroid receptors differentially partition their self-association and promoter binding energetics. Biochemistry. 2012;51:739–749. doi: 10.1021/bi2017156. [DOI] [PMC free article] [PubMed] [Google Scholar]
- 8.Robblee JP, Miura MT, Bain DL. Glucocorticoid receptor-promoter interactions: Energetic dissection suggests a framework for the specificity of steroid receptor-mediated gene regulation. Biochemistry. 2012;51:4463–4472. doi: 10.1021/bi3003956. [DOI] [PMC free article] [PubMed] [Google Scholar]
- 9.Härd T, Kellenbach E, Boelens R, Maler B, Dahlman K, Freedman L, Carlstedt-Duke J, Yamamoto K, Gustafsson J, Kaptein R. Solution structure of the glucocorticoid receptor DNA-binding domain. Science. 1990;249:157–160. doi: 10.1126/science.2115209. [DOI] [PubMed] [Google Scholar]
- 10.Roemer SC, Donham DC, Sherman L, Pon VH, Edwards DP, Churchill MEA. Structure of the progesterone receptor-deoxyribonucleic acid complex: Novel interactions required for binding to half-site response elements. Mol Endocrinol. 2006;20:3042–3052. doi: 10.1210/me.2005-0511. [DOI] [PMC free article] [PubMed] [Google Scholar]
- 11.Schwabe JWR, Chapman L, Finch JT, Rhodes D, Neuhaus D. DNA recognition by the oestrogen receptor: From solution to the crystal. Structure (London, England : 1993) 1993;1:187–204. doi: 10.1016/0969-2126(93)90020-h. [DOI] [PubMed] [Google Scholar]
- 12.Shaffer PL, Jivan A, Dollins DE, Claessens F, Gewirth DT. Structural basis of androgen receptor binding to selective androgen response elements. Proc Natl Acad Sci U S A. 2004;101:4758–4763. doi: 10.1073/pnas.0401123101. [DOI] [PMC free article] [PubMed] [Google Scholar]
- 13.Bain DL, Yang Q, Connaghan KD, Robblee JP, Miura MT, Degala GD, Lambert JR, Maluf NK. Glucocorticoid receptor-DNA interactions: Binding energetics are the primary determinant of sequence-specific transcriptional activity. J Mol Biol. 2012 doi: 10.1016/j.jmb.2012.06.005. [DOI] [PubMed] [Google Scholar]
- 14.Bonovich MT, List H-J, Zhang S, Danielsen M, Riegel AT. Identification of glucocorticoid receptor domains necessary for transcriptional activation of the mouse mammary tumor virus promoter integrated in the genome. Exp Cell Res. 1998;239:454–462. doi: 10.1006/excr.1997.3920. [DOI] [PubMed] [Google Scholar]
- 15.Christensen K, Estes PA, Onate SA, Beck CA, DeMarzo A, Altmann M, Lieberman BA, St John J, Nordeen SK, Edwards DP. Characterization and functional properties of the A and B forms of human progesterone receptors synthesized in a baculovirus system. Mol Endocrinol. 1991;5:1755–1770. doi: 10.1210/mend-5-11-1755. [DOI] [PubMed] [Google Scholar]
- 16.Gill S, von Hippel P. Calculation of protein extinction coefficients from amino acid sequence data. Anal Biochem. 1989;182:319–326. doi: 10.1016/0003-2697(89)90602-7. [DOI] [PubMed] [Google Scholar]
- 17.Archer TK, Zaniewski E, Moyer ML, Nordeen SK. The differential capacity of glucocorticoids and progestins to alter chromatin structure and induce gene expression in human breast cancer cells. Mol Endocrinol. 1994;8:1154–1162. doi: 10.1210/mend.8.9.7838148. [DOI] [PubMed] [Google Scholar]
- 18.Schuck P. On the analysis of protein self-association by sedimentation velocity analytical ultracentrifugation. Anal Biochem. 2003;320:104–124. doi: 10.1016/s0003-2697(03)00289-6. [DOI] [PubMed] [Google Scholar]
- 19.Van Holde KE. Physical Biochemistry. Prentice-Hall; Englewood Cliffs, CA: 1971. [Google Scholar]
- 20.Cohn EJ, Edsall JT. Proteins, Amino Acids and Peptides. Reinhold; New York: 1943. [Google Scholar]
- 21.Johnson ML, Correia JJ, Yphantis DA, Halvorson HR. Analysis of data from the analytical ultracentrifuge by nonlinear least-squares techniques. Biophys J. 1981;36:575–588. doi: 10.1016/S0006-3495(81)84753-4. [DOI] [PMC free article] [PubMed] [Google Scholar]
- 22.Laue TM, Shah BD, Ridgeway TM, Pelletier SL. Analytical Ultracentrifugation in Biochemistry and Polymer Science. Royal Society of Chemistry; Cambridge: 1992. [Google Scholar]
- 23.Hamer WJ, Wu YC. Osmotic coefficients and mean activity coefficients of uni-univalent electrolytes in water at 25 °C. J Phys Chem Ref Data. 1972;1:1047–1100. [Google Scholar]
- 24.Tung L, Shen T, Abel MG, Powell RL, Takimoto GS, Sartorius CA, Horwitz KB. Mapping the unique activation function 3 in the progesterone B-receptor upstream segment. J Biol Chem. 2001;276:39843–39851. doi: 10.1074/jbc.M106843200. [DOI] [PubMed] [Google Scholar]
- 25.Jantzen HM, Strahle U, Gloss B, Stewart F, Schmid W, Boshart M, Miksicek R, Schutz G. Cooperativity of glucocorticoid response elements located far upstream of the tyrosine aminotransferase gene. Cell. 1987;49:29–38. doi: 10.1016/0092-8674(87)90752-5. [DOI] [PubMed] [Google Scholar]
- 26.Brenowitz M, Senear DF, Shea MA, Ackers GK. Quantitative DNase footprint titration: A method for studying protein-DNA interactions. Methods Enzymol. 1986;130:132–181. doi: 10.1016/0076-6879(86)30011-9. [DOI] [PubMed] [Google Scholar]
- 27.Brenowitz M, Senear DF, Shea MA, Ackers GK. Footprint titrations yield valid thermodynamic isotherms. Proc Natl Acad Sci U S A. 1986;83:8462–8466. doi: 10.1073/pnas.83.22.8462. [DOI] [PMC free article] [PubMed] [Google Scholar]
- 28.Connaghan-Jones KD, Moody AD, Bain DL. Quantitative DNase footprint titration: A tool for analyzing the energetics of protein-DNA interactions. Nat Protocols. 2008;3:900–914. doi: 10.1038/nprot.2008.53. [DOI] [PubMed] [Google Scholar]
- 29.Hill TL. An Introduction to Statistical Thermodynamics. Dover Publications; New York: 1960. [Google Scholar]
- 30.Stafford WF, Sherwood PJ. Analysis of heterologous interacting systems by sedimentation velocity: Curve fitting algorithms for estimation of sedimentation coefficients, equilibrium and kinetic constants. Biophys Chem. 2004;108:231–243. doi: 10.1016/j.bpc.2003.10.028. [DOI] [PubMed] [Google Scholar]
- 31.Philo JS. A method for directly fitting the time derivative of sedimentation velocity data and an alternative algorithm for calculating sedimentation coefficient distribution functions. Anal Biochem. 2000;279:151–163. doi: 10.1006/abio.2000.4480. [DOI] [PubMed] [Google Scholar]
- 32.Schuck P. Size-distribution analysis of macromolecules by sedimentation velocity ultracentrifugation and lamm equation modeling. Biophys J. 2000;78:1606–1619. doi: 10.1016/S0006-3495(00)76713-0. [DOI] [PMC free article] [PubMed] [Google Scholar]
- 33.Johnson ML, Straume M. Modern analytical ultracentrifugation. Birkhauser; Boston: 1994. Comments on the analysis of sedimentation equilibrium experiments; pp. 37–65. [Google Scholar]
- 34.Correia JJ, Stafford WF. Extracting equilibrium constants from kinetically limited reacting systems. Methods Enzymol. 2009;455:419–446. doi: 10.1016/S0076-6879(08)04215-8. [DOI] [PubMed] [Google Scholar]
- 35.Dam J, Velikovsky CA, Mariuzza RA, Urbanke C, Schuck P. Sedimentation velocity analysis of heterogeneous protein-protein interactions: Lamm equation modeling and sedimentation coefficient distributions c(s) Biophys J. 2005;89:619–634. doi: 10.1529/biophysj.105.059568. [DOI] [PMC free article] [PubMed] [Google Scholar]
- 36.Cantor CR, Schimmel PR. Biophysical chemistry part II: Techniques for the study of biological structure and function. W. H. Freeman and Company; New York, NY: 1980. [Google Scholar]
- 37.Heneghan AF, Connaghan-Jones KD, Miura MT, Bain DL. Coactivator assembly at the promoter: Efficient recruitment of SRC2 is coupled to cooperative DNA binding by the progesterone receptor. Biochemistry. 2007;46:11023–11032. doi: 10.1021/bi700850v. [DOI] [PubMed] [Google Scholar]
- 38.Kumar R, McEwan IJ. Allosteric modulators of steroid hormone receptors: Structural dynamics and gene regulation. Endocrine Reviews. 2012 doi: 10.1210/er.2011-1033. [DOI] [PMC free article] [PubMed] [Google Scholar]
- 39.Meijsing SH, Pufall MA, So AY, Bates DL, Chen L, Yamamoto KR. DNA binding site sequence directs glucocorticoid receptor structure and activity. Science. 2009;324:407–410. doi: 10.1126/science.1164265. [DOI] [PMC free article] [PubMed] [Google Scholar]
- 40.Kumar V, Chambon P. The estrogen receptor binds tightly to its responsive element as a ligand-induced homodimer. Cell. 1988;55:145–156. doi: 10.1016/0092-8674(88)90017-7. [DOI] [PubMed] [Google Scholar]
- 41.Kumar R, Lee JC, Bolen DW, Thompson EB. The conformation of the glucocorticoid receptor AF1/tau1 domain induced by osmolyte binds co-regulatory proteins. J Biol Chem. 2001;276:18146–18152. doi: 10.1074/jbc.M100825200. [DOI] [PubMed] [Google Scholar]
- 42.Tanenbaum DM, Wang Y, WIlliams SP, Sigler PB. Crystallographic comparison of the estrogen receptor and progesterone receptor’s ligand binding domains. Proc Natl Acad Sci USA. 1998;95:5998–6003. doi: 10.1073/pnas.95.11.5998. [DOI] [PMC free article] [PubMed] [Google Scholar]
- 43.Connaghan-Jones KD, Heneghan AF, Miura MT, Bain DL. Hydrodynamic analysis of the human progesterone receptor A-isoform reveals that self-association occurs in the micromolar range. Biochemistry. 2006;45:12090–12099. doi: 10.1021/bi0612317. [DOI] [PubMed] [Google Scholar]
- 44.Heneghan AF, Berton N, Miura MT, Bain DL. Self-association energetics of an intact, full-length nuclear receptor: The B-isoform of human progesterone receptor dimerizes in the micromolar range. Biochemistry. 2005;44:9528–9537. doi: 10.1021/bi050609i. [DOI] [PubMed] [Google Scholar]
- 45.MacGregor IK, Anderson AL, Laue TM. Fluorescence detection for the XLI analytical ultracentrifuge. Biophys Chem. 2004;108:165–185. doi: 10.1016/j.bpc.2003.10.018. [DOI] [PubMed] [Google Scholar]
Associated Data
This section collects any data citations, data availability statements, or supplementary materials included in this article.
Supplementary Materials
Data points represent receptor:β-actin band intensity ratios of GR/ER (closed circles) and GR (open circles) transfected cells at eight expression vector amounts. Dashed and solid lines represent linear regression of GR/ER (R2 = 0.93) and GR (R2 = 0.93), respectively. Inset shows enhanced resolution of the lower three DNA amounts.


