

Abstract
Endothelial cell (EC) activation and their subsequent binding with different cells have various mechanical consequences that, if monitored real time, can serve as a functional biomarker of many pathophysiological response mechanisms. This work presents an innovative and facile strategy to conduct such monitoring using quartz crystal microbalance (QCM), thereby relating the shifts in its frequency and motional resistance to morphological changes upon cell-cell and cell-substrate interactions. By activating ECs with TNF-α and then characterizing their binding with HL-60 and KG-1 leukemia cells, we are able to induce the mechanical changes in ECs especially in the region of cell-substrate contact which resulted in dynamically coupled mass and viscoelastic changes representing the extent of both activation and binding. The activated ECs suffered a decrease of cellular contact area, leading to positive frequency shift and decreased motional resistance. The binding of leukemia cells onto pre-activated ECs exerted a mechanical force to regain the cell surface contact which resulted in the obvious QCM responses opposite to that of activation, and proportional to the number of cells added, in spite of the fact that these added cells are extremely outside the extinction depth of the shear wave generated by QCM. Different cell lines demonstrate different attachment behavior, which was detected by the QCM. Despite these variations are quite subtle, yet the sensitivity of the technique for dynamic changes at the interface makes them detectable. Moreover, the reproducibility of the generated data determined at each step by deviation measurements (<10%) in response plot was very high despite the high possible heterogeneity in cell populations. The results are explained on the basis of simple theoretical and physical models, although, the development of a more quantitative and precise model is underway in our laboratory.
Keywords: QCM, EC Activation, Cell-cell interaction, Leukemia, Biophysical
1. Introduction
Endothelial cell (EC) activation and its subsequent intercellular interactions can have significant effects on the regulation of various inflammatory responses and can be causative in generating altered microenvironments that play a role in many biological disorders, such as leukemia and drug induced vascular injuries.(Oshima et al. 2001; Pezeshkian et al. 2013; Zhang et al. 2010) It has been shown that various factors (e.g. TNF-α, leukemic cells) can induce EC activation(De Assis et al. 2000; Stucki et al. 2001; Woodfin et al. 2009) resulting in altered cell morphology as well as increased expression of various cytokines and cell adhesion molecules (CAMs) such as E-selectin, ICAM and VCAM as shown in scheme 1.(Carlos et al. 1990; Osborn et al. 1989; Shi et al. 2004) Many of these molecules serve as biomarkers for EC activation,(Zhang et al. 2010) with the kinetics of expression directly correlating to the extent of EC activation. Furthermore, these molecules also support leukemic blast and leukemia initiating stem cell (LSC) adhesion to ECs, thereby making a significant contribution in leukemic growth and survival.(Hatfield et al. 2006; Li et al. 2010; Li et al. 2004; Salter et al. 2009) We recently demonstrated the direct role of EC activation in promoting chemo-resistance of acute myeloid leukemia (AML) cells.(Pezeshkian et al. 2013) We found that AML cells were able to induce the activation of resting ECs leading to subsequent adhesion of AML cells through CAMs including E-selectin. Adherence induced a quiescent phenotype that protected AML cells from chemotherapy. Interestingly, adherent leukemia cells could later detach and become proliferative, initiating a process resembling relapse. Furthermore, differing leukemia subtypes modulate the EC activation process to varying degrees, which may explain the varied chemotherapeutic responses and relapse rates in different patients. These studies suggest that methods to analyze the propensity of patient specific AML cells to activate ECs may provide an indication of response to therapy and prospectively measure the likeliness of relapse.
Conventionally, EC activation and the subsequently induced cellular interactions(Jin et al. 2006; Sipkins et al. 2005; Wang et al. 2007) are inferred via molecular analyses at the transcriptome or proteome levels with concurrent determination of CAM expression, cell attachment properties, cytokine and chemokine secretion as well as changes in cell morphology and gene expression patterns.(Zhang et al. 2010) Unfortunately, most of these methods are time consuming, may require supportive studies using in vivo transplantation in animal models, and provide only retrospective analyses with no real-time information. The quickest method that exists is to measure changes in cell surface expression of biomarker proteins (e.g. CAMs) that are known to be altered during EC activation. Many of these studies are approached using flow cytometry or immunohistochemical staining methods. However, there are two major issues with these approaches. First, the selection of one or even more biomarkers (Zhang et al. 2012) cannot be a true representative of the actual scenario involving multifactor,(de Pablo et al. 2013) thus producing misleading results. Even for the selected biomarker proteins, the kinetics of expression may also be different.(Duda et al. 2006) Second, numerous biomarkers for EC activation are not considered to be endothelial specific (Pepene 2012) and can originate from multiple types of cells (e.g. neutrophils, lymphocytes). In order to address these issues, we take a biophysical approach to view EC activation where a population of ECs and the surrounding microenvironment can be considered as an ensemble. EC activation and subsequent adherence of leukemia cells can generate phenotypic alterations in this ensemble, leading to variable cell contacts to the substrate. Thus, by quantifying these mechanical changes, the process of EC activation and the related physiological phenomena can be monitored non-invasively and in real-time. However, the usually employed optical techniques are mostly based on endpoint analysis,(Sullivan et al. 2012) thus barring the benefits of this biophysical monitoring. Contrarily, the mechanical phenotyping (Remmerbach et al. 2009) can provide broad scale as well as targeted screening for earlier diagnosis and improved survival rates.
Theoretical description of quartz crystal microbalance (QCM) provided in the supporting information (SI) indicates that this is one of the best techniques to probe such cellular interactions by relating the biophysical changes in cells to the QCM frequency and energy dissipation. However, the decay length of QCM shear wave is in the nanometer range making it only a surface technique, not able to monitor the cell-cell interactions which are larger in size, e.g. the size of ECs is several microns. But with the described ensemble of cells and their microenvironment, a scenario of mass and viscoelastic changes is created, that can be related to the interaction events of different cells as shown in the pioneering work from Wegener et al(Wegener et al. 1998; Wegener et al. 2000) and Janshoff et al(Janshoff et al. 1996) for the adhesion of different cell lines onto the QCM surface. More recently, even the cell surfaces has been modelled for their protein binding and other characteristics(Li et al. 2005) using a similar approach which has also been detailed in some good reviews.(Saitakis and Gizeli 2012) Under these scenarios, QCM can innovatively and quantitatively determine these cellular events. Over the years, Dickert et al (Jenik et al. 2009a; Jenik et al. 2009b; Latif et al. 2013; Seifner et al. 2009) have also used QCM sensors to measure different biospecies, however, by using non-cellular response elements (e.g., molecularly imprinted polymers). Contrarily, we have used ECs by themselves as the response element both for measuring their own biophysical changes during activation and their interactions with leukemia cells. Moreover, these determinations are all real-time, more facile than traditional complicated methods, and more of a true representation of what is happening in vivo as the measurements are done with the whole cell system rather than by analyzing a single biomarker.
Based on our previous findings, we believe that EC activation and subsequent leukemia cell adherence can serve as a novel model, and first ever example, to test our strategy. A cross-validation of the QCM results with electrochemical measurements and microscopic observations, in conjunction with our detailed biological study of these events(Pezeshkian et al. 2013) show a strong coherence of the results. Moreover, the technological and procedural ease of this presented protocol is quite significant. Thus, a simple but efficient strategy is presented here which not only provide important information regarding EC activation and subsequent adherence of leukemia cells in real-time, but also can be employed for discrimination and quantification of two kinds of leukemia cells. Thereby, this biosensor construct aims to identify disease stage and potential for relapse as well as aiding in identifying best course of chemotherapy treatment for patients with leukemia in the near future.
2. Physical Origin of the Response Mechanism
As per many physical models, individual cells can be considered as viscoelastic shells around a liquid core.(Wottawah et al. 2005) When they adhere to the QCM surface, they reconfigure to a flat interface depending upon the mechanical strength and the contact force.(Honda et al. 2004) This results in a change in mechanical energy of the cell(Katira et al. 2012) which has been described in detail in SI. Briefly, this change is dependent upon three factors: 1) the stretching force on the cells, 2) the number of adherent cells and the type of binding, and 3) the changes in osmotic pressure due to intake and release of materials. Furthermore, due to peculiar response mechanism of the QCM depending upon the generation of shear transverse waves that decay rapidly within a viscous media such as living cells, the mechanical properties of the narrow cleft between cell and substrate can only influence the composite QCM response(Wegener et al. 2000) while the apical cell surface having no impact as depicted in Figure 1. This response can be analyzed by Mason's model(Bandey et al. 1999) connecting energy loss experienced by an acoustic wave during its propagation to the mass and viscoelastic changes in the contacting medium. For interpreting our system comprising ECs and adherent leukemia cells, the model of overall mechanical energy can be utilized as discussed in SI. It is well known that the activation of ECs by the external or internal stimuli or by activating agents like TNF-α results in a morphological change in EC and reduced cell-surface contact to the QCM substrate. This should result in a reduction of stored energy affecting the inductance as well as frequency. The frequency of the QCM electrode should increase because of higher oscillation due to lower load. On the other hand, due to decreased cell contact to the substrate, the cell bodies lie at larger distances from the oscillating QCM electrode. Thus, the decay length of the penetrating waves will be higher resulting into a decreased damping of the waves, and decreased motional resistance (R1). Both these parameters are easy to measure and can be quantitatively related to the extent of activation of the ECs. When leukemia cells adhere to activated ECs, a reverse of the above process is initiated. The adherence of leukemia cells can exert a mechanical force, which can be considered as an additional load thereby affecting the QCM frequency. Although this additional load lies outside the range of the penetrating wave as shown in Figure 1, thus seems to be undetectable. However, the effect of this load can deform the underlying activated ECs. This may change their cell contacts to the substrates, depending upon the type and size of the adhering cells, their interaction mechanisms to ECs, and the number of cells being adhered. All these factors bring corresponding changes of frequency and damping resistance of the QCM, which then can be used to quantitatively estimate the adherence of cells. Thus, the cell-cell interactions of the chosen model system can be monitored by a surface technique, rather than by invasive protocols.
Figure 1.
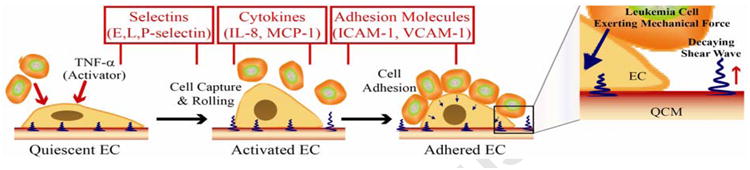
Schematic illustration of morphological changes in ECs at different stages of activation and binding with other cell lines while also showing the corresponding release of various adhesive molecules at these stages; Zoom in: the illustration of the interface showing the direction of shear wave and demonstrating that the decay length of the waves is much shorter than the size of immobilized endothelial cells, thus allowing the leukemia cell to only lie outside this boundary of decaying waves.
3. Experimental Design
3.1. Materials and apparatus
Tumor necrosis factor-alpha (TNF-α) was purchased from HUMANZYME (USA). Phosphate-buffered saline (PBS, 0.1 M, pH 7.4) was purchased from Invitrogen and employed in the electrochemical measurements.
The gold QCM consists of a thin AT-cut quartz crystal wafer with a gold electrode on each side (9 MHz, non-polished with ∼1000 Å gold, geometric area is 0.28 cm2, Beijing Chenjing Electronics Co., Ltd., China). It was mounted between two biocompatible silicon O-rings to allow only one side of the gold electrode to be exposed to the liquid. The reaction chamber above the crystal was held with a 1 mL chlorinated polyethylene centrifugal tube. The device, being covered, was placed in a humidified CO2 incubator controlled at 5% CO2 and 37 °C to prevent evaporation from the culture holder. RQCM instrument (Maxtek Inc., USA) was used to simultaneous recording of resonant frequency (f0) and motional resistance (R1) of the QCM electrodes. Cyclic voltammetry (CV) and electrochemical impedance spectroscopy (EIS) experiments were performed with a potentiostat/galvanostat (EG&G Par model 2263) by using a three-electrode electrolytic cell. QCM gold electrode acted as the working electrode. A Ag/AgCl reference electrode (saturated KCl) served as the reference electrode. A platinum wire served as the counter electrode. The cell-modality observation was performed using an inverted optical microscope (Nikon TMS-F, Japan) with a digital camera (SPOT, 1600×1200 pixels, Diagnostic Instrument Inc. USA).
3.2. Cell culture and measurement procedures
Human umbilical vein endothelial cells (HUVECs), acute myelogenous leukemia cell (AMLC) lines HL-60 and KG-1 were cultured at Biology Department, at Oakland University, and were maintained at 37°C in a CO2 incubator. HUVECs were cultured in EGM-2 medium (500 mL Endothelial Basal Medium-2/EBM-2 supplemented with EGM-2 Single Quotes: 10 ml FBS, 0.2 ml hydrocortisone, 2 ml hFGF, 0.5 ml VEGF, 0.5 ml IGF-1, 0.5 ml ascorbic acid, 0.5 ml hEGF, 0.5 ml GA-1000, 0.5 ml heparin; Lonza, USA). HL-60 and KG-1 cells were grown in Iscove's Modified Dulbecco's Medium (IMDM, Hyclone, USA) supplemented with 20% fetal bovine serum (FBS, Gibco, USA).
After being sterilized with 75% ethanol under UV light for 0.5 h, the QCM culture-chamber was washed thrice with PBS. Then 500 μL of EGM-2 medium was added and the entire culture-chamber was put into the incubator. As soon as the QCM readout reaches a stable baseline, 50 μL of EGM-2 medium containing freshly trypsinized 3×10⁴ cells was added. All QCM measurements were performed in a static mode without stirring. The Δf0 and ΔR1 responses were simultaneously monitored in the process of cell attachment and growth in the next 24 hours. Next, EGM-2 medium was replaced by one containing 10% FBS and TNF-α with specified concentration, allowing the HUVECs to suffer growth and activation up to 20 hours. After the concentration of HL-60 and KG-1 cells reached 5×10⁶ cells mL-1, they were collected from the medium by centrifugation at 1500 g for 5 min to remove IMDM, and re-suspended with EGM-2 medium supplemented with 10% FBS. The density of these suspension cells was determined with a hemacytometer. Finally 100 μL of the cell-suspending solution was added into the measuring chamber. The Δf0 and ΔR1 responses were simultaneously monitored for 22 hours. The gold QCM electrode regeneration was achieved by dealing with trypsin for 24 h, followed by washing with piranha solution (H2SO4:H2O2, 7:3) and water in sequence for several times. After cleaned in this way, the QCM gold electrode could be used repeatedly with good recovery of its initial f0 and R1 values.
4. Results and Discussion
4.1. Adhesion of HUVECs and their activation by TNF-α
The real time attachment, spreading and growth process of human umbilical vein endothelial cells (HUVECs) on QCM gold electrode and the cell responses to the stimulation by TNF-α were investigated and the results are shown in Figures 2A and 2B. Animal cells can be considered to consist of viscoelastic shells surrounding a liquid core. The shells represent a denser actin cortex whereas the core represents a relatively fluidic cell interior.(Wottawah et al. 2005) Moreover, most cells (Diameter ≈10-20 μm) are much larger in size than the characteristic decay length of the QCM shear wave (δ≈ 0.188 μm for 9 MHz crystal in water).(Lin and Ward 1995) Therefore, the cell layer represents a very complex entity as seen from QCM data interpretation and modeling perspective where only a small part of cells can be detected by the shear wave. This layer is heterogeneous both laterally along the sensor surface and perpendicular to the sensor surface. Thus, unlike thin rigid films, the signals from the cell require more advanced modeling. As per the two layer model proposed by Tymchenko et al(Tymchenko et al. 2012) and described in SI, it is reasonable to assume that the QCM responses are dominated by viscoelasticity effects,(Granstaff and Martin 1994; Kanazawa and Gordon 1985; Martin et al. 1991) except in the first phase following introduction of cells to the measurement chamber where cells adhere to QCM via gravity forces. Thus, the mass effects are minimal during activation phase.
Figure 2.

Real-time Δf0 (A) and ΔR1 (B) responses to the successive addition of 3×10⁴ HUVECs and TNF-α with different concentrations (24 h later). (C) Plot of |(Δf0)n-(Δf0)0| vs cTNF-α. (D) Plot of |(ΔR1)n-(ΔR1)0| vs cTNF-α. Results are presented as mean ± SD (error bar) of triplicate experiments.
Before addition of cells, the QCM was initially equilibrated with the blank growth medium for 2 h, and stable baselines for Δf0 and ΔR1 were achieved. This equilibration process is necessary because of two important reasons. One is the changes of QCM-detection environment. The cell chamber containing QCM gold electrode was placed in CO2 incubation, in which temperature, pressure, humidity and CO2 concentration were different with those outside the incubator. The environmental changes might result in the shifts of QCM signals. Another is the interaction between growth medium and the electrode surface. In this work, EGM-2 medium containing 2% fetal bovine serum and many biomolecules including hFGF, VEGF, IGF-1, ascorbic acid, hEGF, GA-1000 and heparin were employed in the real-time cellular analysis. These proteins and amino acids can be adsorbed and produce a protein-covered layer on the gold electrode surface, which could lead to the changes of QCM signals. Once the Δf0 and ΔR1 signals attained a base line after 2 hours, suggesting that the QCM electrode reached a relatively stable stage, the subsequent cell adhesion steps could be started.
In addition, the obvious overshoot signals could be observed in the Δf0 and ΔR1 curves after addition of new samples such as HUVECs and TNF-α. These are related again to the changes of environments in CO2 incubator from manually operating the incubator door in the process of the sample addition. However, these signals had almost no influence on the final cell analysis because the Δf0 and ΔR1 signals could be recovered to original baseline in half an hour.
According to the QCM responses, the cell action may essentially be divided into four stages, i.e., Stage I (0-1.2 h), Stage II (1.2-5.0 h), Stage III (5.0-24 h) and Stage IV (24-41 h). In general, three important phases are included in the generation of cells cultured in vitro: adhesion phase, latent phase and logarithmic growth phase (Situ, Z.; Wu, J. Cell Culture, 2th ed. World Publishing Inc.: Xi'An, 2004.) which are represented by stages I-III respectively, in the QCM response. In Stage I, HUVECs underwent sedimentation and reached the electrode surface under the influence of gravity, after they were added into the incubation chamber. Immediately after, these cells could react with some cell adhesive proteins including fibronectin on the electrode surface, which were initially present in growth medium, and complete the cellular adhesion process. This complicated procedure resulted in the notable decrease of frequency i.e., ∼320 Hz and increase of resistance i.e., ∼70 Ω. Subsequently, the trends of Δf0 and ΔR1 were reversed in Stage II, suggesting the advent of the latent phase in which cells changed or rearranged their cytoskeletons. However, both the frequency and resistance shifts are ∼30% of what is observed in stage I. Moreover, the frequency and resistance shifts are coherent to each other in the two stages, which can only be correlated to changes in cytoskeleton and cell contacts to the surface without involving any shrinkage of the cells, reaching a dynamic equilibrium in the end.
In Stage III, the QCM responses suffered minor but continuous frequency and resistance shifts which were opposite to Stage II, depicting the evolution from the latent phase to the logarithmic growth phase. Theoretically the cell population should be doubled in Stage III. Scheme S2 describes the process of cellular division and proliferation on the QCM gold electrode. As indicated in the earlier report, the QCM response is highly dependent upon the cell coverage on the electrode and the contact area.(Redepenning et al. 1993) It is possible that the contact area of cells on the electrode surface increased to a smaller extent during cell division. Cellular proliferation is a slow process in which cells undergo gradual expansion. In other words, the cell coverage on the electrode surface was increasing at a slower rate. As a result, the minor but continuous frequency and resistance shifts rather than great QCM signal changes were observed in Stage III. From this figure, the statistical conclusions regarding the reproducibility of the data can also be drawn. In particular, biological systems show substantial individual deviations between different cells which can result in low reproducibility. However, in this case, there is ∼10% deviation for QCM response at stage I for all the experiments, that is further reduced to ∼5-6% in the subsequent stages, thus making the data very reliable. The time scale of this technique indicates its possible involvement in rapid screening of such phenomena especially in disease microenvironments, in comparison to biological studies, which are more specific, however, requiring tedious procedures and demanding expertise. Unfortunately, most of these methods are time consuming, may require supportive studies using in vivo transplantation in animal models, which may take many days to be completed and still provide only retrospective analyses with no real-time information. Surface techniques like Surface Plasmon Resonance (SPR) are usually unable to detect such changes and on the other hand, many cell based electrochemical protocols e.g., Electric cell-substrate impedance sensing (ECIS) are limited only to end point analysis.
The addition of TNF-α at the 24th hour led to obviously different QCM shifts (Stage IV). The Δf0 was positive while ΔR1 was negative, gradually reaching to the plateaus. The extent of these changes was enhanced with increasing TNF-α concentrations which were ranging from 0-400 ng ml-1. The increased Δf0 and decreased ΔR1 values in the presence of TNF-α indicate the decline of the cell coverage that should be derived from the activation of HUVECs, leading to the decrease of the contact area between cells and the electrode surface. Moreover, in stage IV, the frequency shifts were 15% and resistance changes were 7% as compared to those in stage I, for the maximum reported concentration of TNF-α. This means that shift in resistance value is much smaller than the shift in the frequency value. This obviously smaller shift of the resistance in comparison to the frequency suggests that contacting film has become more rigid after stimulation by TNF-α. This indicates that, in addition to decreased cell surface contacts, some changes in fluidic cell interior may also occur which can be associated to the expression of CAMs. Another possibility is the release of water from the cortex as a result of changes in osmotic pressure due to EC activation,(Katira et al. 2012) the consequence of which is a more rigid cell layer. Therefore, the frequency changes are larger than the resistance changes. Nevertheless, the subtlety of these changes is of such a magnitude, that it can only be detected by the QCM technology, and with combined analysis of the frequency and motional resistance. The appearance of the signal plateaus after cell activation suggests that the adhered HUVECs retained their activity, instead of being detached from the electrode or being inactive. Here |(Δf0)n-(Δf0)0| and |(ΔR1)n-(ΔR1)0| are defined as the changes of Δf0 and ΔR1 signals induced by TNF-α, respectively, where (Δf0)0, (ΔR1)0, (Δf0)n and (ΔR1)n represent the frequency and resistance shifts attributed to cell action in the absence and presence of TNF-α, respectively. As shown in Figures 2C and 2D, the values of |(Δf0)n-(Δf0)0| and |(ΔR1)n-(ΔR1)0| were found to be proportional to the TNF-α concentration, which means that TNF-α with high concentration had the greatest influence on the activation of HUVECs, resulting in the shrinkage of the cell adhesion area as well as the expression of adherent molecules to greater extents. The Δf0 and ΔR1 signals in Figure 2 were analyzed for the QCM response mechanism. Figure S3 (A, B, C & D) show the relationship between Δf0 and ΔR1 in Stages I, II, III and IV, respectively. In all these events, the |Δf0/ΔR1| ratio is smaller than 10 Hz Ω-1, the theoretical threshold value for a 9 MHz QCM crystal for having dominant mass effect.(Xie et al. 1999a) Therefore, all these events can be considered to be controlled by viscoelastic changes. However, this ratio is largest for stage IV indicating increased involvement of the mass changes in this stage, as affected by the processes associated with EC activation.
The microscopic images proved the validity of the QCM experimental results. As shown in Figure 3, the adhered HUVECs, being closely interconnected, were regular polygons in the absence of TNF-α. The average size of cells is ≈ 17 μm as described in Countess™ Cell Data Sheet from Invitrogen. After stimulation by TNF-α, HUVECs gradually became slim and presented shapes resembling small rods with obviously decreased spreading area and increased cell-cell separation. The shape-change of cells was more obvious in the presence of TNF-α with high concentration, meaning that TNF-α could effectively induce the activation of HUVECs in a dose-dependent manner which has also been shown in our biological study.(Pezeshkian et al. 2013) As a result, the shrinking of the cell spreading area would decrease the density and viscosity of the cell layer on the electrode surface, leading to the QCM signals opposite to those in stage III (curves b-d in Figure 2).
Figure 3.
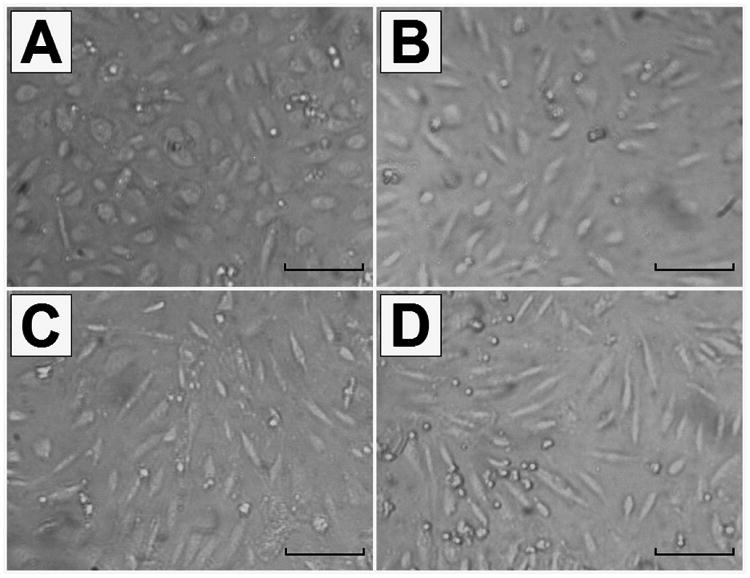
Microscope images of HUVECs taken with a 10× objective in the absence (A) and presence of 40 ng mL-1 TNF-α (B), 200 ng mL-1 TNF-α (C) and 400 ng mL-1 TNF-α (D). The scale bar represents 50 μm.
4.2. Binding of AML cells on the activated endothelial cells
Given our finding that different Acute Myeloid Leukemia (AML) subtypes induce varying levels of EC activation,(Pezeshkian et al. 2013) two AML cell lines, i.e., HL-60 and KG-1 cells were investigated for their binding with activated ECs, on the QCM gold electrode. The results of control experiments are shown in Figure S4 where the leukemia cells were directly added to the bare Au QCM electrode. Minor Δf0 shifts and almost unchanged ΔR1, besides the overshoot signals from the cell addition, can be observed after addition of 25×104 AML cells, meaning that only a few AML cells could be directly adsorbed on the gold electrode as leukemia cells usually grow in suspension. The introduction of AML cells directly onto HUVECs attached on the gold electrode could not induce substantial changes in real-time QCM plots as shown in figure S5. The Δf0 and ΔR1 shifts attributed to the adhesion and growth of HUVECs retained their initial changing trends in the presence of HL-60. With KG-1 cells, a slight shift is, however, observed suggesting that AML cells especially KG-1 have the ability to activate ECs. This is in agreement with our data showing that KG-1 cells have a higher propensity to activate and adhere to ECs as compared to HL-60 cells.(Pezeshkian et al. 2013) The relatively small activity with AML cells suggest that this biosensor construct should use pre-activated ECs for further analysis.
Next, we performed the QCM measurements on the addition of AML cells on HUVECs that were previously activated by TNF-α and the results are shown in Figure 4. Parallel experiments were conducted for minimum of 3 times, and the results including the changing trends and the data values of the QCM responses were well reproduced (RSD<6% for the final Δf0 and ΔR1 responses for identical electrodes). These studies were used to demonstrate the efficacy of the model system and to test that biosensor sensitivity may be linked to the kinetics of EC activation. Here, the whole QCM responses can be divided into three stages. The Δf0 and ΔR1 changes in Stages I and II were derived from the adhesion, growth and activation of HUVECs. Again the data show high reproducibility for the two experiments. In Stage III, the addition of AML cells gave some interesting signals. One can find the obviously decreased Δf0 and increased ΔR1 shifts (-19.5 Hz and 1.5 Ω for HL-60 cells; -100 Hz and 4 Ω for KG-1 cells) based on a comparison between the QCM responses at the 44th hour and those at the 66th hour. Obviously the changing degree of the QCM signals in the presence of KG-1 cells was larger than that in the presence of HL-60 cells. It has been reported that the activation of endothelial cells induced by some activators such as TNF-α and IL-1β can upregulate the expression of cellular adhesive molecules (CAMs) including E-selectin, ICAM-1, VCAM-1 on cells.(Krieglstein and Granger 2001; Tailor and Granger 2000) The QCM experimental results indicate that there were intensive interaction between AML cells and HUVECs that were previously activated by TNF-α. These interactions are markedly higher with KG-1 versus HL-60 cells i.e., ∼5 times as indicated from frequency and resistance changes. The biological study shows it to be 3-4 times demonstrating similar results.(Pezeshkian et al. 2013) This finding further shows the ability of the biosensor to differentiate between AML cells with varied abilities to adhere to activated ECs. It is known that R1 represents the energy dissipation of the quartz crystal resonance into the surrounding environment and the onset responses of R1 can, in principle, be understood from changes in density and viscosity of solution and the cell layer adsorbed onto the electrode surface etc.(Xie et al. 1999b) The enhanced ΔR1 shifts in Stage III suggest that the binding of AML cells with HUVECs induced the increase of the cell layer density and viscosity on the electrode. Furthermore, the |Δf0/ΔR1| ratios after introduction of HL-60 cells and KG-1 cells were calculated to be 13 Hz Ω-1 and 25 Hz Ω-1, respectively, meaning that the mass effect was a main factor controlling the QCM signal shift, i.e., the adhesion of AML cells on HUVECs could result in the mass change of the cell layer at the interface.
Figure 4.

Real-time Δf0 (A) and ΔR1 (B) responses to the successive addition of 3×10⁴ HUVECs, 200 ng mL-1 TNF-α (24 h later) and 25×104 HL-60 cells (a) or 25×104 KG-1 cells (b) (45 h later).
Figure S6 shows the CV and EIS experimental results using the QCM gold electrodes modified with different cells. The peak current responses were decreased with the increased peak to peak separation and the Nyquist diameter was enhanced to a large extent after the immobilization of HUVECs, revealing that the adhered cells efficiently blocked the electron transfers of ferri-/ferrocyanide probe. It seems that the activation of HUVECs had little influence on the electrochemical properties of the cell modified electrode. The above-mentioned electrochemical parameters were further changed with the introduction of AML cells, proving the leukemia cells were effectively captured by the activated ECs. The negative effect of KG-1 cells on the electron transfer was more obvious as the KG-1 cell-bound electrode presented smaller peak current responses and larger electron transfer resistance than the HL-60 cell-bound electrode did, which demonstrate that it is easier for KG-1 cells to be bound on the activated HUVECs. We have also shown that KG-1 have a higher propensity to activate and adhere to HUVECs compared to HL-60s using E-selectin as a biomarker.(Pezeshkian et al. 2013)
The microscope observation of the bound AML cells was performed and the results are shown in Figure S7. Similar numbers of HL-60 and KG-1 cells were introduced onto resting and activated HUVECs in a 96 well plate. Twenty two hours later, wells were rinsed with PBS three times to remove non-adherent cells and filled with EGM-2 medium. We found that fewer AML cells adhered to resting HUVECs in comparison to activated HUVECs. In addition, the numbers of adherent KG-1 cells was larger than that of HL-60 cells. These images indicate that the activation of HUVECs is an important factor leading to the binding of AML cells. The expression of CAM receptors on KG-1 cells may be dominant than that on HL-60 cells, which could explain the stronger adhesion. The information revealed by the CV and EIS experiments as well as the microscope observation are all in complete accordance with the QCM measurements.
Indirect evidence of EC activation and the binding of the leukemia cells with only the activated cells came from a control experiment where we added 1 μg ml-1 of anti-E-selectin antibody after the addition of TNF-α into the measurement chamber and before the introduction of AML cells. The results are shown in Figure 5. The experiment shows the reproducibility with the deviation calculated to be < 10%. Especially the motional resistance data is a replica of each other. The activation by TNF-α caused very similar change both in frequency and motional resistance as observed in the previous experiments. However, the addition of anti-E selectin antibody could block E-selectin, thereby restricting the binding of the HL-60 and KG-1 cells even to the activated ECs. Biological study(Pezeshkian et al. 2013) shows that the addition of anti-E-selectin antibody to activated EC decreased the adhesion of KG-1 cells up to more than 50%. Additionally, when KG-1 cells were bound to the activated EC, the addition of anti-E-selectin antibody can induce the release of adherent KG-1 cells. Here the addition of anti-E-selectin antibody caused no change in frequency and resistance trend lines. It is likely that the binding of anti-E-selectin antibody to E-selectin on the activated EC cell surface is beyond the decay length of QCM shear wave. Further addition of leukemic cells produced no measurable signals when we compare them to the ones shown in Figure 4. This means, that the activated ECs behaved in a manner more like the non-activated ones, as most of their binding sites have been blocked by the anti-E-selectin antibody.
Figure 5.

Real-time Δf0 (A) and ΔR1 (B) responses to the successive addition of 3×10⁴ HUVECs, 200 ng mL-1 TNF-α, 1 mg mL-1anti-E-selectin, and 25×104 HL-60 cells (a) or 25×104 KG-1 cells (b) (24 h later).
4.3. Discrimination and quantification of AML cells
The above studies confirmed our previous findings that AML cells adhere to activated HUVECs based on binding with E-selectin. It is possible that the extent of activation of HUVECs, which is closely related to TNF-α concentration, should have an influence on the binding of AML cells. Figures 6A and 6B show the QCM responses induced by the addition of KG-1 cells with the same concentration on activated HUVECs after stimulation of TNF-α with different concentrations. One can find from Figures 6C and 6D that the QCM response shifts (|Δf0| and ΔR1 changes) were all increased with enhancement of TNF-α concentrations in the range of 2-200 ng mL-1 and then suffered a slight decrease when the concentration of TNF-α was further increased. This data demonstrates that the extent of activation, promoted by TNF-α, directly correlates to the level of adhesion of KG-1 cells and this overall activity can be measured by our biosensor. The decreased QCM response shifts using TNF-α with higher concentration such as 400 ng mL-1 might be related to the over activation and apoptosis of endothelial cells,(Grethe et al. 2004; Polunovsky et al. 1994) which could have a negative effect on the adhesion of KG-1 cells. So the concentration of TNF-α, 200 ng mL-1, was selected for the next measurements.
Figure 6.

Real-time Δf0 (A) and ΔR1 (B) responses to the addition of 25×104 KG-1 cells on Au/activated HUVECs after activation by TNF-α with different concentrations. Results are presented as mean ± SD (error bar) of triplicate experiments.
Figures 7A1 and 7B1 show the Δf0 shifts induced by the addition of different numbers of HL-60 and KG-1 cells on activated HUVECs, respectively. Obviously the frequency was decreased with the introduction of AML cells, which was enhanced with the increasing number of suspension cells. In the presence of KG-1 cells, this shift was larger than that in the presence of HL-60 cells, indicating that both AML cells were successfully bound on the activated HUVECs, however, it was easier for KG-1 cell to be captured. Figures 7A2 and 7B2 show the relationship between |(Δf0)n-(Δf0)0| and the number of HL-60 and KG-1 cells, respectively. The |(Δf0)n-(Δf0)0| is defined for the decrease of Δf0 signals, where (Δf0)0 and (Δf0)n represents the frequency change in the absence and presence of AML cells, respectively. The value of |(Δf0)n-(Δf0)0| represents the net frequency responses derived from the AML cell binding. It can be found that |(Δf0)n-(Δf0)0| exhibited a linear response with respect to cAml over the range of the AML cell numbers from 0 to 25×104 cells. The regression equations were |(Δf0)n-(Δf0)0| = 2.19 Ncell (×104) + 1.69 for HL-60 cells and |(Δf0)n-(Δf0)0| = 4.27 Ncell (×104) – 0.20 for KG-1 cells, respectively, with a high correlation coefficient of 0.997. The above results indicate that the method demonstrated here provide a valid strategy for quantitative detection of adherent AML cells and for discrimination between two types of leukemia cells, i.e. HL-60 cells and KG-1 cells.
Figure 7.

Real-time Δf0 responses to the addition of HL-60 cells (A1) and KG-1 cells (B1) with different concentrations on Au/activated HUVECs. (A2) Plot of |(Δf0)n-(Δf0)0| vs cHL-60 cells. (B2) Plot of |(Δf0)n-(Δf0)0| vs cKG-1 cells. Results are presented as mean ± SD (error bar) of triplicate experiments.
5. Conclusions
The attachment and growth of HUVECs, their activation by TNF-α and subsequent binding of HL-60 and KG-1 leukemia cell lines were studied on the QCM gold electrode. The results showed obvious Δf0 and ΔR1 shifts that can be related to mechanical energy changes of these cells via simple models described. The activated HUVECs underwent expected cell-shape changes accompanied with decreased spreading area, leading to the decline of density and viscosity of cell layer on the electrode surface, which was revealed by the QCM, CV, EIS and microscopic measurements. It was difficult for AML cells, which grow in suspension, to bind the gold electrode or resting HUVECs. However, these suspension cells could be effectively captured by activated HUVECs that could express sufficient CAMs after stimulation by TNF-α, presenting the decreased Δf0 and increased ΔR1 shifts, which were mainly attributed to the mass effect. The sensitivity of the method validated its use for discrimination and quantification of different AML cells based on QCM responses. This study validates that QCM techniques can sensitively and quickly measure changes in cell activity particularly cell -cell interactions such as those inherent to EC activation and provide real time data in comparison to traditional techniques (e.g. flow cytometry and IHC assays). Furthermore it suggests that EC activation can be used as a biomarker of AML disease states by detecting EC activation and leukemia cell adhesion on ECs by potentially using a small quantity of peripheral blood cells from patients. Additionally, this label free biosensor can find wide application in the real-time and non-invasive investigation on intercellular actions in vitro which can help clinicians better understand the patients' response to chemotherapy using a fast, less expensive and accurate tool to aid them in strategizing the most effective chemotherapy treatment protocol.
Supplementary Material
Monitoring Endothelial Cell Activation Real Time
QCM is Used as an Innovative Tool
Monitoring of Leukemic Cell Adherence to Activated ECs
Relating Cell Adherence to Leukemia Disease States
Real Time and Label Free Data Collection
Acknowledgments
X Zeng likes to thank partial support from NIH grant R21EB009513-01A1 and Oakland University REF support.
Footnotes
Appendix A. Supplementary Data: Supplementary data associated to this article containing theoretical explanation of QCM pertaining to this study, Schemes S1-S2, and figures S1-S6 as noted in the text can be found in the online version.
Publisher's Disclaimer: This is a PDF file of an unedited manuscript that has been accepted for publication. As a service to our customers we are providing this early version of the manuscript. The manuscript will undergo copyediting, typesetting, and review of the resulting proof before it is published in its final citable form. Please note that during the production process errors may be discovered which could affect the content, and all legal disclaimers that apply to the journal pertain.
References
- Bandey HL, Martin SJ, Cernosek RW, Hillman AR. Modeling the Responses of Thickness-Shear Mode Resonators under Various Loading Conditions. Analytical Chemistry. 1999;71(11):2205–2214. doi: 10.1021/ac981272b. [DOI] [PubMed] [Google Scholar]
- Carlos T, Schwartz B, Kovach N, Yee E, Rosa M, Osborn L, Chi-Rosso G, Newman B, Lobb R, M$ R. Vascular cell adhesion molecule-1 mediates lymphocyte adherence to cytokine-activated cultured human endothelial cells. Blood. 1990;76(5):965–970. published erratum appears in Blood 1990 Dec 1;76(11):2420. [PubMed] [Google Scholar]
- De Assis MC, Da Costa AO, Barja-Fidalgo TC, Plotkowski MC. Human endothelial cells are activated by interferon-γ plus tumour necrosis factor-α to kill intracellular Pseudomonas aeruginosa. Immunology. 2000;101(2):271–278. doi: 10.1046/j.1365-2567.2000.00102.x. [DOI] [PMC free article] [PubMed] [Google Scholar]
- de Pablo R, Monserrat J, Reyes E, Diaz D, Rodriguez-Zapata M, de la Hera A, Prieto A, Alvarez-Mon M. Circulating sICAM-1 and sE-Selectin as biomarker of infection and prognosis in patients with systemic inflammatory response syndrome. Eur J Intern Med. 2013;24(2):132–138. doi: 10.1016/j.ejim.2012.10.009. [DOI] [PubMed] [Google Scholar]
- Duda DG, Cohen KS, di Tomaso E, Au AP, Klein RJ, Scadden DT, Willett CG, Jain RK. Differential CD 146 expression on circulating versus tissue endothelial cells in rectal cancer patients: Implications for circulating endothelial and progenitor cells as biomarkers for antiangiogenic therapy. J Clin Oncol. 2006;24(9):1449–1453. doi: 10.1200/JCO.2005.04.2861. [DOI] [PMC free article] [PubMed] [Google Scholar]
- Granstaff VE, Martin SJ. Characterization of a thickness-shear mode quartz resonator with multiple nonpiezoelectric layers. Journal of Applied Physics. 1994;75(3):1319–1329. [Google Scholar]
- Grethe S, Ares MPS, Andersson T, Pörn-Ares MI. p38 MAPK mediates TNF-induced apoptosis in endothelial cells via phosphorylation and downregulation of Bcl-xL. Experimental Cell Research. 2004;298(2):632–642. doi: 10.1016/j.yexcr.2004.05.007. [DOI] [PubMed] [Google Scholar]
- Hatfield K, Ryningen A, Corbascio M, Bruserud Ø. Microvascular endothelial cells increase proliferation and inhibit apoptosis of native human acute myelogenous leukemia blasts. International Journal of Cancer. 2006;119(10):2313–2321. doi: 10.1002/ijc.22180. [DOI] [PubMed] [Google Scholar]
- Honda H, Tanemura M, Nagai T. A three-dimensional vertex dynamics cell model of space-filling polyhedra simulating cell behavior in a cell aggregate. Journal of Theoretical Biology. 2004;226(4):439–453. doi: 10.1016/j.jtbi.2003.10.001. [DOI] [PubMed] [Google Scholar]
- Janshoff A, Wegener J, Sieber M, Galla HJ. Double-mode impedance analysis of epithelial cell monolayers cultured on shear wave resonators. Eur Biophys J. 1996;25(2):93–103. doi: 10.1007/s002490050021. [DOI] [PubMed] [Google Scholar]
- Jenik M, Seifner A, Krassnig S, Seidler K, Lieberzeit PA, Dickert FL, Jungbauer C. Sensors for bioanalytes by imprinting-Polymers mimicking both biological receptors and the corresponding bioparticles. Biosensors & Bioelectronics. 2009a;25(1):9–14. doi: 10.1016/j.bios.2009.01.019. [DOI] [PubMed] [Google Scholar]
- Jenik M, Seifner A, Lieberzeit P, Dickert FL. Pollen-imprinted polyurethanes for QCM allergen sensors. Analytical and Bioanalytical Chemistry. 2009b;394(2):523–528. doi: 10.1007/s00216-009-2718-8. [DOI] [PubMed] [Google Scholar]
- Jin DK, Shido K, Kopp HG, Petit I, Shmelkov SV, Young LM, Hooper AT, Amano H, Avecilla ST, Heissig B, Hattori K, Zhang F, Hicklin DJ, Wu Y, Zhu Z, Dunn A, Salari H, Werb Z, Hackett NR, Crystal RG, Lyden D, Rafii S. Cytokine-mediated deployment of SDF-1 induces revascularization through recruitment of CXCR4+ hemangiocytes. Nature medicine. 2006;12(5):557–567. doi: 10.1038/nm1400. [DOI] [PMC free article] [PubMed] [Google Scholar]
- Kanazawa KK, Gordon JG. Frequency of a quartz microbalance in contact with liquid. Analytical Chemistry. 1985;57(8):1770–1771. [Google Scholar]
- Katira P, Zaman MH, Bonnecaze RT. How Changes in Cell Mechanical Properties Induce Cancerous Behavior. Physical Review Letters. 2012;108(2):028103. doi: 10.1103/PhysRevLett.108.028103. [DOI] [PubMed] [Google Scholar]
- Krieglstein CF, Granger DN. Adhesion molecules and their role in vascular disease*. American Journal of Hypertension. 2001;14(S3):44S–54S. doi: 10.1016/s0895-7061(01)02069-6. [DOI] [PubMed] [Google Scholar]
- Latif U, Can S, Hayden O, Grillberger P, Dickert FL. Sauerbrey and anti-Sauerbrey behavioral studies in QCM sensors-Detection of bioanalytes. Sensors and Actuators B-Chemical. 2013;176:825–830. [Google Scholar]
- Li B, Bailey AS, Jiang S, Liu B, Goldman DC, Fleming WH. Endothelial cells mediate the regeneration of hematopoietic stem cells. Stem Cell Research. 2010;4(1):17–24. doi: 10.1016/j.scr.2009.08.001. [DOI] [PMC free article] [PubMed] [Google Scholar]
- Li H, Gerald WL, Benezra R. Utilization of Bone Marrow-Derived Endothelial Cell Precursors in Spontaneous Prostate Tumors Varies with Tumor Grade. Cancer Research. 2004;64(17):6137–6143. doi: 10.1158/0008-5472.CAN-04-1287. [DOI] [PubMed] [Google Scholar]
- Li J, Thielemann C, Reuning U, Johannsmann D. Monitoring of integrin-mediated adhesion of human ovarian cancer cells to model protein surfaces by quartz crystal resonators: evaluation in the impedance analysis mode. Biosensors and Bioelectronics. 2005;20(7):1333–1340. doi: 10.1016/j.bios.2004.05.004. [DOI] [PubMed] [Google Scholar]
- Lin Z, Ward MD. The Role of Longitudinal Waves in Quartz Crystal Microbalance Applications in Liquids. Analytical Chemistry. 1995;67(4):685–693. [Google Scholar]
- Martin SJ, Granstaff VE, Frye GC. Characterization of a quartz crystal microbalance with simultaneous mass and liquid loading. Analytical Chemistry. 1991;63(20):2272–2281. [Google Scholar]
- Osborn L, Hession C, Tizard R, Vassallo C, Luhowskyj S, Chi-Rosso G, Lobb R. Direct expression cloning of vascular cell adhesion molecule 1, a cytokine-induced endothelial protein that binds to lymphocytes. Cell. 1989;59(6):1203–1211. doi: 10.1016/0092-8674(89)90775-7. [DOI] [PubMed] [Google Scholar]
- Oshima T, Jordan P, Grisham M, Alexander J, Jennings M, Sasaki M, Manas K. TNF-alpha induced endothelial MAdCAM-1 expression is regulated by exogenous, not endogenous nitric oxide. BMC Gastroenterology. 2001;1(1):5. doi: 10.1186/1471-230X-1-5. [DOI] [PMC free article] [PubMed] [Google Scholar]
- Pepene CE. Soluble platelet/endothelial cell adhesion molecule (sPECAM)-1 is increased in polycystic ovary syndrome and related to endothelial dysfunction. Gynecol Endocrinol. 2012;28(5):370–374. doi: 10.3109/09513590.2011.632792. [DOI] [PubMed] [Google Scholar]
- Pezeshkian B, Donnelly C, Tamburo K, Geddes T, Madlambayan GJ. Leukemia Mediated Endothelial Cell Activation Modulates Leukemia Cell Susceptibility to Chemotherapy through a Positive Feedback Loop Mechanism. PLoS ONE. 2013;8(4):e60823. doi: 10.1371/journal.pone.0060823. [DOI] [PMC free article] [PubMed] [Google Scholar]
- Polunovsky VA, Wendt CH, Ingbar DH, Peterson MS, Bitterman PB. Induction of Endothelial Cell Apoptosis by TNFα: Modulation by Inhibitors of Protein Synthesis. Experimental Cell Research. 1994;214(2):584–594. doi: 10.1006/excr.1994.1296. [DOI] [PubMed] [Google Scholar]
- Redepenning J, Schlesinger TK, Mechalke EJ, Puleo DA, Bizios R. Osteoblast attachment monitored with a quartz crystal microbalance. Analytical Chemistry. 1993;65(23):3378–3381. doi: 10.1021/ac00071a008. [DOI] [PubMed] [Google Scholar]
- Remmerbach TW, Wottawah F, Dietrich J, Lincoln B, Wittekind C, Guck J. Oral Cancer Diagnosis by Mechanical Phenotyping. Cancer Research. 2009;69(5):1728–1732. doi: 10.1158/0008-5472.CAN-08-4073. [DOI] [PubMed] [Google Scholar]
- Saitakis M, Gizeli E. Acoustic sensors as a biophysical tool for probing cell attachment and cell/surface interactions. Cell Mol Life Sci. 2012;69(3):357–371. doi: 10.1007/s00018-011-0854-8. [DOI] [PMC free article] [PubMed] [Google Scholar]
- Salter AB, Meadows SK, Muramoto GG, Himburg H, Doan P, Daher P, Russell L, Chen B, Chao NJ, Chute JP. Endothelial progenitor cell infusion induces hematopoietic stem cell reconstitution in vivo. Blood. 2009;113(9):2104–2107. doi: 10.1182/blood-2008-06-162941. [DOI] [PMC free article] [PubMed] [Google Scholar]
- Seifner A, Lieberzeit P, Jungbauer C, Dickert FL. Synthetic receptors for selectively detecting erythrocyte ABO subgroups. Analytica Chimica Acta. 2009;651(2):215–219. doi: 10.1016/j.aca.2009.08.021. [DOI] [PubMed] [Google Scholar]
- Shi Q, Wang J, Wang X, VandeBerg J. Comparative analysis of vascular endothelial cell activation by TNF-α and LPS in humans and baboons. Cell Biochem Biophys. 2004;40(3):289–303. doi: 10.1385/CBB:40:3:289. [DOI] [PubMed] [Google Scholar]
- Sipkins DA, Wei X, Wu JW, Runnels JM, Cote D, Means TK, Luster AD, Scadden DT, Lin CP. In vivo imaging of specialized bone marrow endothelial microdomains for tumour engraftment. Nature. 2005;435(7044):969–973. doi: 10.1038/nature03703. [DOI] [PMC free article] [PubMed] [Google Scholar]
- Stucki A, Rivier AS, Gikic M, Monai N, Schapira M, Spertini O. Endothelial cell activation by myeloblasts: molecular mechanisms of leukostasis and leukemic cell dissemination. Blood. 2001;97(7):2121–2129. doi: 10.1182/blood.v97.7.2121. [DOI] [PubMed] [Google Scholar]
- Sullivan MN, Francis M, Pitts NL, Taylor MS, Earley S. Optical Recording Reveals Novel Properties of GSK1016790A-Induced Vanilloid Transient Receptor Potential Channel TRPV4 Activity in Primary Human Endothelial Cells. Mol Pharmacol. 2012;82(3):464–472. doi: 10.1124/mol.112.078584. [DOI] [PMC free article] [PubMed] [Google Scholar]
- Tailor A, Granger DN. Role of adhesion molecules in vascular regulation and damage. Current Science Inc. 2000;2(1):78–83. doi: 10.1007/s11906-000-0063-6. [DOI] [PubMed] [Google Scholar]
- Tymchenko N, Nilebäck E, Voinova M, Gold J, Kasemo B, Svedhem S. Reversible Changes in Cell Morphology due to Cytoskeletal Rearrangements Measured in Real-Time by QCM-D. Biointerphases. 2012;7(1-4):1–9. doi: 10.1007/s13758-012-0043-9. [DOI] [PubMed] [Google Scholar]
- Wang L, O'Leary H, Fortney J, Gibson LF. Ph+/VE-cadherin+ identifies a stem cell–like population of acute lymphoblastic leukemia sustained by bone marrow niche cells. Blood. 2007;110(9):3334–3344. doi: 10.1182/blood-2007-01-068122. [DOI] [PMC free article] [PubMed] [Google Scholar]
- Wegener J, Janshoff A, Galla HJ. Cell adhesion monitoring using a quartz crystal microbalance: comparative analysis of different mammalian cell lines. Eur Biophys J. 1998;28(1):26–37. doi: 10.1007/s002490050180. [DOI] [PubMed] [Google Scholar]
- Wegener J, Seebach J, Janshoff A, Galla HJ. Analysis of the Composite Response of Shear Wave Resonators to the Attachment of Mammalian Cells. Biophysical Journal. 2000;78(6):2821–2833. doi: 10.1016/S0006-3495(00)76825-1. [DOI] [PMC free article] [PubMed] [Google Scholar]
- Woodfin A, Voisin MB, Imhof BA, Dejana E, Engelhardt B, Nourshargh S. Endothelial cell activation leads to neutrophil transmigration as supported by the sequential roles of ICAM-2, JAM-A, and PECAM-1. Blood. 2009;113(24):6246–6257. doi: 10.1182/blood-2008-11-188375. [DOI] [PMC free article] [PubMed] [Google Scholar]
- Wottawah F, Schinkinger S, Lincoln B, Ananthakrishnan R, Romeyke M, Guck J, Käs J. Optical Rheology of Biological Cells. Physical Review Letters. 2005;94(9):098103. doi: 10.1103/PhysRevLett.94.098103. [DOI] [PubMed] [Google Scholar]
- Xie Q, Wang J, Zhou A, Zhang Y, Liu H, Xu Z, Yuan Y, Deng M, Yao S. A Study of Depletion Layer Effects on Equivalent Circuit Parameters Using an Electrochemical Quartz Crystal Impedance System. Analytical Chemistry. 1999a;71(20):4649–4656. [Google Scholar]
- Xie Q, Zhang Y, Xu M, Li Z, Yuan Y, Yao S. Combined quartz crystal impedance and electrochemical impedance measurements during adsorption of bovine serum albumin onto bare and cysteine- or thiophenol-modified gold electrodes. Journal of Electroanalytical Chemistry. 1999b;478(1–2):1–8. [Google Scholar]
- Zhang CC, Pavlicek A, Zhang Q, Lira ME, Painter CL, Yan ZM, Zheng XX, Lee NV, Ozeck M, Qiu M, Zong Q, Lappin PB, Wong A, Rejto PA, Smeal T, Christensen JG. Biomarker and Pharmacologic Evaluation of the gamma-Secretase Inhibitor PF-03084014 in Breast Cancer Models. Clinical Cancer Research. 2012;18(18):5008–5019. doi: 10.1158/1078-0432.CCR-12-1379. [DOI] [PubMed] [Google Scholar]
- Zhang J, DeFelice AF, Hanig JP, Colatsky T. Biomarkers of Endothelial Cell Activation Serve as Potential Surrogate Markers for Drug-induced Vascular Injury. Toxicologic Pathology. 2010;38(6):856–871. doi: 10.1177/0192623310378866. [DOI] [PubMed] [Google Scholar]
Associated Data
This section collects any data citations, data availability statements, or supplementary materials included in this article.