

Abstract
Controversy surrounds proper classification of neurodegeneration occurring acutely following neonatal hypoxia-ischemia. By ultrastructural classification, in the first 24 hours after neonatal hypoxia-ischemia in the p7 rat, the majority of striatal cells die having both apoptotic and necrotic features. There is formation of a functional apoptosome, and activation of caspases 9 and 3 occurring simultaneously with loss of structurally intact mitochondria to 34.7±25% and loss of mitochondrial cytochrome C oxidase activity to 34.7±12.7% of control levels by 3 hours after hypoxia-ischemia. There is also loss of the mitochondrial motor protein, kinesin. This combination of activation of apoptosis pathways simultaneous with significant mitochondrial dysfunction may cause incomplete packaging of nuclear and cytoplasmic contents and a hybrid of necrotic and apoptotic features. Evidence for an intermediate biochemistry of cell death including expression of the 17 kDa isoform of caspase-3 in dying neurons lacking a classic apoptotic morphology and degradation of the neuronal cytoskeletal protein spectrin by caspase-3 and calcium-activated calpains yielding 120 kDa and 145/150 kDa fragments, respectively, is also found. In summary, neonatal hypoxia-ischemia triggers apoptotic cascades, and simultaneously causes mitochondrial structural and functional failure. The presence of a ‘continuum phenotype’ of cell death that varies on a cell-by-cell basis suggests that the phenotype of cell death is dependent on the energy available to drive the apoptotic pathways to completion.
Keywords: Continuum cell death, neonatal brain injury, mitochondria, neurodegeneration, ultrastructure
(i) Perinatal asphyxia is a significant cause of perinatal mortality and permanent neurologic morbidity (Ferriero, 2004) but the proper classification of cell death phenotype following neonatal hypoxia-ischemia (HI)* has yet to be agreed upon. It is clear that the developing brain is primed to respond to various forms of injury with activation of apoptosis signaling (Zhu et al., 2005), however, most studies of the neuropathology of neonatal HI fail to demonstrate prominent neuropathologic evidence for apoptosis in the developing forebrain during the acute phase of injury (Towfighi et al., 1995, Northington et al., 2001b). The coexistence of at least three forms of neurodegeneration (apoptosis, necrosis, and a hybrid-continuum form) following neonatal HI and glutamate receptor excitotoxicity have been reported (Northington et al., 2001b, Sheldon et al., 2001). The selection of mode of cell death, necrotic or excitotoxic versus apoptotic, following an insult is in large measure determined by 1) severity of the insult, 2) the glutamate receptor subtype stimulated 3) the degree of cellular calcium overload, and 4) the maturity of the cell type injured. (Ankarcrona et al., 1995, Bonfoco et al., 1995, Portera-Cailliau et al., 1997b, Portera-Cailliau et al., 1997a). Depletion of cellular energy supply and mitochondrial dysfunction is also pivotal to the choice of cell death pathway (Eguchi et al., 1997, Nicotera et al., 1998, Leist et al., 1999, Nicotera et al., 1999b).
The appearance of cellular apoptosis and necrosis occurring in the same cell after a neonatal excitotoxic insult (Portera-Cailliau et al., 1997a) has been termed “apoptotic-necrotic continuum”. This seminal observation accounts for a spectrum of cell death morphologies occurring within the apoptosis-primed developing brain following a single insult, and within single or closely related brain regions, along a gradient of substrate depletion. Another name for this is “pathological apoptosis” (Blomgren et al., 2007). Cells with this hybrid appearance have been observed in the forebrain of neonatal rats following HI (Northington et al., 2001b) (Nakajima et al., 2000) (Sheldon et al., 2001), but the mechanisms for this type of cell death are not known. In this study, we describe the “apoptotic-necrotic continuum” as a major form of neurodegeneration in the neonatal rat forebrain emerging in the first 24 hours following HI as the result of an interruption of apoptosis signaling by mitochondrial structural and functional failure. This unique cell death phenotype exhibits incomplete packaging of nuclear and cytoplasmic contents and loss of mitochondrial structural integrity in brain areas experiencing mitochondrial energy failure and mitochondrial trafficking perturbations. Additionally, there is partial activation of the caspase cascade within ‘continuum’ cells and intermediate forms of cell degradation as biochemical markers of this injury.
(ii) Experimental Procedures
Hypoxia-ischemia in p7 rats
The Rice-Vannucci adaptation of the Levine procedure (Rice et al., 1981) was used to cause HI brain injury in seven day old (p7) rats as described previously (Northington et al., 2001b). For these experiments animals were exposed to FiO2= 0.08 for 150 minutes beginning 1–2 hours following right carotid artery ligation. This duration of hypoxia has previously been shown to cause a severe forebrain injury involving ipsilateral striatum, cortex, and hippocampus (Northington et al., 2001b) and lesser durations of hypoxia result initially in milder degrees of forebrain injury (Geddes et al., 2001).
The animals were euthanized with an overdose of pentobarbital and the brains retrieved at 3, 6, and 24 hours following the end of hypoxia for mitochondrial complex IV activity assay, caspase activity assay and western blotting. The multiple early time points are chosen to delineate the biochemical changes preceding the expression of various phenotypes of cell death. Control groups consisted of sham-operated littermates. Sham controls were sacrificed on postnatal day 7.
All animal studies received prior approval from the Animal Care and Use Committee of Johns Hopkins University School of Medicine and were performed in accordance with the NIH “Guide for the Care and Use of Laboratory Animals”, U.S. Department of Health and Human Services 85–23, 1985.
Tissue preparation
For electron-microscopic analysis or immunocytochemistry, animals were killed with an overdose of pentobarbital, 65mg/kg IP, and exsanguinated with cold 0.1 M PBS (pH7.4) via intra-cardiac perfusion. Brains were perfusion fixed with (2%gluteraldehyde/2% paraformaldehyde-for EM) or (4% paraformaldehyde – for immunocytochemistry) in 0.1M PBS for 30m at 4ml/min. Tissue for EM studies was post-fixed in the perfusion solution but not cryoprotected or frozen. EM samples were postfixed (1h) in 2% osmium tetraoxide, dehydrated, and flat embedded in resin. Plastic-embedded samples were mounted in an Epon block (Electron microscopy sciences, Fort Washington, PA, USA) and cut into semithin (1μm) and ultra thin (70nm) sections for light microscopy and EM respectively. All semithin sections were counterstained with toluidine blue and screened by light microscopy to select sections for viewing by EM. Ultra-thin sections were stained with uranyl acetate and lead citrate and viewed with a JOEL 100S electron microscope.
For immunoblotting and enzyme activity assays, forebrain sections from the area at the core of the HI injury, including ipsilateral striatum and cortex were rapidly micro-dissected under a surgical microscope immediately after euthanasia and frozen on dry ice. 150–200 mg pooled samples (2 hemi forebrain samples) were homogenized in cold 20mM Tris HCl (pH7.4) containing (10% wt/vol) sucrose, 20μ/ml aprotinin (Traysolol), 20μg/ml leupeptin, 20 μg/ml antipain, 20μg/ml pepstatin A, 20μg/ml chymostatin, 0.1 mM phenylmethylsulfonyl fluoride, 10mM benzamidine, 1mM EDTA, and 5mM EGTA. A portion of the resulting crude homogenates was used for enzyme assays. For sub-cellular fractionation for western blotting, crude homogenates were further prepared into soluble and mitochondria-membrane fractions as previously described (Northington et al., 2001a). Protein concentrations were measured by a Bio-Rad protein assay with bovine serum albumin as a standard.
Electron Microscopy evaluation of cell death phenotype and mitochondrial ultrastructure
Ultrathin sections of striatum were viewed on a JOEL 100S electron microscope and individual neurons were photographed at 8-30,000X. Striatum was chosen for examination of cell death phenotype because it lies at the core of the HI injury and striatal neurons are more uniform than those in the overlying cortex. Cell death phenotype was determined using criteria published previously (Portera-Cailliau et al., 1997a) and summarized in the table below. Briefly, cells were classified as necrotic, apoptotic or “continuum” if descriptions of least 2 of the criteria for their nuclear, cytoplasmic or cell membrane structure fit the following classification scheme. For example, neurons with nuclear changes that were apoptotic but with less organized condensation of the cytosol, and an intact cell membrane were classified as “continuum” and conversely, cells with well organized and darkened cytosol containing intact organelles but with multiple irregular chromatin clumps were also classified as “continuum”.
Table.
| APOPTOSIS | NECROSIS | CONTINUUM |
|---|---|---|
| Cytosol: Cytoplasmic condensation and shrinkage, and plasma membrane blebbing, generally intact appearing mitochondria though mitochondria may appear edematous
Cell membrane: Cytoplasmic membrane fully intact Nucleus: Large spherical/globular or cresenteric shaped chromatin clumps tightly compacted into a few (<3–4) fragments whose appearance is reminiscent of developmental ‘programmed cell death, Transformation of the nucleolus into separate granular masses, which unwind, preservation of nuclear membrane |
Cytosol: Complete organelle disruption
Cell Membrane: Swelling and rupture of the cell membrane Nucleus: Watery - ‘clock-face’ appearing nucleus with widely dispersed and very small clumps of chromatin within an intact nuclear membrane (Ishimaru et al., 1999) |
Cytosol: Variably swollen or ruptured organelles within a darkened/partially condensed cytoplasm with vacuolar changes in the perikaryon and occasional autophagocytic inclusions
Cell Membrane: Intact cell membranes Nucleus-Condensed, but not tightly compacted, chromatin clumps less regular in shape and divided into more fragments (>3) than that seen in apoptosis, with partially intact nuclear membrane |
Mitochondrial ultrastructure was examined in the same cells that were examined for overall ultrastructure of cell death. Disintegrating mitochondria were identified by swelling of the inter membrane space, and by disruption and disintegration of inner cristae. Mitochondria ultrastructure was easily discerned at magnifications ≥ 8000x. Percentage of intact to total mitochondria was calculated for individual cells at each time point examined. Mitochondria were examined in at least 25 individual neurons from the forebrain at each time point. Immunocytochemistry: Methods are as described previously (Northington et al., 1996). Briefly Coronal sections (60μ) from perfusion- fixed rat pup brains were pretreated in 50%methanol in 0.3%H2O2 and TBS, permeabilized in 0.4%TritonX-100/TBS and pre-incubated in 4% normal goat serum diluted in 0.1%TX/TBS. Sections were incubated, 48 h at 4°C, in anti-Cleaved Caspase-3 (Cell Signaling Technology, Beverly, MA, USA). After incubation, sections are rinsed in TBS, incubated with the goat anti- rabbit immunoglobulin (Cappel, West Chester, PA), diluted 1:100, rinsed in TBS, and incubated with rabbit peroxidase-antiperoxidase (PAP) complex (Sternberger Monoclonals, Baltimore, MD) at 1:200. After final incubation, sections are rinsed in TBS and developed using a standard diaminobenzidine reaction. Selected sections were counterstained with Cresyl Violet for definition of chomatin condensation.
Immunoblotting
Samples of membrane or soluble proteins were subjected to SDS-PAGE and electro-eluted onto nitrocellulose membranes as described previously (Northington et al., 2001a). The reliability of sample loading and protein transfer was evaluated by staining nitrocellulose membranes with Ponceau S before immunoblotting and by quantification of commassie stained gels with OD. Blots were blocked with 2.5% non-fat dry milk with 0.1%Tween 20 in 50mM Tris-buffered saline (pH7.4) and incubated overnight at 4°C with antibody. After primary incubation, blots were washed, incubated with peroxidase-conjugated secondary antibodies (0.2μg/ml) and developed with enhanced chemiluminescence.
Antibodies
Antibodies were used in the following amounts for immunoblotting: anti-cytochrome C – 0.4ug/ml (Santa Cruz Biotechnology, Santa Cruz, CA, USA), anti-caspase-9-0.2ug/ml (NeoMarkers, Inc. Fremont, CA, USA), anti-APAF-0.4ug/ml (Santa Cruz Biotechnology, Santa Cruz, CA, USA), anti-Cleaved Caspase-3 -0.4ug/ml (Cell Signaling Technology, Beverly, MA, USA), anti-Kinesin-5ug/ml (Chemicon International, Temecula, CA, USA), anti-clusterin-0.4μg/ml (Santa Cruz Biotechnology, Santa Cruz, CA, USA), anti-spectrin-0.2ng/μl (Chemicon International, Temecula, CA, USA).
Caspase 3 and 9 Activity Assay
The protein concentrations were determined and samples of homogenate (25 μl) were mixed with 75 μl of extraction buffer as described earlier (Zhu et al., 2005). Cleavage of Ac-DEVD-AMC (for caspase-3, Peptide Institute, Osaka, Japan), was measured with an excitation wavelength of 380 nm and an emission wavelength of 460 nm, and expressed as pmol AMC released per mg protein and minute. Cleavage of Ac-LEHD-AFC (for caspase-9, Enzyme System Products, Livemore, CA, USA) was measured as for the AMC conjugates, but with an excitation wavelength of 400 nm and an emission wavelength of 505 nm, and expressed as pmol AFC released per mg protein and minute.
Complex IV Activity Assay
1% cytochrome C was mixed in 10mM of potassium phosphate buffer, 20μg of sample protein was added and absorbance at 550nm recorded at 15, 30, 45, and 60 seconds. Change in absorbance over time is directly related to complex IV activity (Martin et al., 2000).
Cytochrome Oxidase Histochemistry
To identify the levels of oxidative metabolism and intracellular distribution of oxidatively active mitochondria, the CO (cytochrome oxidase) histochemical method of Wong-Riley (Wong-Riley, 1989) as described previously for our laboratory was used (Northington et al., 2001a). In this reaction, in situ CO catalyzes the transfer of electrons (donated by diaminobenzidine) from cytochrome C, provided as substrate, to O2 to form H2O. The donation of electrons from diaminobenzidine is a chromogenic reaction yielding the formation of an insoluble precipitate in the vicinity of CO activity thus revealing both the location of the mitochondria and relative metabolic activity of cytochrome oxidase (Wong-Riley, 1989).
Statistical Analysis
Mean and standard deviation for caspase activity measurements, counts of intact mitochondria, and cytochrome c oxidase activity obtained at similar time points were calculated with InStat3 for Macintosh, Graph Pad Software, Inc. (San Diego, CA, USA) and compared with ANOVA with Dunnett’s Multiple Comparison Tests or Kruskal-Wallis Test (non parametric ANOVA) with Dunn’s Multiple Comparisons Test. A p value < 0.05 was used to determine significance. Kruskal-Wallis Test was applied when Bartlett statistic suggested that the differences among the standard deviations were significant.
(iii) Results
Evidence for initiation of apoptosis programs following neonatal HI
Components of the apoptosome are released into the soluble fraction and caspases 9 and 3 are activated following neonatal HI
With immuno-blotting, we find increased levels of both APAF 1 and cytochrome c, along with expression of caspase-9 in the soluble fraction following H/I in the neonatal rat forebrain (Figure 1A). That these proteins form a functional apoptosome is demonstrated by increased biochemical activity of caspases 9 and 3 (Figure 1B, * p≤ 0.05 vs control, ANOVA with Dunnett’s post hoc test) in the same forebrain samples in which components of the apoptosome are detected and by elevation in levels of the p17 cleaved fragment of caspase-3 in these samples by immunoblotting (Figure 1C).
Figure 1. Constituents of the apoptosome Complex accumulate and caspases 9 and 3 are activated following neonatal HI in soluble fraction from injured rat forebrain.

A. Immunoblots showing increased levels of both APAF 1 and cytochrome c and the presence of caspase-9 in soluble protein extracts from ipsilateral injured forebrain following neonatal HI in comparison to uninjured controls. B. Increased biochemical activity of caspases 9 and 3 (* p≤ 0.05 vs control, ANOVA with Dunnett’s post hoc test) after HI. C. The active p17 cleaved fragment of caspase-3 is found with increasing abundance at 6 and 24 hours after HI compared to control. Commassie stained gels or ponceau stained nitrocellulose membranes are shown as loading controls for each of the immunoblots in A and C.
Multiple manifestations of mitochondrial dysfunction following neonatal HI
Loss of structurally intact mitochondria occurs rapidly following neonatal HI
In striatal neurons, structurally normal mitochondria with intact inner cristae and inner and outer membrane and damaged mitochondria with disrupted inner cristae and separation of the inner and outer membrane were evaluated (Figure 2A, scale bar 0.5μm). There is a rapid loss of intact mitochondria in injured neurons in the striatum within 3 hours (34.7±25%; mean ± SD) following HI. Percent intact mitochondria are 21.2±19% and 36.4±21.9% at 6 and 24 hours following HI (Figure 2A, graph, * p<0.05 vs control, ≥ 25 cells examined at each time point). Although, mean number of intact mitochondria are low in neurons within the area comprising the core of the HI injury at 3, 6 and 24 hours, there is variability between individual neurons, with some retaining 40–60% of their mitochondria in a structurally intact state.
Figure 2. Multiple manifestations of mitochondrial dysfunction following neonatal HI.
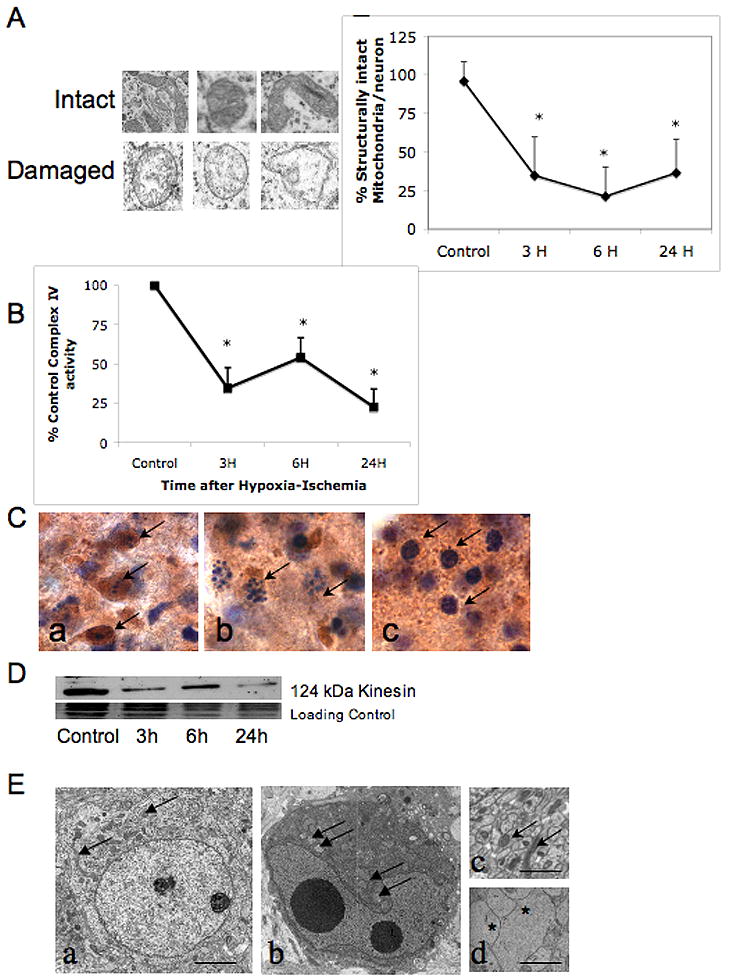
A. Individual mitochondria from striatal neurons were classified as having intact inner cristae and inner and outer membrane or swollen and disrupted inner cristae and separation of the inner and outer membrane as shown. Using these criteria, percent intact mitochondria within individual striatal neurons was calculated in uninjured control neurons and at 3, 6, and 24 hours after HI (graph, mean± SD, n =25 at each time point, * p≤ 0.05 vs control, ANOVA with Dunnett’s post hoc test). B. Mitochondrial complex IV activity rapidly declines within the first 3 hours following neonatal HI (mean ±SD of % control activity, n= 6 samples at each time point, * p≤ 0.05 vs control, ANOVA with Dunnett’s post hoc test). Partial recovery at 6 hours is not sustained and there is more profound secondary decrease at 24 hours. C. Dying striatal neurons with different cell death phenotypes have varying preservation of cytochrome oxidase histochemical activity. Cells with classic apoptotic phenotype maintain intense cytochrome c oxidase activity (Ca, brown immunoreactivity, arrows) compared to cells with incomplete chromatin condensation, consistent with ‘continuum’ phenotype (Cb) and cells with irregularly and minimally condensed chromatin (Cc).
D. Immunoblot showing loss of kinesin protein as soon as 3 hours after HI. This coincides with the loss of structural integrity and functional activity of mitochondria following neonatal HI (panels A and B). E. Healthy neurons from control striatum have intact cytoplasmic and nuclear membranes, well dispersed chromatin with nucleoli visible, intact mitochondria dispersed throughout cytoplasm (Ea, scale bar=2μm). In contrast, in injured neurons, perinuclear clustering of mitochondria occurs within darkened and condensed cytoplasm, possibly from loss of anterograde trafficking of mitochondria (Eb) (mitochondria indicated with arrows in Ea, Eb, and Ec) (Al-Abdulla and Martin, 1998, Northington et al., 2001a). Healthy appearing mitochondria are abundant in cross sections of axons of uninjured neurons (Ec) and almost completely absent in swollen injured axons (Ed, asterisks) at 6 hours following HI (scale bars =1μm).
Mitochondrial cytochrome C oxidase activity rapidly declines in forebrain following neonatal HI
Mitochondrial function, as assessed by activity of complex IV within the respiratory chain, rapidly declines in tissue taken from the ipsilateral forebrain within the first 3 hours to 34.7±12.7% of control following neonatal HI (Figure 2, B, p<0.05 vs control). A partial restitution at 6 hours to 54.1±12.7% of control activity is not sustained and the secondary decrease at 24 hours to 22.7±11.4% of control reflects the secondary energy failure seen in many models of neonatal HI (Peeters-Scholte et al., 2004). Histochemical assessment of cytochrome C oxidase activity was performed on tissue homogenates and not on selected injured neurons; however, the degree of initial decrement in mitochondrial function is remarkably similar to the percentage loss of intact mitochondria (Figure 2A). Variability of cytochrome c oxidase activity occurs between cells with different cell death phenotype (Figure 2C). Cells with classic apoptotic phenotype maintain intense cytochrome c oxidase activity (Figure 2Ca, brown immunoreactivity, arrows). Less cytochrome c oxidase activity is found in cells with incomplete chromatin condensation, consistent with ‘continuum’ phenotype (Figure 2Cb) and essentially no cytochrome C oxidase activity is detected in cells with irregularly and minimally condensed chromatin (Figure 2Cc). Cells with classic apoptotic nuclear condensation and retained cytochrome oxidase activity are seen alongside cells with ‘continuum’ phenotype in figure 2Cb.
Loss of mitochondrial motor protein, kinesin and failure of mitochondrial distribution following neonatal HI
Kinesin, the motor protein responsible for anterograde movement of mitochondria from soma to processes is degraded following neonatal HI in the striatum (Figure 2D). Loss is evident at 3 hours after HI, coinciding with the loss of structural integrity and functional activity of mitochondria following neonatal HI (Figure 2A and B). A normal neuron with intact cytoplasmic and nuclear membranes, dispersed normal chromatin, mitochondria and cytoplasmic organelles is shown (Figure 2Ea, scale bar= 2μm). In comparison, there is perinuclear clustering of mitochondria within darkened and condensed cytoplasm in neurons following injury (Figure 2Eb, mitochondria indicated with arrows). This consistent with a loss of anterograde trafficking of mitochondria (Al-Abdulla and Martin, 1998, Northington et al., 2001a). Healthy appearing mitochondria are abundant in cross sections of axons of uninjured neurons (Figure 2Ec, arrows) and almost completely absent in swollen injured axons (Figure 2Ed, asterisks) at 6 hours following HI (scale bars Eb and Ec=1μm).
Ultrastructure of cell death following neonatal HI shows features intermediate between necrosis and apoptosis
Using criteria developed by Portera-Cailliau et al (Portera-Cailliau et al., 1997a) for the identification of cell death along a continuum from apoptosis to necrosis, there is EM evidence for apoptotic, continuum and necrotic cell death within dying striatal neurons at 3 (Figure 3,A–E), 6 (Figure 3F–J) and 24 hours (Figure 3K–O) after HI (scale bar=2μm for Figure 3A–O). Classically necrotic cells with watery cytoplasm containing disrupted organelles, dispersed and minimal chromatin condensation within an intact nuclear membrane (Figure 3A), and classically apoptotic cells with intact cell membrane, dark and condensed cytoplasm, and highly organized chromatin condensation with complete loss of the nuclear membrane (Figure 3E, J, and O) are infrequently seen. The majority of dying neurons at 3, 6, and 24 hours after HI have structures that are neither classically apoptotic nor necrotic. Some neurons at each time point following HI (Figure 3B, G, and K) have chromatin condensation in a ‘clockface’ pattern within an intact nuclear membrane. In these neurons, the cytoplasm is severely disrupted with only rare intact organelles. This pattern is most often associated with excitotoxic neurodegeneration (Ishimaru et al., 1999) The dying cells in Figure 3C, D, H, I, L and M have intact cell membrane, and more condensed cytoplasm with variably swollen and disrupted mitochondria and vacuolated cytoplasm, chromatin is condensed, but irregularly so, and for the most part the nuclear membrane still separates nuclear and cytoplasmic contents. Most of the dying cells have incompletely condensed chromatin, however, in Figure 3N, the dying neuron has completely condensed chromatin, no remaining nuclear membrane and a rarefied cytoplasm with uniformly swollen, disrupted organelles. A minimal degree of cytoplasmic condensation is evident in the periphery adjacent to an intact cell membrane. The appearance of these cells (Figure 3C, D, H, I, L, M and N) is representative of the majority of dying neurons in the first 24 hours following HI and is consistent with initiation of packaging of nuclear and cytoplasmic contents but an inability to complete the process, likely due to energy failure. These cells represent the continuum of necrotic and apoptotic morphologies. Examples of nuclear membranes are identified with double arrows, irregularly condensed chromatin with single arrows, fully condensed chromatin with asterisks, cell membrane with triple arrows, disrupted mitochondria with m, intact mitochondria with M, vacuoles with v.
Figure 3. Cell death ultrastructure following neonatal HI is intermediate between necrosis and apoptosis.
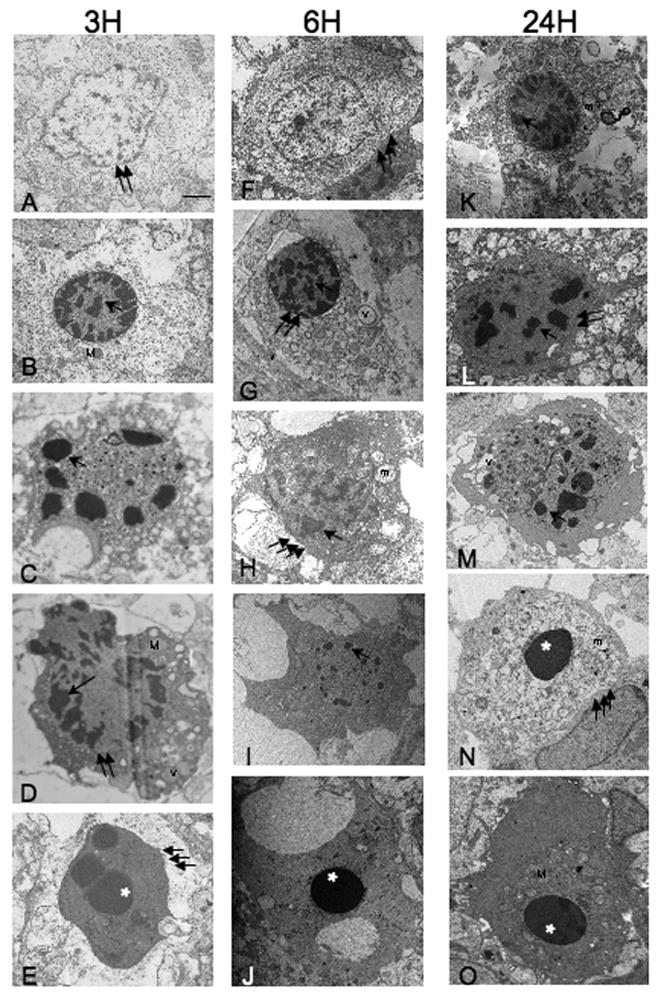
There is EM evidence for apoptotic, continuum and necrotic cell death within dying striatal neurons at 3 (panels A–E), 6 (panels F–J) and 24 hours (panels K–O) after HI. Necrotic cells with translucent cytoplasm, dispersed and minimal chromatin condensation within an intact nuclear membrane (panel A), and classically apoptotic cells with intact cell membrane, dense cytoplasm, and highly organized chromatin condensation with complete loss of the nuclear membrane (panels E, J, O) are seen but are relatively rare. Neurons with structures associated with excitotoxic neurodegeneration (Ishimaru et al., 1999) are seen (panels B, G, and K). The dying cells in panels C, D, H, I, L, M, and N have an appearance consistent with incomplete packaging of nuclear and cytoplasmic contents including more or less condensed cytoplasm within an intact cell membrane, variably swollen and disrupted mitochondria and vacuolated cytoplasm, irregularly condensed chromatin with at least partial segregation of nuclear and cytoplasmic contents. Representative examples of nuclear membranes are identified with double arrows, irregularly condensed chromatin with single arrows, fully condensed chromatin with asterisks, cell membrane with triple arrows, disrupted mitochondria with m, intact mitochondria with M, vacuoles with v, scale bar=2μm for panels A–O.
Biochemical evidence for incomplete execution of apoptotic cell death following neonatal HI
Clusterin or apolipoprotein J is a molecular chaperone highly expressed in brain (Poon et al., 2000). Although, clusterin has been proposed as having a role in the regulation of apoptosis (Wilson and Easterbrook-Smith, 2000), in the neonatal brain clusterin accumulates in neurons dying with an excitotoxic phenotype following neonatal HI and appears to differentiate excitotoxic from caspase-dependent apoptosis (Han et al., 2001). We find robust accumulation of this multimeric 35–40 kDa protein in soluble fractions from ipsilateral forebrain at 24 hours following neonatal HI (Figure 4A). Interestingly, no secretion and accumulation of clusterin within the soluble fraction occurs in the ipsilateral diencephalon (data not shown), where cell death follows a more classic apoptotic pathway (Northington et al., 2001a).
Figure 4. Biochemical evidence for incomplete execution of apoptotic cell death following neonatal HI.
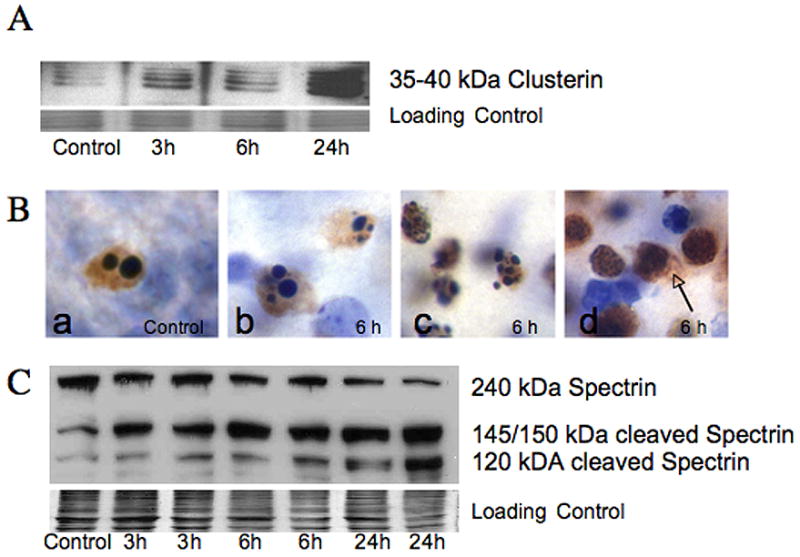
A. Clusterin. a multimeric 35–40 kDa glycoprotein, thought to be a marker for excitotoxic neurodegeneration (Han et al., 2001) is present in the soluble fraction from ipsilateral forebrain as early as 3 hours, and is markedly elevated at 24 hours following neonatal HI simultaneous with increased p17 caspase 3 fragment (Figure 1C). The commassie stained gel is shown as the loading control. B. Histochemical expression of the 17 kDa active fragment of caspase-3 is found in dying striatal neurons following neonatal HI (brown immunoreactivity, cells counter-stained with CV). The 17 kDa isoform of caspase-3 is present in cells dying with a variety of nuclear morphologies. Cells dying from programmed cell death in control tissue (Ba) as well as cells with classic apoptotic morphology in injured striatum (Bb) are immunoreactive for 17 kDa caspase-3 as expected. Other striatal neurons with immunoreactivity for 17 kDa caspase-3 have nuclear morphologies not consistent with classic apoptosis, but rather show incomplete nuclear fragmentation (Bc) and some have minimal evidence of chromatin condensation (Bd). Spillage of p17 caspase 3 into extracellular space is seen in cells with the least evidence of organized chromatin condensation (arrow) presumably due to disruption of cell membrane. C. Immunoblot showing cleavage of 240 kDa full length spectrin, an important cytoskeletal protein, is shown. Expression of the 145/150 kDa spectrin fragment, produced by excitotoxic- calpain mediated fragmentation occurs as early as 3 hours following HI while expression of the 120 kDa caspase-cleaved fragment appears at 3 and 6 hours but in much more abundance at 24 hours after HI. The commassie stained gel is shown as the loading control.
As suggested by caspase-3 activity data presented in figure 1, the 17 kDa active fragment of caspase-3 is expressed in dying striatal neurons at 6 hours and 24 hours following neonatal HI (Figure 4Bb–Bd, brown immunoreactivity-17 kDa caspase-3, cells counter-stained with CV). With immunohistochemistry, it is evident that 17 kDa caspase-3 is expressed in cells dying with a variety of nuclear morphologies. In control tissue (Figure 4Ba), the rare neurons found to be undergoing programmed cell death have an apoptotic morphology and abundant 17 kDa caspase-3 expression. Cell with classic apoptotic morphology (Figure 4Bb) are essentially indistinguishable from cells undergoing programmed cell death and express 17 kDa caspase-3 as expected. However, other striatal neurons with dense immunoreactivity for 17 kDa caspase-3 have nuclear morphologies not consistent with classic apoptosis, showing incomplete nuclear fragmentation (Figure 4Bc) or minimal evidence of chromatin condensation (Figure 4Bd). In the area adjacent to these cells, p17 caspase-3 is found in the extracellular space (Figure 4Bd, brown immunoreactivity, arrow).
Degradation of the neuronal cytoskeleton also occurs along both caspase and non-caspase mediated pathways (Blomgren et al., 2001). The 145/150 kDa spectrin fragment is produced by calpain mediated fragmentation of 240 kDa full length spectrin and is robustly expressed as early as 3 hours following HI while the 120 kDa caspase-cleaved fragment appears at 3 and 6 hours but in much more abundance at 24 hours after HI, with a corresponding decrease in full-length spectrin (Figure 4C).
(iv) Discussion
This study shows for the first time that the predominant cell death form in the forebrain following neonatal HI in the rat is a ‘continuum’ morphology. The evolution of this ‘continuum’ morphology coincides with evidence for mitochondrial bioenergetic and structural failure superimposed upon activated apoptosis pathways after neonatal HI. Bioenergetic failure likely prevents execution of a full apoptotic phenotype. Evidence that apoptosis pathways are activated following neonatal HI coexists with evidence for incomplete execution of these pathways, energy failure, and biochemical evidence for necrosis. Thus, we conclude that mitochondrial failure, within 3 hours after HI, as evidenced by a fall in complex IV activity, disruption of mitochondrial integrity, loss of intact mitochondria combined with loss of kinesin protein responsible for anterograde transport of mitochondria to axons and dendrites may interrupt apoptotic cascades initiated by injury to the immature rat brain and result in the ‘continuum’ phenotype of neuronal cell death.
There is an active controversy regarding the proper classification of cell death following neonatal HI in rodents. Even with strict attention to regional and chronologic detail, a variety of cell death morphologies have been observed within the forebrain after neonatal HI (Northington et al., 2001b, Sheldon et al., 2001). That many of the dying cells in the forebrain following neonatal HI exhibit a necrotic morphology is widely accepted (Towfighi et al., 1995). Excitotoxic neurodegeneration also occurs and defines some neurons undergoing an organized, non-apoptotic cell death following both glutamate injection and hypoxia-ischemia (Ishimaru et al., 1999). However, these classification schemes do not account for the variety of cell death phenotypes seen following neonatal brain injury. Portera-Cailliau and Martin first suggested that neurodegeneration in the newborn striatum in response to excitotoxic injury occurs as a structural continuum of cell death (Portera-Cailliau et al., 1997a). Based on in vitro experiments, Nicotera and colleagues proposed that a form of neuronal necrosis, associated with extreme energy depletion, represents the failure of neurons to successfully complete the default apoptotic cell death program and has a cell death structure intermediate between apoptosis and necrosis (Nicotera and Lipton, 1999). We now show the existence of these intermediate cell death phenotypes in vivo following neonatal HI. The presence of these intermediate cell death phenotypes as the predominant cell death form following neonatal HI explains why biochemical markers of apoptosis are found in abundance in the neonatal brain following HI but evidence for a corresponding high level of apoptotic cell death phenotypes is not found when cell death morphology is examined at the electron microscopic level.
In this study, we find that most dying neurons have characteristics of both necrosis and apoptosis with only rare cells achieving a fully apoptotic phenotype within the first 24 hours following neonatal HI. Features of the ‘continuum’ phenotype include incomplete packaging of nuclear chromatin into spherical or irregular, smaller and more numerous chromatin clumps than seen in classic programmed cell death, varying degrees of nuclear membrane preservation and varying degrees of cytoplasmic condensation and rarefaction with varying preservation of cytoplasmic organelles and intact mitochondria. These findings of incomplete cytoplasmic and nuclear packaging typify the unique structural features of ‘continuum’ cell death described from an excitotoxic insult to the newborn forebrain (Portera-Cailliau et al., 1997a) and are reminiscent of cell death morphologies in human T cells which prompted Nicotera et al to describe classical apoptosis and necrosis as only the extreme ends of a wide range of possible morphological and biochemical deaths (Nicotera et al., 1999a) similar to the earlier description of excitotoxic cell death in vivo (Portera-Cailliau et al., 1997a).
It is not surprising that the newborn brain is primed to respond to various insults with activation of apoptotic cascades because of the importance of programmed cell death in the development of the central nervous system. This importance is shown by the severe brain-overgrowth malformations that occur in some strains of mice with complete absence of caspases 3 and 9 (Kuida et al., 1996, Kuida et al., 1998). Additional evidence that the neonatal brain has more abundant potential for activation of apoptosis pathways than the mature brain is that procaspase-3 is several times more abundant in the developing brain (Zhu et al., 2005) as are the proapoptosis members of the bcl2 family (Shimohama et al., 1998).
Injury models provide biochemical evidence that activation of apoptosis pathways is more pronounced and more important in neonatal HI brain injury. When equal degrees of HI brain injury are compared between neonatal and adult mice, caspase-3 activation, cytochrome c release and nuclear translocation of apoptosis-inducing factor are much more pronounced in immature brains than in juvenile and mature brains (Zhu et al., 2005). This substantial difference in the availability of “apoptotic machinery” makes it much less likely that a ‘continuum’ phenotype is produced following HI in more mature models. To date, the only reports of form of neurodegeneration are in immature models. The biochemical evidence for apoptosis following neonatal HI in this and other studies, centers largely on evidence that intrinsic mitochondrial apoptosis pathways are activated (Zhu et al., 2005, Blomgren and Hagberg, 2006). Release of cytochrome c, formation of the apoptosome, and cleavage of caspase-9 are the immediate upstream events preceding caspase-3 cleavage and the execution phase of apoptosis in in vitro model systems (Zamzami et al., 1996, Li et al., 1997). We find both protein and activity data to show that constituents of a functional apoptosome are released into soluble fraction and that significant increases in activity of both caspases 9 and 3 are present at 24 hours following HI (Figure 1) consistent with early and robust activation of apoptotic pathways. Whether this is functionally active caspase activity is in neurons is uncertain because caspase released from cells can also be functionally active (Hentze et al., 2001). Moreover, cleaved caspase-3 immunoreactivity does not necessarily mean the presence of intact functional subunits, based on recent mass spectroscopy data (Martin et al., 2007). Nevertheless, these biochemical data along with other papers describing activation of caspase and other non-caspase apoptotic mechanisms in neonatal HI (Blomgren et al., 2001, Northington et al., 2001a, Graham et al., 2004, Blomgren and Hagberg, 2006, Zhu et al., 2007) suggest that apoptotic cell death following neonatal HI should be abundant. The obvious question then remains, why is there no evidence for apoptotic cell death following neonatal HI when ultrastructure is examined.
Energy failure following neonatal HI includes a biphasic loss of ATP interrupted by a transient period in which some return toward baseline metabolic state occurs, with the secondary phase of energy failure commencing within the first 24 hours after HI (Peeters-Scholte et al., 2004). The severity of energy failure following HI is reflected in measurements of activity of the terminal complex of the mitochondrial respiratory chain, cytochrome c oxidase or cytochrome aa3 (Peeters-Scholte et al., 2004). We see this biphasic pattern of energy failure in our model, with a fall of cytochrome c oxidase activity below 25% of baseline at 24 hours after HI, well below levels of mitochondrial respiration required to fully support complete execution of a full apoptosis phenotype (Eguchi et al., 1997, Leist et al., 1997, Nicotera et al., 1998). In addition to a standard measure of mitochondrial respiration following HI, we show for the first time, that this metabolic failure is accompanied by significant and severe disruption of mitochondrial ultrastructure. The initial fall in cytochrome c oxidase activity is paralleled by a comparable decrease in percent intact mitochondria. This energy failure is occurring simultaneous with activation of apoptotic pathways. Interestingly, decreases in ATP levels to 30–50% of baseline levels produce intermediate forms of cell death in vitro (Leist et al., 1997). Although, we made no direct measures of ATP in the present work, our cytochrome c oxidase activity and mitochondrial ultrastructural data are entirely consistent with enough ATP depletion to interrupt apoptotic cascades and produce these intermediate forms of cell death in the first 24 hours after HI. One of the specific phases of apoptosis inhibited by lack of ATP is nuclear condensation and DNA fragmentation (Leist et al., 1997). Importantly, it is lack of complete nuclear condensation that is the most obvious finding in our survey of cell death phenotype following neonatal HI and a major determinant of the continuum phenotype.
Loss of the mitochondrial motor protein, kinesin, may also be crucial for cell death following neonatal HI. Kinesin and dynein are responsible for the anterograde and retrograde movement of mitochondria from nuclear soma along the microtubules within the cell to distal sites (Vallee and Bloom, 1991). This allows for efficient energy production at sites of greatest demand, e.g. synapses. In this model, a significant component of cell death consists of dying axons, dendrites and synaptic boutons (Northington et al., 2001b). Additionally, there is abnormal peri-nuclear clustering of highly active mitochondria in dying cells following neonatal HI (present data) and (Northington et al., 2001a). Partial or incomplete recovery of mitochondrial function combined with loss of the anterograde mitochondrial trafficking mechanisms may form a “double edged sword” at least partially responsible for the cell’s ultimate demise.
The most detailed biochemistry of cell death in the forebrain following neonatal HI supports the ‘continuum’ hypothesis and suggests incomplete execution of apoptosis following neonatal HI (Blomgren et al., 2001). Co-expression of the active isoform of caspase-3 along with the excitotoxic- calcium dependent calpain-mediated 145/150kDa spectrin breakdown product within individual neurons early on following neonatal HI provides further evidence that in neurons that have activated classic apoptotic cell death pathways, non-caspase mediated cell destruction mechanisms are simultaneously underway. We find similar results in our model with the early and abundant formation of the 145/150 kDa calpain mediated-spectrin breakdown product along with formation of the 120 kDa caspase-mediated spectrin breakdown product following HI. These observations match immunohistochemical evidence that active caspase-3 expression occurs in cells clearly lacking apoptotic patterns of chromatin condensation, showing that although caspase apoptosis mechanisms are activated, neurons in which this has occurred often fail to complete packaging of their nuclear and cytoplasmic contents as would be necessary to achieve apoptosis. We additionally find increased levels of a marker of excitotoxic neurodegeneration, clusterin (Han et al., 2001), simultaneous with formation and functional activation of caspase proteins in the ipsilateral forebrain following neonatal HI.
Because this study is performed in vivo, it is impossible to conclusively determine whether the cells exhibiting mitochondrial failure are the very same ones exhibiting the “continuum” phenotype, likewise it is not possible to follow a cell through activation of apoptotic pathways, energy failure and conversion to a “continuum” phenotype of neurodegeneration. However, the biochemical data showing early activation of classic apoptosis programs, abundant ultrastructural evidence of incomplete processing and packaging of cytoskeletal and nuclear components, data that active caspase-3 is expressed in dying neurons lacking the full apoptosis phenotype and evidence for early and severe mitochondrial dysfunction in the forebrain following neonatal HI, we propose that the intermediate “continuum” phenotype of neurodegeneration occurring acutely following neonatal HI represents activation and then interruption of an apoptosis signaling pathway and is the most common phenotype of neurodegeneration occurring acutely in the developing striatum following neonatal HI. Arguments against the cell death continuum (Ishimaru et al., 1999) (Fujikawa, 2000) are based on the assumption that morphology and underlying biochemical processes are discrete. While this may be true at extremes of the cell death continuum, absolute discreteness ignores the cellular appearances that are seen in response to acute injury to the newborn brain.
Acknowledgments
The authors are indebted to Mr. Michael Delanoy for his expertise in electron microscopy. His assistance was invaluable in this work. The authors also acknowledge the expert technical assistance of Devin Mack, Ann Sheldon, Ann Price, and George Kuck, III. These studies are funded by NS 45059 (FJN), NIH AG16282 (LJM) and NS 35902 (DMF).
Footnotes
HI-hypoxia-ischemia
Publisher's Disclaimer: This is a PDF file of an unedited manuscript that has been accepted for publication. As a service to our customers we are providing this early version of the manuscript. The manuscript will undergo copyediting, typesetting, and review of the resulting proof before it is published in its final citable form. Please note that during the production process errors may be discovered which could affect the content, and all legal disclaimers that apply to the journal pertain.
References
- Al-Abdulla NA, Martin LJ. Apoptosis of retrogradely degeneration neurons occurs in association with the accumulation of perkaryal mitochondria and oxidative damage to the nucleus. Am J Pathol. 1998;153:447–456. doi: 10.1016/S0002-9440(10)65588-5. [DOI] [PMC free article] [PubMed] [Google Scholar]
- Ankarcrona M, Dypbukt JM, Bonfoco E, Zhivotovsky B, Orrenius S, Lipton SA, Nicotera P. Glutamate-induced neuronal death: a succession of necrosis or apoptosis depending on mitochondrial function. Neuron. 1995;15:961–973. doi: 10.1016/0896-6273(95)90186-8. [DOI] [PubMed] [Google Scholar]
- Blomgren K, Hagberg H. Free radicals, mitochondria, and hypoxia-ischemia in the developing brain. Free Radic Biol Med. 2006;40:388–397. doi: 10.1016/j.freeradbiomed.2005.08.040. [DOI] [PubMed] [Google Scholar]
- Blomgren K, Leist M, Groc L. Pathological apoptosis in the developing brain. Apoptosis. 2007 doi: 10.1007/s10495-007-0754-4. in press. [DOI] [PubMed] [Google Scholar]
- Blomgren K, Zhu C, Wang X, Karlsson JO, Leverin AL, Bahr BA, Mallard C, Hagberg H. Synergistic activation of caspase-3 by m-calpain after neonatal hypoxia- ischemia: a mechanism of “pathological apoptosis”? J Biol Chem. 2001;276:10191–10198. doi: 10.1074/jbc.M007807200. [DOI] [PubMed] [Google Scholar]
- Bonfoco E, Krainc D, Ankarcrona M, Nicotera P, Lipton SA. Apoptosis and necrosis: two distinct events induced, respectively, by mild and intense insults with N-methyl-D-aspartate or nitric oxide/superoxide in cortical cell cultures. Proc Natl Acad Sci U S A. 1995;92:7162–7166. doi: 10.1073/pnas.92.16.7162. [DOI] [PMC free article] [PubMed] [Google Scholar]
- Eguchi Y, Shimizu S, Tsujimoto Y. Intracellular ATP levels determine cell death fate by apoptosis or necrosis. Cancer Res. 1997;57:1835–1840. [PubMed] [Google Scholar]
- Ferriero DM. Neonatal brain injury. N Engl J Med. 2004;351:1985–1995. doi: 10.1056/NEJMra041996. [DOI] [PubMed] [Google Scholar]
- Fujikawa DG. Confusion between neuronal apoptosis and activation of programmed cell death mechanisms in acute necrotic insults. Trends Neurosci. 2000;23:410–411. doi: 10.1016/s0166-2236(00)01601-5. [DOI] [PubMed] [Google Scholar]
- Geddes R, Vannucci RC, Vannucci SJ. Delayed cerebral atrophy following moderate hypoxia-ischemia in the immature rat. Dev Neurosci. 2001;23:180–185. doi: 10.1159/000046140. [DOI] [PubMed] [Google Scholar]
- Graham EM, Sheldon RA, Flock DL, Ferriero DM, Martin LJ, O’Riordan DP, Northington FJ. Neonatal mice lacking functional Fas death receptors are resistant to hypoxic-ischemic brain injury. Neurobiol Dis. 2004;17:89–98. doi: 10.1016/j.nbd.2004.05.007. [DOI] [PubMed] [Google Scholar]
- Han BH, DeMattos RB, Dugan LL, Kim-Han JS, Brendza RP, Fryer JD, Kierson M, Cirrito J, Quick K, Harmony JA, Aronow BJ, Holtzman DM. Clusterin contributes to caspase-3-independent brain injury following neonatal hypoxia-ischemia. Nat Med. 2001;7:338–343. doi: 10.1038/85487. [DOI] [PubMed] [Google Scholar]
- Hentze H, Schwoebel F, Lund S, Keel M, Ertel W, Wendel A, Jaattela M, Leist M. In vivo and in vitro evidence for extracellular caspase activity released from apoptotic cells. Biochem Biophys Res Commun. 2001;283:1111–1117. doi: 10.1006/bbrc.2001.4918. [DOI] [PubMed] [Google Scholar]
- Ishimaru MJ, Ikonomidou C, Tenkova TI, Der TC, Dikranian K, Sesma MA, Olney JW. Distinguishing excitotoxic from apoptotic neurodegeneration in the developing rat brain. J Comp Neurol. 1999;408:461–476. [PubMed] [Google Scholar]
- Kuida K, Haydar TF, Kuan CY, Gu Y, Taya C, Karasuyama H, Su MS, Rakic P, Flavell RA. Reduced apoptosis and cytochrome c-mediated caspase activation in mice lacking caspase 9. Cell. 1998;94:325–337. doi: 10.1016/s0092-8674(00)81476-2. [DOI] [PubMed] [Google Scholar]
- Kuida K, Zheng TS, Na S, Kuan C, Yang D, Karasuyama H, Rakic P, Flavell RA. Decreased apoptosis in the brain and premature lethality in CPP32-deficient mice. Nature. 1996;384:368–372. doi: 10.1038/384368a0. [DOI] [PubMed] [Google Scholar]
- Leist M, Single B, Castoldi AF, Kuhnle S, Nicotera P. Intracellular adenosine triphosphate (ATP) concentration: a switch in the decision between apoptosis and necrosis. J Exp Med. 1997;185:1481–1486. doi: 10.1084/jem.185.8.1481. [DOI] [PMC free article] [PubMed] [Google Scholar]
- Leist M, Single B, Naumann H, Fava E, Simon B, Kuhnle S, Nicotera P. Inhibition of mitochondrial ATP generation by nitric oxide switches apoptosis to necrosis. Exp Cell Res. 1999;249:396–403. doi: 10.1006/excr.1999.4514. [DOI] [PubMed] [Google Scholar]
- Li P, Nijhawan D, Budihardjo I, Srinivasula SM, Ahmad M, Alnemri ES, Wang X. Cytochrome c and dATP-dependent formation of Apaf-1/caspase-9 complex initiates an apoptotic protease cascade. Cell. 1997;91:479–489. doi: 10.1016/s0092-8674(00)80434-1. [DOI] [PubMed] [Google Scholar]
- Martin LJ, Brambrink AM, Price AC, Kaiser A, Agnew DM, Ichord RN, Traystman RJ. Neuronal death in newborn striatum after hypoxia-ischemia is necrosis and evolves with oxidative stress. Neurobiol Dis. 2000;7:169–191. doi: 10.1006/nbdi.2000.0282. [DOI] [PubMed] [Google Scholar]
- Martin LJ, Liu Z, Chen K, Price AC, Pan Y, Swaby JA, Golden WC. Motor neuron degeneration in amyotrophic lateral sclerosis mutant superoxide dismutase-1 transgenic mice: mechanisms of mitochondriopathy and cell death. J Comp Neurol. 2007;500:20–46. doi: 10.1002/cne.21160. [DOI] [PubMed] [Google Scholar]
- Nakajima W, Ishida A, Lange MS, Gabrielson KL, Wilson MA, Martin LJ, Blue ME, Johnston MV. Apoptosis has a prolonged role in the neurodegeneration after hypoxic ischemia in the newborn rat. J Neurosci. 2000;20:7994–8004. doi: 10.1523/JNEUROSCI.20-21-07994.2000. [DOI] [PMC free article] [PubMed] [Google Scholar]
- Nicotera P, Leist M, Ferrando-May E. Intracellular ATP, a switch in the decision between apoptosis and necrosis. Toxicol Lett. 1998;102–103:139–142. doi: 10.1016/s0378-4274(98)00298-7. [DOI] [PubMed] [Google Scholar]
- Nicotera P, Leist M, Ferrando-May E. Apoptosis and necrosis: different execution of the same death. Biochem Soc Symp. 1999a;66:69–73. doi: 10.1042/bss0660069. [DOI] [PubMed] [Google Scholar]
- Nicotera P, Leist M, Manzo L. Neuronal cell death: a demise with different shapes. Trends Pharmacol Sci. 1999b;20:46–51. doi: 10.1016/s0165-6147(99)01304-8. [DOI] [PubMed] [Google Scholar]
- Nicotera P, Lipton SA. Excitotoxins in neuronal apoptosis and necrosis. J Cereb Blood Flow Metab. 1999;19:583–591. doi: 10.1097/00004647-199906000-00001. [DOI] [PubMed] [Google Scholar]
- Northington FJ, Ferriero DM, Flock DL, Martin LJ. Delayed neurodegeneration in neonatal rat thalamus after hypoxia- ischemia is apoptosis. J Neurosci. 2001a;21:1931–1938. doi: 10.1523/JNEUROSCI.21-06-01931.2001. [DOI] [PMC free article] [PubMed] [Google Scholar]
- Northington FJ, Ferriero DM, Graham EM, Traystman RJ, Martin LJ. Early Neurodegeneration after Hypoxia-Ischemia in Neonatal Rat Is Necrosis while Delayed Neuronal Death Is Apoptosis. Neurobiol Dis. 2001b;8:207–219. doi: 10.1006/nbdi.2000.0371. [DOI] [PubMed] [Google Scholar]
- Northington FJ, Koehler RC, Traystman RJ, Martin LJ. Nitric oxide synthase 1 and nitric oxide synthase 3 protein expression is regionally and temporally regulated in fetal brain. Dev Brain Res. 1996;95:1–14. doi: 10.1016/0165-3806(96)00051-x. [DOI] [PubMed] [Google Scholar]
- Peeters-Scholte C, van den Tweel E, Groenendaal F, van Bel F. Redox state of near infrared spectroscopy-measured cytochrome aa(3) correlates with delayed cerebral energy failure following perinatal hypoxia-ischaemia in the newborn pig. Exp Brain Res. 2004;156:20–26. doi: 10.1007/s00221-003-1761-5. [DOI] [PubMed] [Google Scholar]
- Poon S, Easterbrook-Smith SB, Rybchyn MS, Carver JA, Wilson MR. Clusterin is an ATP-independent chaperone with very broad substrate specificity that stabilizes stressed proteins in a folding-competent state. Biochemistry. 2000;39:15953–15960. doi: 10.1021/bi002189x. [DOI] [PubMed] [Google Scholar]
- Portera-Cailliau C, Price DL, Martin LJ. Excitoxic Neuronal Death in the Immature Brain Is an Apoptosis-Necrosis Morphological Continuum. The Journal of Comparitive Neurology. 1997a;378:70–87. [PubMed] [Google Scholar]
- Portera-Cailliau C, Price DL, Martin LJ. Non-NMDA and NMDA Receptor-Mediated Excitoxic Neuronal Deaths in Adult Brain Are Morphologically Distinct: Further Evidence for an Apoptosis-Necrosis Continuum. The Journal of Comparitive Neurology. 1997b;378:88–104. [PubMed] [Google Scholar]
- Rice JE, Vannucci RC, Brierley JB. The influence of immaturity on hypoxic-ischemic brain damage in the rat. Ann Neurol. 1981;9:131–141. doi: 10.1002/ana.410090206. [DOI] [PubMed] [Google Scholar]
- Sheldon RA, Hall JJ, Noble LJ, Ferriero DM. Delayed cell death in neonatal mouse hippocampus from hypoxia-ischemia is neither apoptotic nor necrotic. Neurosci Lett. 2001;304:165–168. doi: 10.1016/s0304-3940(01)01788-8. [DOI] [PubMed] [Google Scholar]
- Shimohama S, Fujimoto S, Sumida Y, Tanino H. Differential expression of rat brain bcl-2 family proteins in development and aging. Biochem Biophys Res Commun. 1998;252:92–96. doi: 10.1006/bbrc.1998.9577. [DOI] [PubMed] [Google Scholar]
- Towfighi J, Zec N, Yager J, Housman C, Vannucci RC. Temporal evolution of neuropathologic changes in an immature rat model of cerebral hypoxia: a light microscopic study. Acta Neuropathol. 1995;90:375–386. doi: 10.1007/BF00315011. [DOI] [PubMed] [Google Scholar]
- Vallee RB, Bloom GS. Mechanisms of fast and slow axonal transport. Annu Rev Neurosci. 1991;14:59–92. doi: 10.1146/annurev.ne.14.030191.000423. [DOI] [PubMed] [Google Scholar]
- Wilson MR, Easterbrook-Smith SB. Clusterin is a secreted mammalian chaperone. Trends Biochem Sci. 2000;25:95–98. doi: 10.1016/s0968-0004(99)01534-0. [DOI] [PubMed] [Google Scholar]
- Wong-Riley MT. Cytochrome oxidase: an endogenous metabolic marker for neuronal activity. Trends Neurosci. 1989;12:94–101. doi: 10.1016/0166-2236(89)90165-3. [DOI] [PubMed] [Google Scholar]
- Zamzami N, Susin SA, Marchetti P, Hirsch T, Gomez-Monterrey I, Castedo M, Kroemer G. Mitochondrial control of nuclear apoptosis. J Exp Med. 1996;183:1533–1544. doi: 10.1084/jem.183.4.1533. see comments. [DOI] [PMC free article] [PubMed] [Google Scholar]
- Zhu C, Wang X, Huang Z, Qiu L, Xu F, Vahsen N, Nilsson M, Eriksson PS, Hagberg H, Culmsee C, Plesnila N, Kroemer G, Blomgren K. Apoptosis-inducing factor is a major contributor to neuronal loss induced by neonatal cerebral hypoxia-ischemia. Cell Death Differ. 2007;14:775–784. doi: 10.1038/sj.cdd.4402053. [DOI] [PubMed] [Google Scholar]
- Zhu C, Wang X, Xu F, Bahr BA, Shibata M, Uchiyama Y, Hagberg H, Blomgren K. The influence of age on apoptotic and other mechanisms of cell death after cerebral hypoxia-ischemia. Cell Death Differ. 2005;12:162–176. doi: 10.1038/sj.cdd.4401545. [DOI] [PubMed] [Google Scholar]