Abstract
Although the continued periosteal apposition that accompanies age-related bone loss is a biomechanically critical target for prophylactic treatment of bone fragility, the magnitude of periosteal expansion required to maintain strength during aging has not been established. A new model for predicting periosteal apposition rate for men and women was developed to better understand the complex, nonlinear interactions that exist among bone morphology, tissue-modulus, and aging. Periosteal apposition rate varied up to 8-fold across bone sizes, and this depended on the relationship between cortical area and total area, which varies with external size and among anatomical sites. Increasing tissue-modulus degradation rate from 0 to −4%/decade resulted in 65–145% increases in periosteal apposition rate beyond that expected for bone loss alone. Periosteal apposition rate had to increase as much as 350% over time to maintain stiffness for slender diaphyses, whereas robust bones required less than a 32% increase over time. Small changes in the amount of bone accrued during growth (i.e., adult cortical area) affected periosteal apposition rate of slender bones to a much greater extent compared to robust bones. This outcome suggested that impaired bone growth places a heavy burden on the biological activity required to maintain stiffness with aging. Finally, sex-specific differences in periosteal apposition were attributable in part to differences in bone size between the two populations. The results indicated that a substantial proportion of the variation in periosteal expansion required to maintain bone strength during aging can be attributed to the natural variation in adult bone width. Efforts to identify factors contributing to variation in periosteal expansion will benefit from developing a better understanding of how to adjust clinical data to differentiate the biological responses attributable to size-effects from other genetic and environmental factors.
INTRODUCTION
Although osteoporotic fracture risk is often attributed to excessive bone loss, changes in bone strength and fracture resistance during aging also depend on the amount of periosteal apposition (1–4). This biomechanically beneficial restructuring, which has been observed for a diverse range of weight bearing (2,5–19) and non-weight bearing bones (6,20–29), has been reported in cross-sectional studies (2) and has been confirmed in longitudinal studies (9,19,28,29) and by histological analyses (3,15). Although the biological basis of continued periosteal apposition is not fully understood (25,30), it is generally assumed to represent an adaptive response to maintain whole bone strength during aging while bone is resorbed within the sub-endocortical envelope (5,29,31). Because reduced periosteal apposition may increase fracture risk (19,29), developing a better understanding of the factors contributing to the inter-individual variation in this biological process (9,28,32,33) will benefit efforts to reduce fracture incidence.
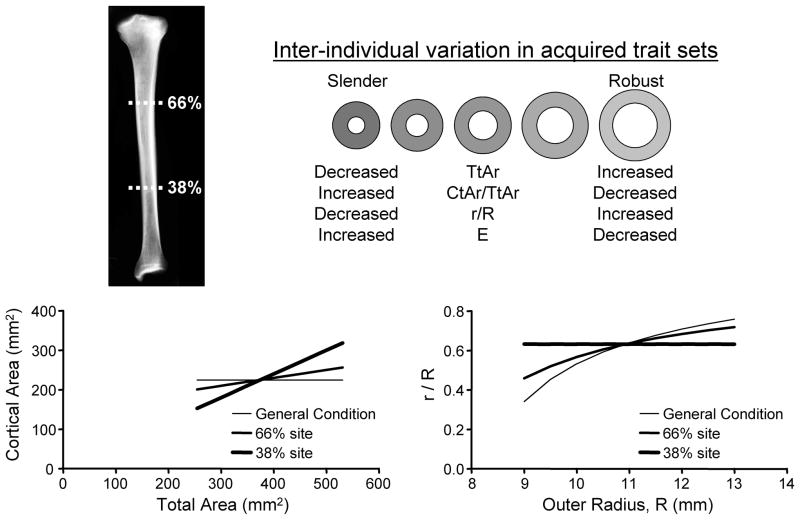
Although the periosteum is a biomechanically important target for prophylactic treatment, the amount of periosteal apposition required to maintain strength and reduce fracture risk has not been defined. The amount of continued periosteal apposition varies with bone site (9), age (28,29), and sex (5,10,16,33–36). Although many factors contributing to variation in periosteal apposition have been identified (9,27,28,37–44), a critical but largely neglected factor is bone width (45). Because bone morphology and strength are nonlinearly related, mathematical models are needed to predict how bone width should change over time to maintain stiffness and strength (45). Lazenby examined a variety of right cylinders with randomly varying outer and inner dimensions and showed that the amount of periosteal apposition was highly dependent on the ratio of the inner to outer radii (i.e., r/R). Although an important interaction between periosteal apposition and adult bone morphology was revealed, the idealized structures were not examined in a systematic way that reflected the inter-individual variation in acquired trait sets exhibited by human long bones (46,47). Thus, the amount of variation in periosteal apposition that can be attributed to the natural variation in bone size remains unknown. Because the ratio, r/R, was an important factor in Lazenby’s model and varies relative to external bone size (Figure 1), we hypothesized that the pattern of trait sets acquired by individuals will result in a strong correlation between the natural variation in external bone size and the magnitude of periosteal apposition required to maintain strength with aging. Understanding this size-effect is important, because if it is large, clinical data may need to be adjusted for bone size to identify genetic and environmental factors that affect the skeletal-system’s ability to maintain strength with aging.
Figure 1.
The natural variation in external bone size is accompanied with compensatory changes in relative cortical area (cortical area/total area) and tissue-modulus (E). The relationship between cortical area and total area varies with anatomical site. In the human tibia, there is greater disparity in cortical area among individuals expressing the full range in bone sizes at the 38% anatomical site compared to the 66% site. This disparity affects the relationship between r/R and R, where r = inner radius and R = outer radius of an idealized circular cross-section.
The goal of this study was to assess the relationship between periosteal apposition rate and the natural variation in adult bone width. We developed a new model predicting periosteal apposition rate that is based on adult bone morphology and tissue-modulus, endocortical bone loss, and the tissue-modulus degradation rate. The model incorporated the functional interactions among skeletal traits associated with the natural variation in bone width. In prior work, we reported that the relationship between cortical area and total (subperiosteal) area varied along the length of the tibiae (47). Because relative cortical area defines the ratio, r/R (Figure 1), this natural morphological variant was expected to differentially affect the magnitude of periosteal apposition required to maintain stiffness during aging. The impact of this site-specific morphological variation on periosteal apposition rate is unknown but important to assess to determine if the results of clinical studies taking measurements at different anatomical sites can be easily compared. To validate the model, we compared the outcomes of existing clinical studies with the emergent outcome predicted by our model regarding the structural changes expressed by male and female populations exhibiting the natural variation in bone width.
METHODS
Mathematical model for periosteal apposition rate
One goal for reducing fracture risk is to maintain bone stiffness and strength despite a net loss in bone mass. Whole bone bending stiffness is proportional to the product, EI. Unlike the prior model (45), we included tissue-modulus (E) in addition to moment of inertia (I), because the pattern of trait sets acquired by individuals include interactions between morphology and tissue-modulus (18,46) and because tissue-modulus decreases with age (48). Tissue-modulus degradation would have to be compensated by increases in periosteal apposition beyond that expected for endocortical bone loss alone. The magnitude of this effect is unknown. Diaphyseal structures were modeled as right circular cylinders (45). For a diaphysis with a circular cross-section (R = sub-periosteal width/2, r = endocortical width/2) and assuming a circumferentially uniform apposition and resorption, the periosteal apposition rate (dR/dt), which is a measure of the amount of work performed by osteoblasts per unit time at a single site on the periosteum, can be written as a function of endocortical resorption rate (dr/dt), tissue-modulus degradation rate (dE/dt), and adult bone morphology (r, R) and tissue-modulus (E). If bone stiffness, EI, remains constant or changes over time (i.e., dEI/dt = Ψ), then
| (1) |
where, I = π(R4 − r4)/4
| (2) |
Solving for the periosteal apposition rate (dR/dt) gives,
| (3) |
| (4) |
Equation (4) indicates that periosteal apposition rate (dR/dt) is linearly related to the rate of endocortical resorption or marrow expansion (dr/dt), the rate of change in whole bone stiffness (dEI/dt = Ψ), and tissue-modulus degradation rate (dE/dt). Importantly, dR/dt is inversely related to adult tissue-modulus and highly nonlinearly related to adult bone morphology (1/R3, (r/R)3).
Modeling human long bone
The periosteal apposition rate required to maintain a constant whole bone stiffness over time (dEI/dt = 0) was calculated for diaphyses that varied in external size similar to that reported previously for human tibiae (46,47,49–51). The morphological data were based on 696 pQCT images obtained at the 38 and 66% sites for the tibiae of young adult (19–21 year old) men and women (47). Although any long bone could be modeled, tibiae were used because available information on morphology for young adults (47) and age-related changes in morphology (16,19,49) allowed us to compare the outcome of the model with clinical data. The analysis incorporated the coordinated changes in morphology and tissue-modulus that accompany the natural variation in robustness (Figure 1). The first (general) condition assumed that cortical area varied independently of external size and thus was constant across a population (Ct.ArS (slender) = Ct.ArR (robust)). The second and third conditions were designed to study how known site-specific differences in the relationship between cortical area and total (sub-periosteal) area (47) affected periosteal apposition. For the second condition (66% site), cortical area varied modestly relative to robustness, such that slender diaphyses had a slightly lower cortical area compared to robust diaphyses (Ct.ArS < Ct.ArR). For this condition, cortical area was calculated as Ct.Ar = 150 + 0.20 Tt.Ar (units = mm2). For the third condition (38% site), cortical area was significantly lower for slender diaphyses compared to robust diaphyses (Ct.ArS ≪ Ct.ArR) and was calculated as Ct.Ar = 0.60 Tt.Ar (units = mm2). These linear regressions were based on previously published data (47). The relationship between bone size and tissue-modulus was modeled by linearly varying tissue-modulus relative to total area, such that E = 13 GPa for slender diaphyses and E = 19 GPa for robust diaphyses, consistent with prior work (47).
The resorption condition was standardized so the total amount of work done by osteoclasts was the same for all conditions. Bone loss occurs by intra-cortical remodeling within the sub-endocortical region, and this loss results in a progressive radial movement of the effective load-bearing surface. This can be modeled as an increase in endocortical radius over time (dr/dt). Resorption was assumed to progress uniformly around the cortex and linearly with respect to time (i.e., dr/dt = constant). Endocortical resorption rate (dr/dt) was adjusted for each structure to match the magnitude of bone loss for the intermediate size (11 mm) diaphysis, which was assumed to lose 25% of the original cortical area between 45 and 90 years of age. For the two morphological conditions with variable adult cortical area, standardizing the magnitude of bone loss to the intermediate size diaphysis meant that slender diaphyses lost a proportionally greater amount of bone compared to robust diaphyses.
Dependence of periosteal apposition rate on bone size, age, and tissue-modulus degradation
To assess how periosteal apposition rate varied with bone size, age, and tissue-modulus degradation, we calculated the periosteal apposition rate required to maintain whole bone stiffness from 45 to 90 years of age for diaphyses ranging from 9 – 13 mm in radius. The corresponding changes in morphology (Tt.Ar, Ma.Ar, Ct.Ar, J, R, r) were entered into a spreadsheet at half-year intervals. Osteoblastic activity on the periosteal surface is expected to increase over time as continued resorption moves the load-bearing endocortical surface further away from the geometric centroid of the diaphysis. To assess how periosteal apposition rate must change over time to maintain whole bone stiffness and to test whether this relationship varied with adult bone size, periosteal apposition rate was plotted as a function of age for all morphological and resorption conditions. To assess the impact of tissue-modulus degradation on periosteal apposition rate, we examined three tissue-modulus degradation rates (dE/dt = 0, −2, −4%/decade) which span previously reported values (48). The age-related changes in tissue-modulus could result from a large number of parameters, including changes in matrix mineralization, collagen cross-linking, and intra-cortical porosity. The impact of age-related changes in intra-cortical remodeling on periosteal apposition was not modeled explicitly here, but future studies could include this parameter in the model.
Dependence of net bone loss on adult bone size, age, and tissue-modulus degradation
Assessing how cortical area changes over time is clinically relevant as this trait may affect how bone mineral density changes with aging. Cortical area refers to the area enclosed by the periosteal surface and the endocortical surface. The cortical area was not corrected for intracortical porosity. To determine how the size-dependent variation in periosteal apposition rate affected the net amount of bone loss, cortical area was plotted as a function of age for three diaphyses (9, 11, 13 mm) and three tissue-modulus degradation rates (0, −2%, −4%/decade). The cortical area at any given time was calculated as the original cortical area plus the new bone added to the periosteum minus the bone resorbed from the endocortical surface.
Impact of adult cortical area on periosteal apposition rate
Variation in the amount of bone (Ct.Ar) acquired by adulthood, which is superimposed on the natural variation in robustness (47), is important because it affects the ratio, r/R, for any given robustness value. To determine how variation in the amount of bone accrued during growth affects the amount of periosteal apposition required to maintain stiffness during aging, we increased and decreased the adult cortical area defined previously by 10%, calculated the periosteal apposition rate required to maintain stiffness for the −10%, 0, and +10% cortical area conditions, and plotted the periosteal apposition rate as a function of age for varying bone sizes.
Emergent expression of variable periosteal apposition rates at the population-level
The magnitude of age-related changes in total area arising from periosteal apposition is expected to vary with adult bone morphology and the magnitudes of tissue-modulus degradation and endocortical bone loss. Consequently, each individual will exhibit unique “aging-paths” as represented by individualized changes in morphology over time. The culmination of these individual aging-paths will define the emergent expression of age-related changes in morphology that are observed at the population-level through cross-sectional study designs. It is important to study this emergent outcome, because our understanding of the biology of aging is based largely on these cross-sectional studies, and because it is unclear whether structural changes captured by the population mean predict structural changes for all individuals.
We simulated age-related changes in bone morphology for a population of 2,500 men and 2,500 women with the same (sex-specific) height, weight, and bone lengths, but variable bone widths. Bone width was assigned randomly for each individual, such that the outer radii exhibited a normal distribution for men (11.5 +/− 0.5 mm) and women (10.25 +/− 0.5 mm). The ranges in radii were selected so Tt.Ar, Ma.Ar, and Ct.Ar were similar to those reported for the tibia (47). Tissue-modulus (E) varied linearly relative to external size, consistent with prior work (47). For adult cortical area, each person was assigned a cortical area value at 45 years of age to be Ct.Ar = 0.75 Tt.Ar for men and women at the 66% site, and Ct.Ar = 150 + 0.25 Tt.Ar for women and Ct.Ar = 180 + 0.25 Ct.Ar for men at the 38% site. These equations reflect how cortical area varies naturally relative to robustness (47). Variability in the amount of bone accrued during growth was introduced by multiplying the cortical area at 45 years of age by an “Adult health index” (random number between 0.95 and 1.05). We assumed that an individual’s health at adulthood was independent of their health during aging. Variability in the aging process was introduced by multiplying both the tissue-modulus degradation rate and the magnitude of endocortical resorption by an “Aging health index” (normal distribution; mean = 0, standard deviation = 1). This resulted in each person being assigned a random tissue-modulus degradation rate from a normal distribution (−2.0 +/− 0.68%/decade) and a proportionally high or low resorption rate producing a 25 +/− 5% loss in the original cortical area between 45 and 90 years of age. The same resorption and tissue-modulus degradation conditions were applied to men and women so we could study differences in the emergent expression of age-related morphological changes for each population when the difference between sexes was the natural variation in adult bone morphology.
Each person was virtually aged from 45 to 90 years of age, and the periosteal apposition rate required to maintain a constant stiffness over time was calculated at yearly increments. A cross-sectional study design was simulated by randomly picking an age for each individual and entering all morphological traits calculated at this age into a spreadsheet. This was done for the entire population. Total cross-sectional area and cortical area were plotted as a function of age to study the emergent behavior of these traits arising from individualized aging-paths. Sex-specific differences in how each trait changed over time were determined by ANCOVA.
RESULTS
Periosteal apposition rate depends on adult bone size and time
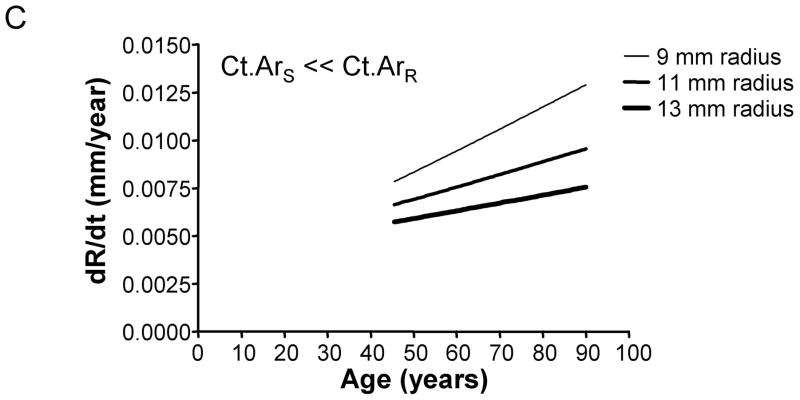
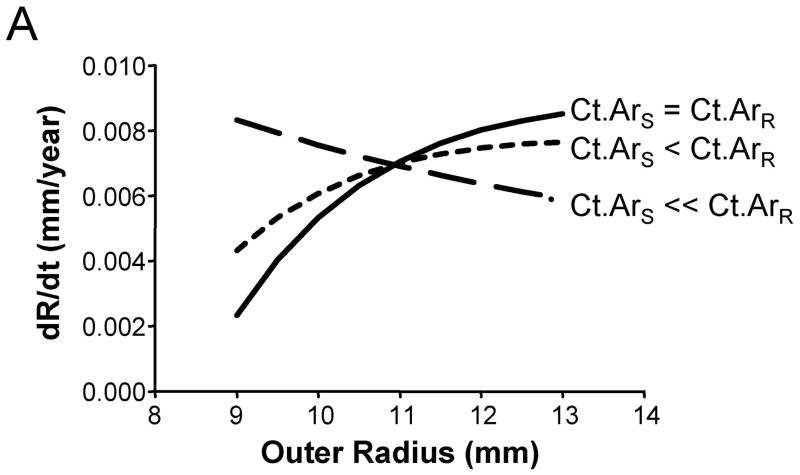
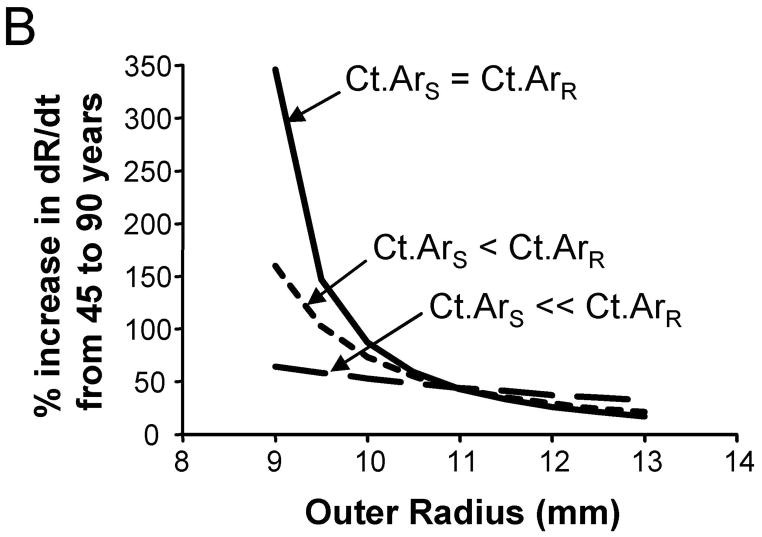
We assessed how the periosteal apposition rate required to maintain bone stiffness over time varied with bone width. A comparison of Figures 2A–C showed that periosteal apposition rate varied with bone size as well as the relationship between cortical area and total area. For the general condition (Ct.ArS = Ct.ArR) and the 66% site (Ct.ArS < Ct.ArR), robust diaphyses required greater periosteal apposition rates to maintain stiffness compared to slender diaphyses. In contrast, periosteal apposition rate for the 38% site (Ct.ArS ≪ Ct.ArR) was greater (29% at age 50) for slender diaphyses compared to robust diaphyses. To assess the magnitude of this size-effect, periosteal apposition rate calculated at age 50 (arbitrary age) was plotted against outer radii for the three morphological conditions (Figure 3A). The size-effect was substantial and was greater when there was less disparity in relative cortical area (i.e., when Ct.ArS ~ Ct.ArR). For example, periosteal apposition rate was 266% and 77% greater for robust diaphyses compared to slender diaphyses for the General condition and the 66% site, respectively. One commonality among the three morphological conditions was that slender diaphyses required greater increases in periosteal apposition rate over time to maintain stiffness compared to robust diaphyses. The increase in periosteal apposition rate from 45 to 90 years of age ranged from 64–346% for slender diaphyses, but only 17–32% for robust diaphyses (Figure 3B).
Figure 2.
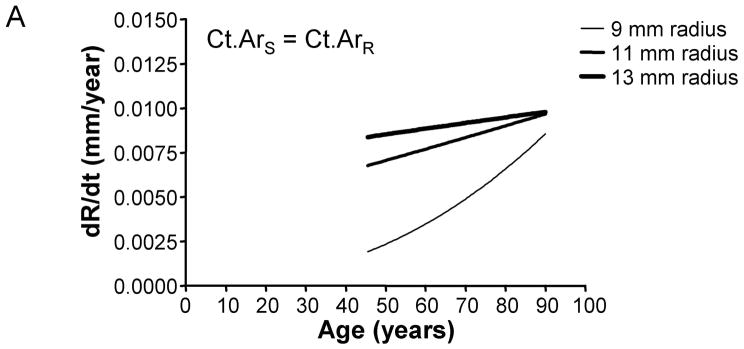
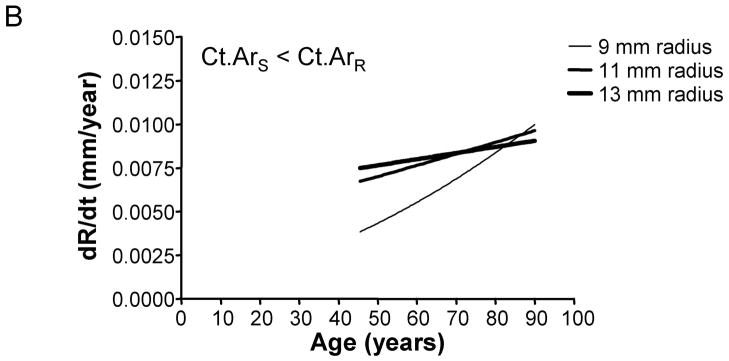
The periosteal apposition rate (dR/dt) required to maintain bone stiffness varies with respect to robustness and age. Further, periosteal apposition rate is highly dependent on variation in the relationship between cortical area and total area, as shown for the A) General condition, B) 66% site, and C) 38% site.
Figure 3.
The degree to which periosteal apposition rate varies relative to robustness, anatomical site, and age was quantified from Figure 2 for the General Condition (Ct.ArS = Ct.ArR), the 66% site (Ct.ArS < Ct.ArR), and the 38% site (Ct.ArS ≪ Ct.ArR). A) Periosteal apposition rate quantified at an arbitrary early age (50 years) is greater for robust bones when there is less disparity in cortical area among individuals (Ct.ArS = Ct.ArR, Ct.ArS < Ct.ArR). This relationship reverses at the 38% anatomical site when the cortical area of slender bones is much less than the cortical area of robust bones (Ct.ArS ≪ Ct.ArR). B) Slender diaphyses required greater percent increases in periosteal apposition rate from 45 to 90 years of age compared to robust diaphyses.
Periosteal apposition rate depends on tissue-modulus degradation rate
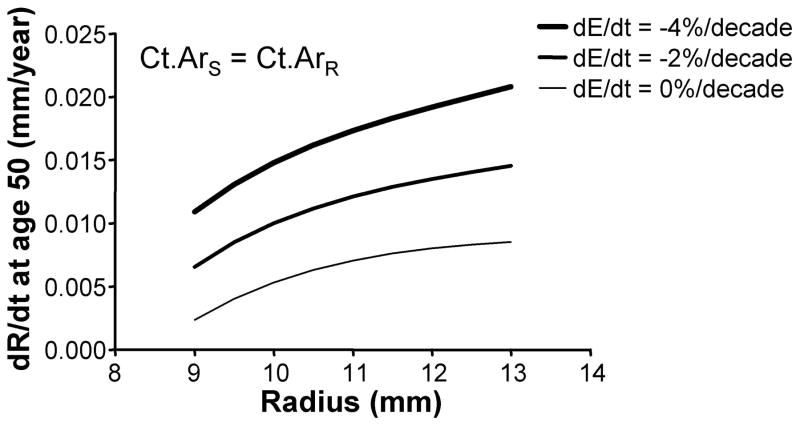
To determine how tissue-modulus degradation rate affected periosteal apposition, we plotted the periosteal apposition rate calculated at age 50 against outer radii for three tissue-modulus degradation rates (Figure 4). The linear relationship between periosteal apposition rate and tissue-modulus degradation rate (Equation 4) resulted in a 0.004–0.006 mm/year upward shift in dR/dt with increasing tissue-modulus degradation rate. The magnitude of this effect was consistent across the three morphological conditions. For the intermediate size (11 mm) diaphysis, for example, increasing degradation from 0 to −2%/decade and from 0 to −4%/decade resulted in 65–72% and 132–145% increases in periosteal apposition rate, respectively.
Figure 4.
The effect of tissue-modulus degradation on periosteal apposition rate is shown for the General Condition (Ct.ArS = Ct.ArR). Greater tissue-modulus degradation over time resulted in an upward shift in the curves. This effect was consistent for the 66% and 38% sites.
Age-related changes in cortical area depend on bone size and tissue-modulus degradation
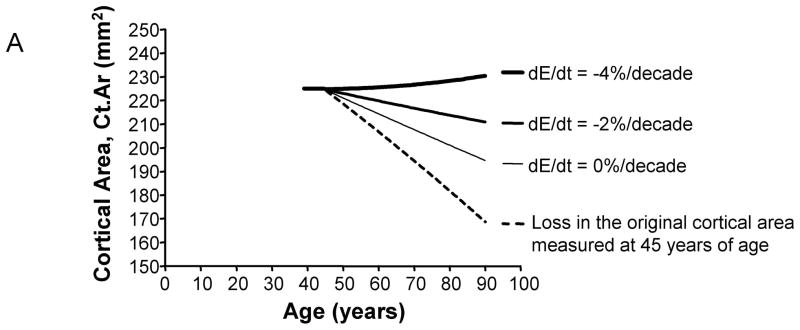
The age-related change in cortical area, which considers both the amount of bone added to the periosteum and the amount of bone resorbed from the endocortical surface, varied widely with bone size and the magnitude of tissue-modulus degradation. The magnitude of this effect can be visualized for the intermediate-size (11 mm) diaphysis (General condition), which exhibited widely varying Ct.Ar-Age regressions for the 0%, −2%, and −4%/decade tissue-modulus degradation conditions (Figure 5A). The change in cortical area between 45 and 90 years of age was quantified and plotted as a function of adult bone size (Figure 5B). For most tissue-modulus degradation conditions, cortical area decreased over time, which is expected because small additions of bone to the periosteal surface mechanically offset large losses of bone from the endocortical envelope. However, cortical area increased over time for diaphyses experiencing a −4%/decade degradation in tissue-modulus, indicating that to maintain stiffness the amount of bone added to the periosteal surface was greater than the amount of bone resorbed from the endocortical surface. Importantly, slender diaphyses showed 2–5 fold greater age-related losses in cortical area compared to robust diaphyses, despite the fact that all diaphyses maintained stiffness over time. This effect was consistent for all three morphological conditions relating cortical area to total area.
Figure 5.
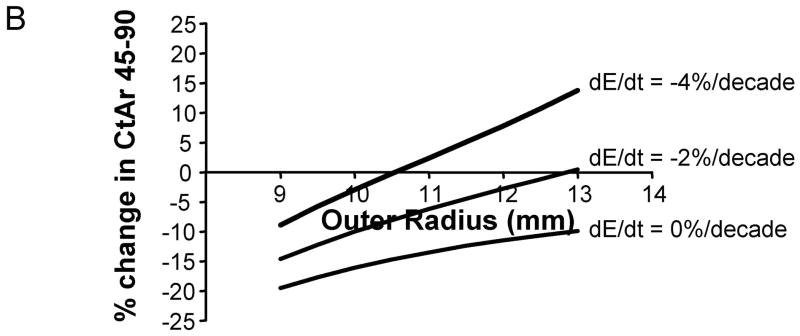
A) Age-related changes in cortical area are shown here for a representative morphological condition (radius = 11 mm). The net changes in cortical area over time vary widely, depending on the magnitude of tissue-modulus degradation rate. Age-changes in the original cortical area (dashed line) are shown for comparison. In this simulation, all bones lost the same amount of bone over time. Consequently, differences in how cortical area changed over time for the 0%, −2%, and −4%/decade tissue-modulus degradation rates could be attributed to the amount of bone added to the periosteal surface to compensate for the endocortical loss. B) The percentage change in cortical area from 45 to 90 years varied with bone size and tissue-modulus degradation rate. These curves are shown for the general condition (Ct.ArS = Ct.ArR). Similar effects were observed for the 66% (Ct.ArS < Ct.ArR) and 38% (Ct.ArS ≪ Ct.ArR) sites.
Variation in adult cortical area affects slender structures more than robust structures
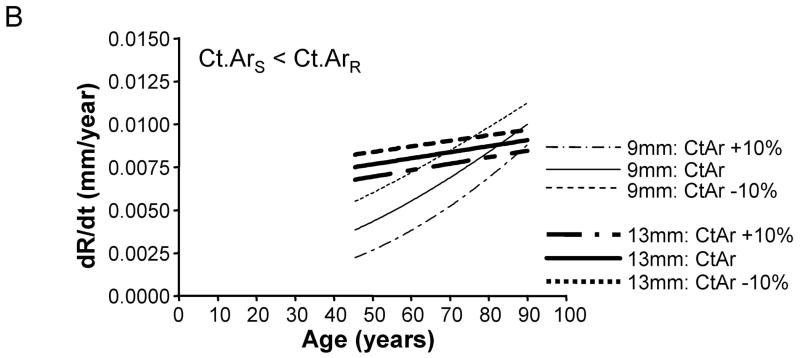
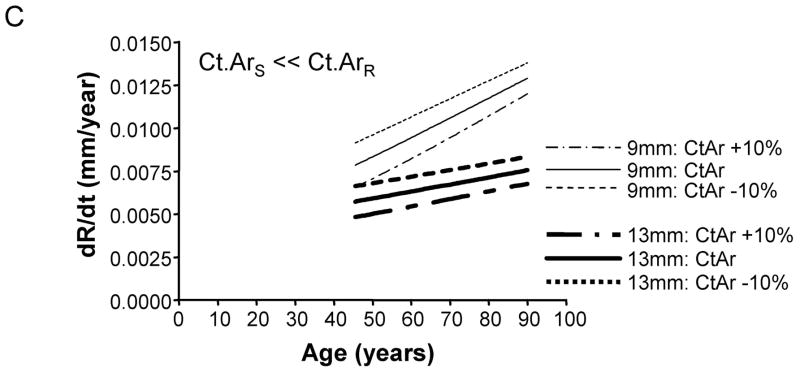
To test whether the amount of bone accrued during growth affects periosteal expansion during aging, we calculated the periosteal apposition rate required to maintain stiffness when adult cortical area was modulated by +/−10%. A plot of periosteal apposition rate as a function of age showed that varying adult cortical area affected periosteal apposition rate to a greater extent for slender diaphyses compared to robust diaphyses (Figure 6). The magnitude of the size-effect was more severe when there was less disparity in the relationship between cortical area and total area across the population. For the General condition (Ct.ArS = Ct.ArR), a 10% increase in adult Ct.Ar resulted in a 77% decrease in periosteal apposition rate for slender diaphyses, but only a 7% decrease for robust diaphyses. Likewise, a 10% decrease in adult cortical area resulted in an 80% increase in periosteal apposition rate for slender diaphyses, but only a 7% increase for robust diaphyses. In contrast, for the 38% site (Ct.ArS ≪ Ct.ArR), a 10% increase in adult cortical area resulted in only a 15% decrease in periosteal apposition rate for both slender and robust diaphyses. A 10% decrease in adult cortical area resulted in only a 15% increase in periosteal apposition rate for slender and robust diaphyses. Thus, small variations in the amount of bone acquired by adulthood affected the periosteal apposition rate required to maintain stiffness during aging, particularly for slender diaphyses.
Figure 6.
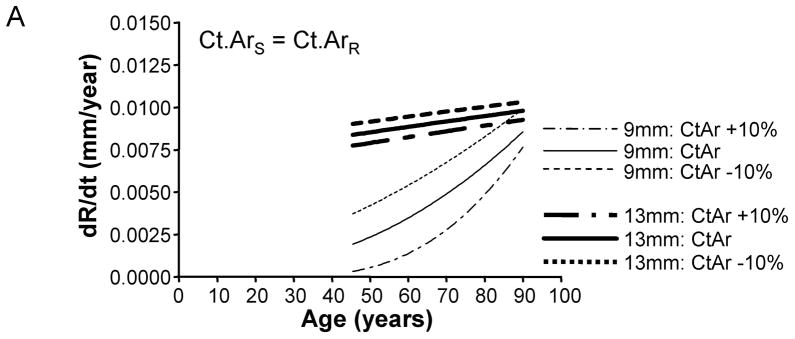
Varying adult cortical area by +/−10% affected periosteal apposition rate more for slender diaphyses compared to robust diaphyses. This effect is shown for the A) General condition, B) 66% anatomical site, and the C) 38% anatomical site. Only the results for the most slender (9mm) and most robust (13mm) diaphyses are shown for clarity.
Emergent behavior of individualized aging-paths
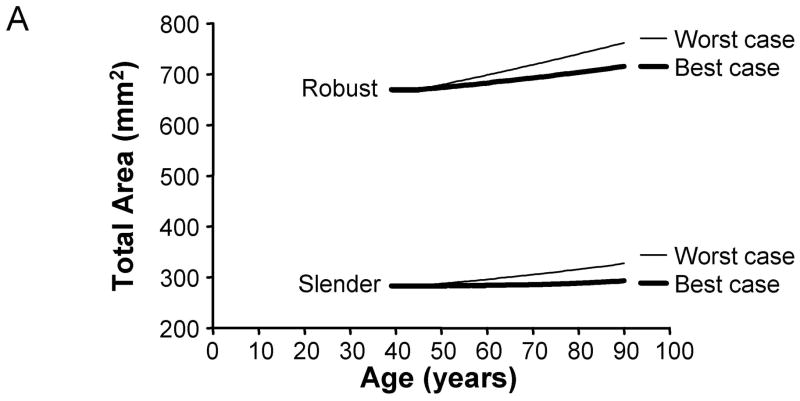
To determine how the culmination of individual aging-paths affected the age-related changes in skeletal traits when viewed across a population, we calculated the periosteal apposition rates required to maintain bone stiffness over time for 2,500 men and 2,500 women. First, total area and cortical area were plotted as a function of age for the best (10% increased adult cortical area and 0%/decade tissue-modulus degradation rate) and worst (10% reduced adult cortical area and −4%/decade tissue-modulus degradation rate) case scenarios to reveal the range in aging-paths expected for this population. The periosteal apposition rate required to maintain stiffness resulted in a 3.8 – 6.8% increase in total area from 45 to 90 years of age for the best case scenario, but a 13.5 – 15.6% increase for the worst case scenario (Figure 7). For cortical area, the lower periosteal apposition for the best case scenario resulted in 12.4 – 21.4% decreases in cortical area between 45 and 90 years of age. However, the higher periosteal apposition for the worst case scenario resulted in small decreases (1–2%) in cortical area between 45 and 90 years of age for most sizes, and a 4.6–5.4% increase for the robust bone. Thus, poor accrual of bone mass during growth and increased tissue-modulus degradation significantly affected the biological activity required to maintain bone stiffness during aging.
Figure 7.
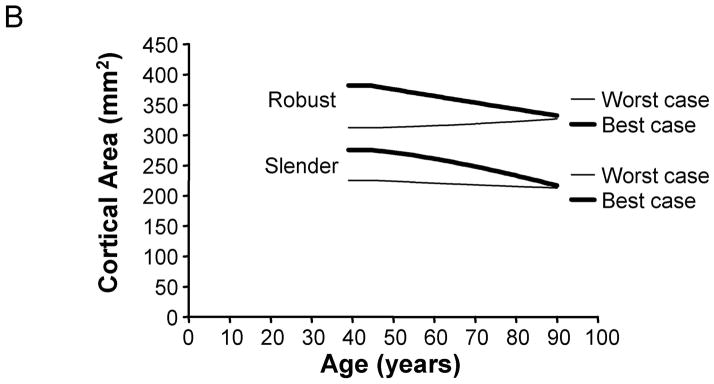
Variation in aging-paths as represented by changes in A) total area and B) cortical area over time. Graphs are shown for the 66% site for women, and the results are presented for the most slender and most robust diaphyses. The best and worst case scenarios are shown for illustration purposes. The best case scenario involves a 10% increase in adult cortical area and a 0%/decade tissue-modulus degradation rate. The worst case scenario involves a 10% reduction in adult cortical area and a −4%/decade tissue-modulus degradation rate. These graphs represent how morphology must change over time for each scenario in order to maintain stiffness during aging. Importantly, the best case scenario shows greater losses in cortical area over time compared to the worst case scenario, because the worst case scenario requires greater periosteal apposition in order to compensate for the same percentage of bone loss.
Second, a cross-sectional study design was simulated by selecting trait information at a random age for each individual in our virtually-aged male and female populations. A linear regression between marrow area and age indicated that marrow area increased 78–80% and 38–44% from 45 to 90 years of age for men and women at the 38% and 66% sites, respectively. Total area, moment of inertia, and cortical area were plotted as a function of age (Table 1). Total area increased 10.3–11.6% from 45 to 90 years of age. Males showed an 18% and 35% greater slope compared to women for the total area versus age regression at the 38% and 66% sites, respectively. Moment of inertia increased 10.3–11.6% between 45 and 90 years of age for the 38% site, but remained constant or showed a slightly negative slope for the 66% site. Cortical area decreased 7.3–10.7% from 45 to 90 years of age, with the 38% site showing slightly larger slopes compared to the 66% site. Thus, variation in adult morphology between men and women resulted in significant differences in the emergent population-level changes in bone traits that are required to maintain stiffness over time.
Table 1.
Sex-specific differences in how bone morphology changes over time
| Trait | Site | % change 45–90 years of age | Slope of Linear Regression | ANCOVA | ||
|---|---|---|---|---|---|---|
| Women | Men | Women | Men | |||
| Total Area | 38% | 11.6% | 10.7% | 0.84 | 0.99 | slope: 0.056 y-int: 0.0001 |
| 66% | 10.3% | 11.0% | 1.03 | 1.39 | slope: 0.002 y-int: N/A |
|
| Moment of Inertia | 38% | 11.6% | 10.3% | 20.86 | 29.55 | slope: 0.045 y-int: N/A |
| 66% | −0.4% | 2.1% | −1.48 | 10.86 | slope: 0.087 y-int: 0.0001 |
|
| Cortical Area | 38% | −10.3% | −10.7% | −0.57 | −0.75 | slope: 0.001 y-int: N/A |
| 66% | −8.0% | −7.3% | −0.52 | −0.56 | slope: 0.31 y-int: 0.0001 |
|
N/A indicates that p-values for y-intercepts were not calculated when a significant difference in slope was found.
DISCUSSION
Current knowledge of how biological processes maintain skeletal function during aging is derived largely from studies that reported a least squares regression describing how a trait changes with age. This approach generates a single biological paradigm for an entire population. We tested whether this “one biology fits all” concept works across a population expressing the normal range in external bone size. The results showed that the periosteal apposition rate required to maintain bone stiffness with aging depended on the natural variation in adult bone morphology and the magnitude of tissue-modulus degradation. Periosteal apposition rate varied by as much as 8-fold across bone sizes, which is quite substantial, indicating that variation in adult bone morphology is an important factor that should be considered in clinical studies to improve our understanding of the cellular basis of fragility. The dependence of periosteal apposition on adult bone size has been acknowledged (30,45,52), but the magnitude of this effect has not been widely appreciated or incorporated into clinical studies.
The current study advanced our understanding of the biology of aging by quantifying in theoretical terms how the periosteal surface should change over time to maintain stiffness for an aging population expressing the normal range in external bone size. The analysis was designed to identify the biological response of the periosteum that could be attributed to the variation in bone size. Our model of periosteal apposition rate is an advance over the prior model (45), because it was specifically developed to preserve stiffness (EI) over time, not moment of inertia, and to incorporate the compensatory changes in morphology and tissue-modulus that accompany the natural variation in robustness (47). Further, the prior model did not explore how periosteal apposition rate must change over time, or determine whether this age-effect also varied with adult bone size. Acquisition of robustness-specific trait sets affected the ratio, r/R, which is raised to the 3rd power in the equation predicting periosteal apposition rate. The relationship between r/R and R (Figure 1) resulted in periosteal apposition rate being extremely sensitive to variation in adult bone morphology. Whether slender or robust diaphyses required greater periosteal apposition rates to maintain stiffness depended on the relationship between cortical area and total area (Figure 2). Site specific differences in this relationship (47) resulted in slender diaphyses requiring greater apposition at the 38% site but less apposition at the 66% site. This analysis suggested that comparing the magnitude of periosteal apposition measured at different anatomical sites should be conducted with caution. For all conditions, the periosteal expansion rate of slender diaphyses was more sensitive to age-effects (Figures 2, 3) compared to robust diaphyses. Continued resorption with aging affected the r/R ratio of slender diaphyses to a greater extent compared to robust diaphyses; this resulted in slender diaphyses requiring as much as a 3.5-fold increase in periosteal apposition rate over time to maintain stiffness (Figure 3B). In addition to aging effects, periosteal apposition rate was also very sensitive to the amount of bone accrued during growth. Modulating adult cortical area by +10% affected the r/R ratio for all structures, but the (r/R)3 term resulted in more severe changes in periosteal apposition rate for slender diaphyses compared to robust diaphyses (Figure 6). This particular analysis emphasized the importance of maximizing bone mass accrual during growth to reduce fracture risk later in life, and further suggested that this phenomenon may be particularly important for children with slender bones. Our model thus showed that poor bone growth places a huge burden on the biological activity required to maintain stiffness during aging.
Several simplifying assumptions regarding the biology of aging were made to determine how the magnitude of periosteal apposition rate depended on adult bone morphology. We used bone traits derived from clinical data (47) and specified a resorption rate which resulted in age-related changes in marrow expansion that were consistent with those reported in cross-sectional and longitudinal studies (16,18,19,49). The total work performed by osteoclasts was standardized across the population so all individuals experienced the same amount of bone loss. Alternatively, we could have standardized the resorption rate (dr/dt) so the radial loss of bone was the same for all individuals. In this latter case, slender diaphyses would lose less bone between 45 and 90 years of age compared to robust diaphyses, and thus would require less periosteal apposition to compensate. Consequently, standardizing resorption rate (dr/dt) would exacerbate the differences in periosteal apposition rate relative to adult bone size (not shown). Resorption was also assumed to progress linearly with age. Decreases in osteoclast activity over time would reduce the nonlinear age-effects, whereas increases in osteoclast activity would exacerbate these nonlinear age-effects. Consequently, the biological parameters used in this analysis appear to be reasonable to draw meaningful conclusions regarding the relationship between periosteal apposition rate and adult bone morphology and tissue-modulus degradation.
We simulated “perfect” aging to quantify the magnitude of structural changes required to maintain bone stiffness over time, which is likely not realistic for an entire population. Although modeling a population of men and women with the same bone length is a simplification from reality, incorporating the natural variation in bone length would not affect the outcome of our study since we were interested in the natural variation in cross-sectional morphology relative to bone length. Any length variation, whether arising from secular sources or not, would be largely taken into consideration by normalizing cross-sectional morphology for bone length. The bone was modeled with a circular cross-section, which is consistent with other studies (e.g., (9,28,53)) but certainly not representative of the true bone geometry. The shift from circular to non-circular profiles would change components of the model but would not change the nonlinear relationship between bone width and whole bone stiffness. Consequently, the outcome of this study should not be affected by modeling bone with a circular or non-circular cross-section. Despite these assumptions, the periosteal apposition rates and the associated age-related changes in total area and cortical area predicted by our model compared well with prior clinical studies. Szulc et al (29) reported an 8–21 micron/year increase in bone width of the distal radius, depending on menopausal status and Hormone Replacement Therapy treatment. Heaney et al (9) reported a 49 micron/year increase in femoral neck diameter. We estimated a 5–20 micron/year increase in the radius of the tibiae (10–40 micron/year increase in width). The estimates of periosteal apposition rate were similar among studies despite differences in bone size and loading conditions. Although this periosteal apposition rate may seem small in magnitude, it is important to recognize that this apposition is responsible for a 20% increase in total cross-sectional area from 45 to 90 years of age. Despite the fact that our model predicted periosteal apposition rate consistent with clinical studies, we expect that more sophisticated models which incorporate other factors such as nonlinear aging effects, complex geometries, complex loading conditions, spatially non-uniform resorption and apposition, and inter-individual variation in the amount of bone loss should be developed to better define individualized targets for periosteal apposition rate. In addition, while the impact of intra-cortical remodeling on periosteal expansion was not modeled explicitly, it was incorporated into tissue-modulus degradation. Future models could also examine this relationship in much greater detail.
Our analysis showed that periosteal apposition rate must increase over time to continue maintaining stiffness (Figure 3A), suggesting that periosteal osteoblasts need to be stimulated to a progressively greater extent with advancing age to keep pace with continued bone resorption. However, Szulc et al (29) reported that the periosteal apposition rate of the distal radius decreased with age for women, which is opposite to that needed to maintain stiffness. As bone resorption progresses during aging, the endocortical surface moves further away from the neutral axis and thus requires progressively greater amounts of bone to be added to the sub-periosteal surface to maintain stiffness. Consequently, the ratio, r/R, will increase over time if endocortical expansion (i.e., the change in r) outpaces periosteal apposition (i.e., the change in R). This age-effect was more pronounced in slender bones compared to robust bones, suggesting that prophylactic treatments may benefit from knowledge of an individual’s adult bone morphology. It will be important to determine whether the skeletal system can keep pace with these theoretical demands or whether the system falls behind with its ability to maintain strength (1).
Sex-specific differences in the magnitude of periosteal apposition are well documented (5,10,16,33–36,49). Most clinical studies found that women do not add as much bone periosteally as men, and often attributed this phenomenon to intrinsic biological differences or sex-specific differences in physical activity level (49). We found significant differences in the total area versus age regressions between men and women (Table 1), with men showing greater increases in total area over time compared to women. This was simulated by prescribing the same percentage of bone loss for men and women and by specifying the same criteria for maintaining stiffness over time. The results suggested that sex-specific differences in how total area changes over time could be attributed in part to morphological differences between the two populations. On average, women do not need to add as much bone periosteally as men to maintain stiffness because women have more slender bones than men. This analysis does not rule out sex-differences in periosteal biology, but simply points out that part of the differential response of the periosteum to aging may be attributable to sexual dimorphism.
Prior work reported that total cross-sectional area of the distal tibia increased 8–19.6% and 2.5–7% from ~20 to 90 years of age for men and women, respectively (16,18,19,54). Ruff and Hayes (49) reported 1–3%/decade increases in total cross-sectional area of the tibia, depending on anatomical site and sex. Our analysis of the emergent behavior calculated for 2,500 men and 2,500 women estimated 10.3–11.6% increases in total cross-sectional area from 45–90 years of age (2.3–2.6%/decade), depending on anatomical site and sex. Thus, the percent change in total area over time attributable to variation in adult bone morphology and tissue-modulus degradation was very similar to the values reported in the literature. This suggested that the natural variation in bone morphology and tissue-modulus degradation are major determinants of the inter-individual variation in periosteal apposition. Other genetic and environmental factors that affect periosteal apposition with aging will be superimposed on the variation attributable to an individual’s morphology and rate of tissue-modulus degradation. The results of our analysis suggest that it will be important to first adjust for morphological and tissue-modulus effects in order to calculate the amount of change in periosteal apposition that could be attributed to other factors such as weight change, estrogen status, vitamin D receptor alleles, etc.
Historically, skeletal function has been well modeled using engineering principles, including the adaptive response of bone to changes in applied loads. We expect that the engineering analysis relating periosteal apposition and maintenance of bone stiffness with aging presented here is no exception. Our model calculated the periosteal apposition rate required to maintain bone stiffness, EI, with aging based on the idea that bone cells are able to sense mechanical strain and adapt accordingly to keep strain-levels within an acceptable range. Because whole bone stiffness is generally proportional to strength, the results should be applicable to strength and fracture resistance. The periosteal apposition rate reflects the magnitude of work required of osteoblasts per unit time to maintain stiffness during aging. Although variation in the amount of periosteal apposition can arise from differences in osteoblastic activity and/or recruitment, our model cannot differentiate between the two, but provides information on the total work required to maintain stiffness over time. Although we assumed endocortical resorption progressed linearly with age, the age-related changes in bone structure and the dependence of periosteal apposition rate on adult bone morphology quickly became highly nonlinear. These nonlinear relationships make the biological response of the periosteum difficult to predict without the assistance of a model.
In conclusion, our analysis showed that the amount of periosteal apposition required to maintain stiffness with aging was highly dependent on the natural variation in bone robustness and tissue-modulus degradation rate, as hypothesized. Importantly, the periosteal apposition rate was also highly dependent on the relationship between cortical area and total area, which varies among anatomical sites and with the amount of bone mass accrued during growth. Although our analysis used data for human tibiae, we expect other bones will show a similar phenomenon. The results showed that the magnitude of this size effect was large and thus strongly argue that further research on how to incorporate this effect into clinical studies may benefit efforts aimed at developing personalized approaches for reducing fracture incidence. As more options for prophylactic treatments become available, it will be important to acquire more precise information about the biological needs of the individual in order to provide the best treatment.
Acknowledgments
The authors wish to thank Dr. Carl J. Terranova, Philip Nasser, Dr. Steven Tommasini, Dr. Justin Bird for their contributions to this manuscript. This work was supported in part by grants from the National Institutes of Health (AR044927, AR056639) and the US Department of Defense (contract no. W81XWH-09-2-0113). The opinions or assertions contained herein are the private views of the authors and are not to be construed as official or as reflecting the views of the U.S. Army or the Department of Defense. Both authors contributed equally to the preparation of this manuscript.
Footnotes
Disclosures
The authors state they have no conflicts of interest.
References
- 1.Albright F, Smith PH, Richardson AM. Post-menopausal osteoporosis. Its clinical features. JAMA. 1941;116:2465–2474. [Google Scholar]
- 2.Smith RW, Walker RR. Femoral expansion in aging women: Implications for osteoporosis and fractures. Science. 1964;145:156–157. doi: 10.1126/science.145.3628.156. [DOI] [PubMed] [Google Scholar]
- 3.Epker BN, Frost HM. Periosteal appositional bone growth from age two to age seventy in man. Anat Rec. 1966;154:573–578. doi: 10.1002/ar.1091540307. [DOI] [PubMed] [Google Scholar]
- 4.Seeman E. Periosteal bone formation--a neglected determinant of bone strength. N Engl J Med. 2003;349(4):320–323. doi: 10.1056/NEJMp038101. [DOI] [PubMed] [Google Scholar]
- 5.Martin RB, Atkinson PJ. Age and sex-related changes in the structure and strength of the human femoral shaft. J Biomech. 1977;10:223–231. doi: 10.1016/0021-9290(77)90045-8. [DOI] [PubMed] [Google Scholar]
- 6.Martin RB, Pickett JC, Zinaich S. Studies of skeletal remodeling in aging men. Clin Orthop Relat Res. 1980;149:268–82. [PubMed] [Google Scholar]
- 7.Ruff CB, Hayes WC. Subperiosteal expansion and cortical remodeling of the human femur and tibia with aging. Science. 1982;217:945–947. doi: 10.1126/science.7112107. [DOI] [PubMed] [Google Scholar]
- 8.Beck TJ, Ruff CB, Scott WW, Plato CC, Tobin JD, Quan CA. Sex differences in geometry of the femoral neck with aging: a structural analysis of bone mineral data. Calcif Tissue Int. 1992;50(1):24–29. doi: 10.1007/BF00297293. [DOI] [PubMed] [Google Scholar]
- 9.Heaney RP, Barger-Lux MJ, Davies KM, Ryan RA, Johnson ML, Gong G. Bone dimensional change with age: interactions of genetic, hormonal, and body size variables. Osteoporos Int. 1997;7(5):426–431. doi: 10.1007/pl00004150. [DOI] [PubMed] [Google Scholar]
- 10.Stein MS, Thomas CD, Feik SA, Wark JD, Clement JG. Bone size and mechanics at the femoral diaphysis across age and sex. J Biomech. 1998;31(12):1101–10. doi: 10.1016/s0021-9290(98)00127-4. [DOI] [PubMed] [Google Scholar]
- 11.Beck TJ, Looker AC, Ruff CB, Sievanen H, Wahner HW. Structural trends in the aging femoral neck and proximal shaft: analysis of the Third National Health and Nutrition Examination Survey dual-energy X-ray absorptiometry data. J Bone Miner Res. 2000;15(12):2297–304. doi: 10.1359/jbmr.2000.15.12.2297. [DOI] [PubMed] [Google Scholar]
- 12.Duan Y, Turner CH, Kim BT, Seeman E. Sexual dimorphism in vertebral fragility is more the result of gender differences in age-related bone gain than bone loss. J Bone Miner Res. 2001;16(12):2267–75. doi: 10.1359/jbmr.2001.16.12.2267. [DOI] [PubMed] [Google Scholar]
- 13.Tabensky A, Duan Y, Edmonds J, Seeman E. The contribution of reduced peak accrual of bone and age-related bone loss to osteoporosis at the spine and hip: insights from the daughters of women with vertebral or hip fractures. J Bone Miner Res. 2001;16(6):1101–7. doi: 10.1359/jbmr.2001.16.6.1101. [DOI] [PubMed] [Google Scholar]
- 14.Beck TJ, Oreskovic TL, Stone KL, Ruff CB, Ensrud K, Nevitt MC, Genant HK, Cummings SR. Structural adaptation to changing skeletal load in the progression toward hip fragility: the study of osteoporotic fractures. J Bone Miner Res. 2001;16(6):1108–19. doi: 10.1359/jbmr.2001.16.6.1108. [DOI] [PubMed] [Google Scholar]
- 15.Power J, Loveridge N, Rushton N, Parker M, Reeve J. Evidence for bone formation on the external “periosteal” surface of the femoral neck: a comparison of intracapsular hip fracture cases and controls. Osteoporos Int. 2003;14(2):141–145. doi: 10.1007/s00198-002-1333-8. [DOI] [PubMed] [Google Scholar]
- 16.Riggs BL, Melton LJ, 3rd, Robb RA, Camp JJ, Atkinson EJ, Peterson JM, Rouleau PA, McCollough CH, Bouxsein ML, Khosla S. Population-based study of age and sex differences in bone volumetric density, size, geometry, and structure at different skeletal sites. J Bone Miner Res. 2004;19(12):1945–54. doi: 10.1359/JBMR.040916. [DOI] [PubMed] [Google Scholar]
- 17.Beck TJ, Looker AC, Mourtada F, Daphtary MM, Ruff CB. Age trends in femur stresses from a simulated fall on the hip among men and women: evidence of homeostatic adaptation underlying the decline in hip BMD. J Bone Miner Res. 2006;21(9):1425–32. doi: 10.1359/jbmr.060617. [DOI] [PubMed] [Google Scholar]
- 18.Russo CR, Lauretani F, Seeman E, Bartali B, Bandinelli S, Di Iorio A, Guralnik J, Ferrucci L. Structural adaptations to bone loss in aging men and women. Bone. 2006;38(1):112–8. doi: 10.1016/j.bone.2005.07.025. [DOI] [PubMed] [Google Scholar]
- 19.Lauretani F, Bandinelli S, Griswold ME, Maggio M, Semba R, Guralnik JM, Ferrucci L. Longitudinal changes in BMD and bone geometry in a population-based study. J Bone Miner Res. 2008;23(3):400–8. doi: 10.1359/JBMR.071103. [DOI] [PMC free article] [PubMed] [Google Scholar]
- 20.Garn SM, Rohmann CG, Wagner B, Ascoli W. Continuing bone growth throughout life: a general phenomenon. Am J Phys Anthropol. 1967;26:313–318. doi: 10.1002/ajpa.1330260306. [DOI] [PubMed] [Google Scholar]
- 21.Garn SM, Frisancho AR, Sandusky ST, McCann MB. Confirmation of the sex difference in continuing subperiosteal apposition. Am J Phys Anthropol. 1972;36(3):377–80. doi: 10.1002/ajpa.1330360308. [DOI] [PubMed] [Google Scholar]
- 22.Israel H. Age factor and the pattern of change in craniofacial structures. Am J Phys Anthropol. 1973;39(1):111–28. doi: 10.1002/ajpa.1330390112. [DOI] [PubMed] [Google Scholar]
- 23.Israel H. The dichotomous pattern of craniofacial expansion during aging. Am J Phys Anthropol. 1977;47(1):47–51. doi: 10.1002/ajpa.1330470110. [DOI] [PubMed] [Google Scholar]
- 24.Pfeiffer S. Age changes in the external dimensions of adult bone. Am J Phys Anthropol. 1980;52(4):529–32. doi: 10.1002/ajpa.1330520409. [DOI] [PubMed] [Google Scholar]
- 25.Lazenby RA. Continuing periosteal apposition I: Documentation, hypotheses, and interpretation. Am J Phys Anthropol. 1990;82:451–472. doi: 10.1002/ajpa.1330820407. [DOI] [PubMed] [Google Scholar]
- 26.Bouxsein ML, Myburgh KH, van der Meulen MC, Lindenberger E, Marcus R. Age-related differences in cross-sectional geometry of the forearm bones in healthy women. Calcif Tissue Int. 1994;54(2):113–8. doi: 10.1007/BF00296061. [DOI] [PubMed] [Google Scholar]
- 27.Maggio D, Pacifici R, Cherubini A, Simonelli G, Luchetti M, Aisa MC, Cucinotta D, Adami S, Senin U. Age-related cortical bone loss at the metacarpal. Calcif Tissue Int. 1997;60(1):94–7. doi: 10.1007/s002239900193. [DOI] [PubMed] [Google Scholar]
- 28.Ahlborg HG, Johnell O, Turner CH, Rannevik G, Karlsson MK. Bone loss and bone size after menopause. N Engl J Med. 2003;349(4):327–334. doi: 10.1056/NEJMoa022464. [DOI] [PubMed] [Google Scholar]
- 29.Szulc P, Seeman E, Duboeuf F, Sornay-Rendu E, Delmas PD. Bone fragility: failure of periosteal apposition to compensate for increased endocortical resorption in postmenopausal women. J Bone Miner Res. 2006;21(12):1856–63. doi: 10.1359/jbmr.060904. [DOI] [PubMed] [Google Scholar]
- 30.Allen MR, Hock JM, Burr DB. Periosteum: biology, regulation, and response to osteoporosis therapies. Bone. 2004;35(5):1003–12. doi: 10.1016/j.bone.2004.07.014. [DOI] [PubMed] [Google Scholar]
- 31.Lanyon L, Skerry T. Postmenopausal osteoporosis as a failure of bone’s adaptation to functional loading: a hypothesis. J Bone Miner Res. 2001;16(11):1937–47. doi: 10.1359/jbmr.2001.16.11.1937. [DOI] [PubMed] [Google Scholar]
- 32.Fox KM, Tobin JD, Plato CC. Longitudinal study of bone loss in the second metacarpal. Calcif Tissue Int. 1986;39(4):218–25. doi: 10.1007/BF02555207. [DOI] [PubMed] [Google Scholar]
- 33.Iwamoto J, Takeda T, Otani T, Yabe Y. Age-related changes in cortical bone in women: metacarpal bone mass measurement study. J Orthop Sci. 1998;3(2):90–4. doi: 10.1007/s007760050027. [DOI] [PubMed] [Google Scholar]
- 34.Burr DB, Martin RB. The effects of composition, structure and age on the torsional properties of the human radius. J Biomech. 1983;16(8):603–8. doi: 10.1016/0021-9290(83)90110-0. [DOI] [PubMed] [Google Scholar]
- 35.Iwamoto J, Takeda T, Ichimura S, Tsukimura Y, Toyama Y. Age-related changes in cortical bone in men: metacarpal bone mass measurement study. J Orthop Sci. 2000;5(1):4–9. doi: 10.1007/s007760050002. [DOI] [PubMed] [Google Scholar]
- 36.Duan Y, Beck TJ, Wang XF, Seeman E. Structural and biomechanical basis of sexual dimorphism in femoral neck fragility has its origins in growth and aging. J Bone Miner Res. 2003;18(10):1766–74. doi: 10.1359/jbmr.2003.18.10.1766. [DOI] [PubMed] [Google Scholar]
- 37.Turner RT, Backup P, Sherman PJ, Hill E, Evans GL, Spelsberg TC. Mechanism of action of estrogen on intramembranous bone formation: regulation of osteoblast differentiation and activity. Endocrinology. 1992;131(2):883–9. doi: 10.1210/endo.131.2.1639030. [DOI] [PubMed] [Google Scholar]
- 38.Uusi-Rasi K, Sievanen H, Vuori I, Pasanen M, Heinonen A, Oja P. Associations of physical activity and calcium intake with bone mass and size in healthy women at different ages. J Bone Miner Res. 1998;13(1):133–42. doi: 10.1359/jbmr.1998.13.1.133. [DOI] [PubMed] [Google Scholar]
- 39.Lee K, Jessop H, Suswillo R, Zaman G, Lanyon L. Endocrinology: bone adaptation requires oestrogen receptor-alpha. Nature. 2003;424(6947):389. doi: 10.1038/424389a. [DOI] [PubMed] [Google Scholar]
- 40.Kim BT, Mosekilde L, Duan Y, Zhang XZ, Tornvig L, Thomsen JS, Seeman E. The structural and hormonal basis of sex differences in peak appendicular bone strength in rats. J Bone Miner Res. 2003;18(1):150–5. doi: 10.1359/jbmr.2003.18.1.150. [DOI] [PubMed] [Google Scholar]
- 41.Midura RJ, Su X, Morcuende JA, Tammi M, Tammi R. Parathyroid hormone rapidly stimulates hyaluronan synthesis by periosteal osteoblasts in the tibial diaphysis of the growing rat. J Biol Chem. 2003;278(51):51462–8. doi: 10.1074/jbc.M307567200. [DOI] [PubMed] [Google Scholar]
- 42.Rivadeneira F, Houwing-Duistermaat JJ, Vaessen N, Vergeer-Drop JM, Hofman A, Pols HA, Van Duijn CM, Uitterlinden AG. Association between an insulin-like growth factor I gene promoter polymorphism and bone mineral density in the elderly: the Rotterdam Study. J Clin Endocrinol Metab. 2003;88(8):3878–84. doi: 10.1210/jc.2002-021813. [DOI] [PubMed] [Google Scholar]
- 43.Lanyon L, Armstrong V, Ong D, Zaman G, Price J. Is estrogen receptor alpha key to controlling bones’ resistance to fracture? J Endocrinol. 2004;182(2):183–91. doi: 10.1677/joe.0.1820183. [DOI] [PubMed] [Google Scholar]
- 44.Zhai G, Rivadeneira F, Houwing-Duistermaat JJ, Meulenbelt I, Bijkerk C, Hofman A, van Meurs JB, Uitterlinden AG, Pols HA, Slagboom PE, van Duijn CM. Insulin-like growth factor I gene promoter polymorphism, collagen type II alpha1 (COL2A1) gene, and the prevalence of radiographic osteoarthritis: the Rotterdam Study. Ann Rheum Dis. 2004;63(5):544–8. doi: 10.1136/ard.2003.010751. [DOI] [PMC free article] [PubMed] [Google Scholar]
- 45.Lazenby RA. Continuing periosteal apposition. II: The significance of peak bone mass, strain equilibrium, and age-related activity differentials for mechanical compensation in human tubular bones. Am J Phys Anthropol. 1990;82(4):473–84. doi: 10.1002/ajpa.1330820408. [DOI] [PubMed] [Google Scholar]
- 46.Tommasini SM, Nasser P, Schaffler MB, Jepsen KJ. Relationship between bone morphology and bone quality in male tibias: implications for stress fracture risk. J Bone Miner Res. 2005;20(8):1372–80. doi: 10.1359/JBMR.050326. [DOI] [PubMed] [Google Scholar]
- 47.Jepsen KJ, Centi A, Duarte GF, Galloway K, Goldman H, Hampson N, Lappe JM, Cullen DM, Greeves J, Izard R, Nindl BC, Kraemer WJ, Negus CH, Evans RK. Biological constraints that limit compensation of a common skeletal trait variant lead to inequivalence of tibial function among healthy young adults. J Bone Miner Res. 2011;26(12):2872–2875. doi: 10.1002/jbmr.497. [DOI] [PubMed] [Google Scholar]
- 48.Burstein AH, Reilly DT, Martens M. Aging of bone tissue: mechanical properties. J Bone Joint Surg Am. 1976;58(1):82–86. [PubMed] [Google Scholar]
- 49.Ruff CB, Hayes WC. Sex differences in age-related remodeling of the femur and tibia. J Orthop Res. 1988;6(6):886–96. doi: 10.1002/jor.1100060613. [DOI] [PubMed] [Google Scholar]
- 50.Tommasini SM, Nasser P, Jepsen KJ. Sexual dimorphism affects tibia size and shape but not tissue-level mechanical properties. Bone. 2007;40(2):498–505. doi: 10.1016/j.bone.2006.08.012. [DOI] [PubMed] [Google Scholar]
- 51.Liu D, Manske SL, Kontulainen SA, Tang C, Guy P, Oxland TR, McKay HA. Tibial geometry is associated with failure load ex vivo: a MRI, pQCT and DXA study. Osteoporos Int. 2007;18(7):991–7. doi: 10.1007/s00198-007-0325-0. [DOI] [PubMed] [Google Scholar]
- 52.Seeman E, Duan Y. Measurement Issues in Periosteal Apposition. J Bone Miner Res. 2004;19(4):691–692. [Google Scholar]
- 53.Beck TJ, Ruff CB, Shaffer RA, Betsinger K, Trone DW, Brodine SK. Stress fracture in military recruits: gender differences in muscle and bone susceptibility factors. Bone. 2000;27(3):437–44. doi: 10.1016/s8756-3282(00)00342-2. [DOI] [PubMed] [Google Scholar]
- 54.Macdonald HM, Nishiyama KK, Kang J, Hanley DA, Boyd SK. Age-related patterns of trabecular and cortical bone loss differ between sexes and skeletal sites: a population-based HR-pQCT study. J Bone Miner Res. 2011;26(1):50–62. doi: 10.1002/jbmr.171. [DOI] [PubMed] [Google Scholar]


