

Abstract
We compare the velocity and shear obtained from particle image velocimetry (PIV) and computational fluid dynamics (CFD) in a pulsatile ventricular assist device (VAD) to further test our thrombus predictive methodology using microscopy data from an explanted VAD. To mimic physiological conditions in vitro, a mock circulatory loop is used with a blood analog that matched blood’s viscoelastic behavior at 40% hematocrit. Under normal physiologic pressures and for a heart rate of 75 bpm, PIV data is acquired and wall shear maps are produced. The resolution of the PIV shear rate calculations are tested using the CFD and found to be in the same range. A bovine study, using a model of the 50 cc Penn State V-2 VAD, for 30 days at a constant beat rate of 75 beats per minute (bpm) provides the microscopic data whereby after the 30 days, the device is explanted and the sac surface analyzed using scanning electron microscopy (SEM) and, after immunofluorescent labeling for platelets and fibrin, confocal microscopy. Areas are examined based on PIV measurements and CFD, with special attention to low shear regions where platelet and fibrin deposition are most likely to occur. Data collected within the outlet port in a direction normal to the front wall of the VAD shows that some regions experience wall shear rates less than 500 s−1, which increases the likelihood of platelet and fibrin deposition. Despite only one animal study, correlations between PIV, CFD, and in vivo data show promise. Deposition probability is quantified by the thrombus susceptibility potential, a calculation to correlate low shear and time of shear with deposition.
Keywords: ventricular assist device, thrombosis, platelets, fibrin, fluid mechanics, particle image velocimetry, surface analysis, computational fluid dynamics
Introduction
An estimated 82.6 million American adults have lived with cardiovascular disease (CVD), resulting in the leading cause of all deaths in the United States [1]. While the best treatment for patients with end stage heart failure has been a transplant, there have not been enough donors. In the United States, the ratio of heart transplant recipients to wait-listed patients has been 1:10 [2]. Ventricular assist devices (VADs) have been an alternative to heart transplants for people suffering from congestive heart failure and can be used clinically for bridge-to-transplant, bridge-to-recovery and destination therapy. In 2001, the Randomized Evaluation of Mechanical Assistance in the Treatment of Congestive Heart Failure (REMATCH) reported a 52% survival rate for patients who received a VAD after one year and 23% after two years [3]. According to the Interagency Registry for Mechanical Circulatory Support (INTERMACS), the survival rates from the beginning of the decade increased to approximately 80% after one year and 70% after two years [4]. Though promising, significant challenges have remained to influence the success of VADs, specifically in their tendency to cause thrombosis.
Development of pulsatile VADs, with sizes ranging from 10cc to 100cc stroke volumes, has been ongoing at Penn State University since the 1970s. In 2001, the first, fully implantable LVAD, the 70cc LionHeart, reached clinical trials and showed little evidence of thrombus formation but was too large for many patients [5]. Efforts to develop a smaller 50cc device to accommodate smaller patients have continued. To locate thrombus-prone regions, devices were implanted from 3 to 30 days in bovines, and then were explanted and the surface of sacs lining the VADs were evaluated [6–8]. Yamanaka et al. concluded from a bovine study with the 50cc VAD that platelet and fibrin aggregation, and consequently thrombus formation, were region dependent within a VAD [8]. On a microscopic scale, the surface of the polyurethane was not perfectly smooth, providing crevices that catch blood components like platelets. Furthering the problem, fluid flow at high shear rates caused platelet activation and formation of fibrin [9]. Together these may have resulted in embolization. To understand the impact of fluid mechanics on deposition, in vitro studies were conducted to identify areas of low wall shear rates as function of pump cycle time within the VADs [10–12]. Our initial earlier work showed correlation of thrombus formation between three animal explants of the first version of the 50 cc VAD and areas of persistent low wall shear as calculated using PIV [10]. This study validated our initial effort to demonstrate that PIV could be used as a method to compare, and later predict, thrombus formation on our pulsatile VADs. The major limitation of this particular study was that the explanted blood sac surface analysis was mostly macroscopic and that which was microscopic was not done over the entire sac. Furthermore, the in vivo VAD studies did not have the pump fixed at one beat rate, so the fluid mechanics would vary from cycle to cycle.
Hochareon et al. conducted PIV studies on an acrylic model of the Penn State 50cc V-0 VAD and identified regions within the VAD that have wall shear rates below 500 s−1 [13]. The value of 500 s−1 was determined by Hubbell and McIntire [14] to be a threshold for platelet adhesion for polyurethane, a material similar to the blood sac material used in Penn State VADs. Subsequent PIV studies determined whether that threshold was attained as a function of inlet valve angle, beat rate and blood analogs with varying viscoelastic properties [11, 12, 15, 16]. Further 50cc VAD designs were analyzed to determine the shape of the walls and the orientation of the inlet and outlet ports that best facilitated washing within the pump [16]. The V-2 model was characterized by a straight rear wall and ports equidistant from the midline of the pump and parallel to one another and was found to be the best design based on PIV studies [16]. Computational simulations add another dimension to fluid mechanics studies and offer support to observations made clinically and in vitro [17]. The VAD models previously discussed have been recreated computationally by Medvitz [17,18].
While previous studies showed surface analysis of explanted sacs from animal studies and flow characterization from PIV and computational modeling of the Penn State V-2 VAD, the results had been reviewed independently. The objective of this study was to compare the in vitro PIV studies and the CFD but then use a unique animal study, with a fixed beat rate for the VAD, as a way to further test the predictive capability of wall shear rates to microscopic deposition. In earlier studies, the beat rate of the in vivo pump was allowed to vary from 75 to 150 bpm [11], to maintain complete filling, raising the question about the value of the comparisons. Here, the beat rate is fixed at 75 bpm for the PIV, CFD, and bovine study. Bovine studies typically were tested for 30 days to assess the pump performance, which focused on the ability for the VAD to adapt to the physiologic needs of the bovine, which would result in changes in the beat rate to accommodate those physiologic changes, thus, fixing the pump beat rate at 75 bpm was unique and had not been attempted prior.
Materials and Methods
In Vitro Experiments
The V-2 model (Figures 1A and B) has the most consistently high wall shear rate and therefore, a model of that device was used for this study [12,16]. The rear half of the device in vitro consisted of a polyurethane diaphragm allowing a Superpump and ViViGen Waveform Generator (StarFish Medical, Victoria, B.C.) to drive fluid through the system. A programmable waveform generator controlled the pump using a cardiac waveform and the systolic duration and stroke length, which were fixed at 38% and 15 mm, respectively, with a beat rate of 75 bpm. The VAD model was the main component of a mock circulatory loop designed by Rosenberg et al. [19] and further described in Navitsky et al. [12]. Arterial pressures (Argon Medical Devices, Athens, TX) were kept at 120/80 mmHg while venous pressures were kept at 30/5 mmHg. Ultrasonic flow probes (Transonic Systems, Inc., Ithaca, NY) monitored the volume of fluid being pumped throughout the loop at the inlet and outlet.
Figure 1.

(A) Data points were collected in 1 mm increments along the curve beginning at the point of origin and extending to the 35 mm location on the rear wall for each normal plane in the side view. (B) Locations of the planes normal to the rear surface of the pump as measured from the outermost part of the inlet port. (C) Sub-sectioning of removed blood sac samples are shown and indicated as S1 and S2 for sections removed for SEM preparation, and F1 and F2 are sections labeled with fluorescent antibodies to be viewed by confocal microscopy. Shown in (D) are locations of the 6 images acquired on each subsection using both SEM and confocal microscopy.
A shear thinning viscoelastic blood analog, consisting of sodium iodide, water, glycerin, and xanthan gum, was used to match the properties of 40% hematocrit blood as described by Long et al. [20] and used in Navitsky et al. [12]. The fluid viscoelasticity was checked using a viscoelastic analyzer (Vilastic-3, Vilastic Scientific, Inc., Austin, TX) with an asymptotic kinematic viscosity of approximately 4 cSt at high shear rates. The fluid was seeded with 10 μm glass beads (Potters Industries, Inc., Valley Forge, PA) for imaging purposes and followed the fluid motion based on a calculated Stokes number « 1 [21].
To image flow, a Gemini PIV 15 system (New Wave Research, Inc., Fremont, CA) was used as described in more detail by Navitsky et al. [12]. In brief, the lasers were focused to a light sheet 300 μm thick. A synchronized, two megapixel CCD camera (TSI, Inc., Shoreview, MN) with a Nikon 50 mm F1.8 lens (Nikon Corporation, Tokyo, Japan) acquired the images within the acrylic model. Two hundred image pairs were collected at each measurement plane for every 7% of both systole and diastole. Using Insight™ 3G software (TSI, Inc., Shoreview, MN), the double pulsed images were correlated and the flow velocities calculated. We used an in-house MATLAB (The MathWorks, Inc., Natick, MA) algorithm developed by Hochareon et al. to calculate wall shear rates [6,11–13,21]. We have estimated and reduced our error [16,22] using wall identification and centroid shifting techniques developed by Hochaeron et al. [13].
The areas of interest for this study included regions at both the bottom of the model and the rear wall of the model (Figure 1A and B). Data was focused on planes both normal and parallel to the rear wall. The normal planes were located 19.5, 26.9, 34.24, 42.5 and 50.6 millimeters (mm) in the positive X-direction from the outermost edge of the inlet port (Figure 1A). More specifically, on these normal planes, data were collected at locations along the curved bottom of the device. With the origin on the bottom of the device measured 10.16 mm from the plane of the rear wall (the depth of the acrylic model used in the mock circulatory loop), data were collected in 1 mm increments along the bottom and up the rear of the device for 35 mm (Figure 1). Attention was on the outlet side of the pump where previous PIV and computational data have shown areas of wall shear rates below 500 s−1.
Computational Fluid Dynamics
In previous work, Medvitz et al. simulated pulsatile flow through the V-2 VAD [17] at a flow rate of 3.8 lpm, 75 bpm and a constant LVAD pressure rise of 80 mm Hg for each cycle. Unlike the in vitro experiments, the fluid was considered to be Newtonian. CFD validation against PIV studies was conducted using a mesh of 3.5 × 10⁶ grid points and 400 time steps per cycle (Δt = 0.00174 s) [18]. The inlet of the computational domain was set to seven inlet diameters upstream of the mitral valve and the outlet was 15 inlet diameters downstream of the aortic valve to minimize flow unsteadiness due to the aortic valve wake.
Physical models of both pump operation and valve closure were used to model the pump operation computationally. The piston motion driving the flow was modeled using a deformation mesh to displace the piston and vary the chamber volume. The piston motion was modeled to reproduce the in vitro mitral and aortic port waveforms. Flow directionality was established using viscosity to mimic valve closure, with the timing of closure also based on in vitro waveforms [17]. The CFD model used Bjork-Shiley Monostrut valves with the mitral valve rotated by 30° as in PIV experiments but the valve motion was not prescribed. Valve properties of rebound and leakage were also neglected in this model. CFD allowed for flow and wall shear rate comparisons against in vitro PIV results that have not been previously published. Two dimensional velocity and wall shear data were extracted from grid intersections nearest the locations specified in Figures 1A and B. Velocity and wall shear plots were compared to both the PIV results and the microscopic analysis of the explanted blood sac from the bovine study.
Thrombus Susceptibility Potential
A quantitative method for determining the likelihood of thrombus formation was developed by Medvitz [17,18]. The thrombus susceptibility potential (TSP), which has been adapted and applied to the PIV measurements, was based on wall shear rates over the entire cardiac cycle [12,23]. The equation,
produced a value between 0 and 1, with 1 indicating a high risk and 0 a low risk of thrombus formation. In the TSP, N was the number of time steps taken through the cardiac cycle, Δt was the amount of time between image acquisitions for PIV (56 ms), and γw was the wall shear rate, where γpeak was set to 500 s−1 [14], γcutoff was set to 1000 s−1 [24], and tcrit was set to twice the value of Δt. TSP calculations for this study were conducted over the cardiac cycle for flow in directions both normal and parallel to the rear wall of the device.
Blood Sac Surface Evaluation
After the completion of a 30-day, single bovine study (IACUC #97104) of a 50cc V-2 VAD, the polyurethane blood contacting sac was analyzed. This study was unique as the VAD beat rate was typically allowed to vary 75–150 bpm) during our standard pump performance testing in bovine over 30 days. By fixing the VAD beat rate, we were able to eliminate a variability of the flow. Immediately after explantation, the sac was flushed with saline then with a 1% paraformaldehyde fixative to preserve formations on the surface. The sac was then stored in a 0.9% saline solution until it was sectioned for evaluation. Eight sections corresponding to the areas designated by Yamanaka et al. were removed prior to the evaluation [8]. In addition, 4 mm by 8 mm samples were removed along the line in Figure 1A from the point of origin to the 35 mm (Z = 26 mm) location on the rear wall. These samples were removed beginning at the origin of the line in Figure 1A through the curve connecting the bottom and rear walls and centered on the 35 mm location for each of the normal planes (X = 19.5, 26.9, 34.24, 42.5 and 50.8 mm) as illustrated in Figure 1B. This allowed a portion of the rear wall and 10.16 mm of the bottom wall to be examined along the specified normal planes, enabling comparisons to be made to the PIV data collected at the same locations. After removal, each section was further divided into four 2 mm by 4 mm sub-sections, two designated for fluorescence labeling (F1 and F2) and imaging with a confocal microscope and two for dehydration (S1 and S2) followed by SEM imaging (Figure 1C).
The samples to be examined under SEM were first fixed in a 2.5% gluteraldehyde solution (0.1M Sodium ACOH buffer, pH 7.4) overnight at 4°C. The samples were then dehydrated using an alcohol dehydration series with ethanol concentrations of 25, 50, 70, 85, 95 and 100%. In each concentration, the samples incubated for 5 minutes at room temperature. The 100% ethanol step was performed 3 times. Samples were immediately transferred in pure ethanol to a critical point dryer where the ethanol solvent was replaced with bone dry CO2. The samples were then mounted on SEM stubs with carbon tape, sputter coated with a gold/palladium (80/20) mixture and imaged at 500x. Six images were captured randomly for each sample in the sequence at the approximate locations shown in Figure 1D.
The remaining samples were labeled using fluorescent antibodies and then examined using a confocal microscope. The samples were placed in a 1% chicken and 1% rabbit blocking agent and incubated at room temperature for 1 hour prior to labeling with primary antibodies. Concentrations of 1.5 microliters (μL) of CAPP2A and 1.0 μL of goat anti-bovine fibrinogen per milliliter (mL) of blocking agent were added to the samples, to label platelets and fibrin, respectively. Samples incubated overnight at 4 °C and were then washed with PBS. The PBS was again replaced with the blocking agent, and fluorescent secondary antibodies were added. Two μl of Alexa Fluor 488 chicken anti-mouse per mL of PBS was used to label platelets and 2 μl of Alexa Fluor 555 rabbit anti-goat per mL of PBS were added to label fibrin. After incubating in the dark for 1 hour at 37 °C, these samples were washed with PBS to remove non-specifically bound antibodies. Each sample was viewed under a confocal microscope. Six images were acquired of each sample as described for SEM (Figure 1D) and analyzed for platelet and fibrin deposition.
The analysis performed on both confocal and SEM images were qualitative. A complication of imaging polyurethane was the material’s ability to autofluoresce when excited by lasers used for microscopy but we have been able to develop an approach that mitigated this particular problem [7,8]. Confocal microscopes reduced this effect by creating a 2-D image composed of maximum pixel intensities for each location on the sac surface by exposing only a point on the surface to light through a pinhole. As a result, structures, such as platelets and fibrin, can be observed despite autofluorescence because the fluorescent signal transmitted at the pixels where these structures exist was stronger. SEM was used to confirm the surface topography and structures found on fluorescently labeled samples. However, because of sample preparation requirements, the comparison between the two techniques was limited to areas in close proximity.
On the outlet side of the pump, the presence of fibrin and platelet clots provided sufficient contrast between these structures and superfluous debris eliminating focusing as a concern. The focusing problem was mitigated in post-processing by manually raising the threshold of low contrast images so that the background intensity was approximately the same as in images where clear and definite fibrin or platelets were the only structures visible.
Results and Discussion
Particle Image Velocimetry
PIV velocity maps and wall shear plots were generated both in the normal and parallel directions [12]. Figure 2A showed flow maps within the LVAD during diastole at 4.3%, 21.7%, 39.7% and 57% of the cardiac cycle, where 0% is the beginning of diastole. (Note that data were collected at 7% intervals of both diastole and systole, which correlate to these values of the entire cardiac cycle.) As the pusher plate retracted, an inlet jet entered through the mitral valve with a peak speed of approximately 1.4 m/s. As the model continued to fill, the jet washed the inlet wall and the bottom curve, and approached the mid-line of the pump. The jet then detached from the wall and recirculated in the center of the pump until the onset of systole. Velocity magnitudes along the outlet side of the pump never exceeded 0.8 m/s.
Figure 2.

(A) Velocity contour maps of flow in the plane 1 mm parallel to the rear wall during diastole within the Penn State V-2 LVAD at a beat rate of 75 bpm. Percentages show progress through the cardiac cycle where 0% is the beginning of diastole and 62% is the end of diastole. “With kind permission from Springer Science & Business Media: Annals of Biomedical Engineering, A thrombus susceptibility comparison of two pulsatile Penn State 50cc left ventricular assist device designs, 41(1), 2013, p. 9, Navitsky MA, Deutsch S, Manning KB, Figure 3b, and 2012 Biomedical Engineering Society.” (B) Wall shear plots of flow during diastole (0% through 62% of the cardiac cycle), normalized by 500 s−1 at locations from 0 to 30 mm along the bottom wall curvature (indicated by the red arrow in Figure 1A from the point of origin to (X, 21, Z)) on each of the 19.5, 26.9, 34.24, 42.5 and 50.8 mm normal planes (indicated by the vertical black lines in Figure 1B). “Parts of Figure 2B with kind permission from Springer Science & Business Media: Annals of Biomedical Engineering, A thrombus susceptibility comparison of two pulsatile Penn State 50cc left ventricular assist device designs, 41(1), 2013, pp. 10–12, Navitsky MA, Deutsch S, Manning KB, Parts of Figures 5b, 7b, and 9a, and 2012 Biomedical Engineering Society.”
The velocity magnitudes of the flow where the inlet jet detached from the wall during diastole were typically small. Because platelet and fibrin deposition was a significant function of wall shear rates [25], the low velocity regions observed during diastole were the focus of this study.
Figures 1A and B showed the wall locations corresponding to the wall shear plots in Figure 2B. The normal plane from which the data were collected was labeled above each plot in Figure 2B, corresponding to the locations identified by the vertical black lines in Figure 1B. The right hand axis of Figure 2B showed the distance along the pump’s bottom wall curvature (the red arrow in Figure 1A) for which shear rates were calculated, with 0 mm corresponding to the point of origin on each normal plane. Shear rates were calculated for a distance of 30 mm along the wall, corresponding to (X, 21 mm, Z) in Figure 1A. (Note that Figure 1A measures the distance along the curve to 35 mm (X, 26 mm, Z) because samples of the explanted blood sac were collected from that location on each normal plane.)
In Figure 2B, shear rates were calculated based on the velocities measured during diastole of the cardiac cycle. The Y-axis indicates the time progression through diastole with 0% corresponding to the onset of diastole and 62% at the conclusion of diastole. Recall that the rate was 75 bpm and the systolic duration was 38%. Wall shear rates were normalized by 500 s−1 to focus on the deposition threshold on this material. Therefore, a value of −1 equals to a wall shear value of −500 s−1. Negative values (blue) corresponded to flow moving along the wall of each normal plane toward the bottom of the pump (toward the point of origin at 0 mm) and positive values (red) corresponded to flow moving along the wall of each normal plane toward the top of the pump (toward the (X, 21, Z) on each normal plane). The highest wall shear rates were found on the 19.5 mm normal plane in the 20 to 30 mm section of the rear wall. This region of the pump had the largest shear rates within each of the normal planes. The lowest wall shear rates for all of the planes occurred in the 0 to 10 mm region, indicating that the bottom of the pump, especially those areas closest to the 0 mm location, had the highest susceptibility for thrombus formation.
Computational Fluid Dynamics
Computational fluid dynamics provided another method of flow analysis through the Penn State V-2 LVAD [17,18]. Figure 3 showed contour maps of wall shear rates within the LVAD at 4.3%, 21.7%, 39.7% and 59% of the cardiac cycle, where 0% is the beginning of diastole. As in the PIV velocity plots, the inlet jet formed at the onset of diastole as it entered and exited through the mitral valve and then, washed the bottom wall on the inlet side of the model. Toward the end of diastole, the jet detached from the wall and recirculated in the center of the pump. CFD also showed that areas of the highest shear within the jet occurred along the bottom, inlet side wall. The region downstream of the jet detachment would be susceptible to thrombus formation.
Figure 3.
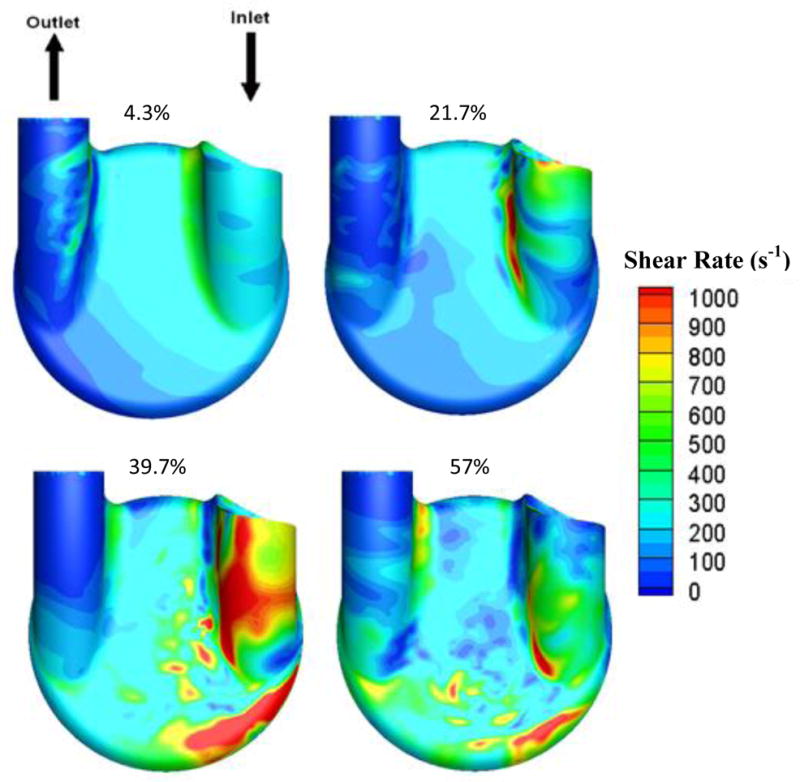
Computational fluid dynamics modeling of wall shear in the Penn State V-2 LVAD for flow in the 1 mm parallel plane during diastole at a beat rate of 75 bpm. Percentages showed progress through the cardiac cycle, where 0% is the beginning of diastole.
Correlations between PIV and CFD
The overall flow observed with PIV and CFD were similar within the VAD. However, the velocity and shear values varied between the techniques. The major differences were in the times at which the inlet jet traveled through the pump. The inlet jet, as visualized with PIV along the 1 mm parallel plane, exited the inlet port and moved toward the bottom of the pump 35% through diastole (Figure 2A). This main jet reached approximately the same location on the pump around 60% through diastole using the CFD model (Figure 3). In general, velocity magnitudes within the pump calculated using CFD were lower than those calculated using PIV. An explanation for these differences could be in the valve closure simplifications used for CFD modeling.
A strength of the computational model was its ability to use higher resolution to calculate shear and velocity data very close to the wall. The PIV data in the normal plane images of the model were no closer than 96 μm from the wall. To compare values for locations along the 50.8 mm normal plane, CFD shear rates were plotted in Figure 4. CFD shear values at distances of 96 μm and 25 μm from the wall were shown at locations of 0, 17 and 25 mm along the 50.8 mm normal plane. The CFD shear values at the two distances were nearly identical for each location within the pump, indicating that a distance of 96 μm was sufficiently close to the wall for a reasonable wall shear estimate. Along the 50.8 mm normal plane, the PIV and CFD measurements matched within the standard deviation of PIV, suggesting that the experiments were within the same range as the CFD [12].
Figure 4.

Wall shear rate measurements from CFD at (A) 0 mm, (B) 17 mm, and (C) 25 mm along the 50.8 mm normal plane.
Blood Sac Surface Evaluation
Representative images from the rear wall of the pump at locations 17 mm ([X,Y,Z] = [50.8 mm, 8 mm, Z]) along the red curve from the origin (Figure 1A) on each of the normal planes are shown in Figure 5. Figures 5A, B and C show little, if any, fluorescent activity, indicating there were no platelets or fibrin, while the images acquired from samples removed from the outlet side of the pump, Figures 5D and E, showed higher fluorescent activity. In the latter images, there was significant coverage by both platelets and fibrin. The green (platelets) were on the order of 2–4 μm, a size typical of activated and spread platelets. The red (fibrin) is shown as both microclots, about the same size as platelets, and as splayed, web-like structures on the sac surface. The intensity of the fluorescence of both the fibrin and platelets in contrast to the background in these images provided strong assurance of their identity.
Figure 5.

Images acquired from the rear wall, 17 mm along the curvature from the origin (Figure 1) on the (A) 19.5 mm, (B) 26.9 mm, (C) 34.24 mm, (D) 42.5 mm and (E) 50.8 mm normal planes. (white bar = 20 microns)
The blood sac’s bottom section was divided into three regions to simplify analysis. From the point of origin in Figure 1A (parallel planes), the front section of the bottom wall referred to locations 1 mm and 2 mm from the origin in the negative Z-direction (towards the rear wall). The center region referred to locations along the wall 3–6 mm in the negative Z-direction from the origin. Finally, the curve, the region of the pump where the bottom wall transitions to the rear wall, was located 7–10 mm in the negative Z-direction from the origin.
Figure 6 showed representative images acquired from the front section of the bottom wall of the pump. Images acquired from the normal planes (Figure 1B) on the inlet side and at the center of the pump, 19.5 mm (Figure 6A), 26.9 mm (Figure 6B) and 34.24 mm (Figure 6C), showed very little if any fluorescent activity. Figures 6D and E, however, showed strong red fluorescence, indicating the presence of fibrin clots on the sac surface. The clot from the 42.5 mm plane measured approximately 20 μm in length, while the clots from the 50.8 mm plane measured from 20 to 40 μm. The fluorescence of these fibrin structures was sufficiently bright to overcome background fluorescence. Though individual, green platelet structures were visible on the 42.5 mm plane, platelets near or bound to the clots on the 50.8 mm plane, if present, may be hidden by the fluorescence of fibrin formations.
Figure 6.

Images acquired from the front region of the bottom curve, 1 to 2 mm along the curvature from the origin (Figure 1) on the normal planes (A) 19.5 mm, (B) 26.9 mm, (C) 34.24 mm, (D) 42.5 mm and (E) 50.8 mm. (white bar = 20 microns)
The center region of the bottom curve showed similar trends with more deposition on the sac samples from the outlet side normal planes than the inlet side normal planes. Again, the 19.5 mm normal plane and the 26.9 mm normal plane showed little or no sign of platelet and fibrin deposition. From the center region, however, the 34.24 mm plane demonstrated evidence of fibrin deposition with both long, narrow fibrin clots approximately 40 μm by 5 μm and small, round fibrin clots approximately 5 to 10 μm in diameter. The normal planes nearest the outlet port, 42.5 mm 50.8 mm, showed larger, 30 – 40 μm clots in this region. Few platelets were observed.
As shown in Figure 7, the images from the sac samples along the curve joining the bottom and the rear walls displayed fewer large clots than the two regions shown in Figure 6 and along the center region of the bottom curve. Images from the inlet-side planes (Figures 7A and B) showed little to no fluorescent activity, while images from the center and outlet-side planes showed deposition. The 34.24 mm (Figure 7C) and 42.5 mm (Figure 7D) normal planes have evidence of small, fibrin clots instead of the large, isolated clots seen previously. The fluorescent spots measured from 3–10 μm, though distinguishing all of the fluorescent activity as fibrin versus background noise and debris proves difficult. Samples from the 50.8 mm (Figure 7E) normal plane showed isolated clots approximately 20 μm in diameter.
Figure 7.

Images acquired from the rear region of the bottom curve, 7 to 10 mm along the curvature from the origin (Figure 1) on the normal planes (A) 19.5 mm, (B) 26.9 mm, (C) 34.24 mm, (D) 42.5 mm and (E) 50.8 mm. (white bar = 20 microns)
To confirm the fluorescently labeled sub-sections F1 and F2 (Figure 1C), surface evaluation of sub-sections S1 and S2 from the same sample were tested using SEM. Figure 8 compared fluorescent and SEM images acquired from corresponding normal planes. Figures 8A and C showed areas of the sac where a few structures were deposited. Figures 8B and D showed areas of the explanted sac where fibrin and platelet deposition were evident. The green arrows indicated fluorescently labeled platelets on the sac’s surface. Because SEM does not use structural labeling, the features in the image could be either platelets or fibrin. Similar patterns were seen in the SEM images for each of the corresponding confocal images.
Figure 8.

Confirmation of confocal surface analysis by SEM. (A) and (C) show regions of the sac with little, or no, platelet and fibrin deposition. (B) and (D) show images of platelet and fibrin deposition on the sac surface. (Top, fluorescent microscopy, scale bar = 20 microns; Bottom, SEM, scale bar = 50 microns)
Normal and parallel plane correlations between microscopic analysis and TSP
PIV and CFD both showed areas of high wall shear on the inlet side of the pump, where the inlet jet washes most thoroughly and for the longest duration. Consequently, these were the areas where little platelet deposition was found by microscopic analysis. This is in accordance to what others have seen with respect to platelets on adhered surfaces with increasing shear rate [26, 27]. The sections explanted and evaluated with microscopy from the 19.5 and 26.9 mm normal planes showed little to no fluorescent activity both on the rear wall and the bottom and curved sections of the VAD wall. Additionally, there was little deposition on the 34.24 mm plane until near the curve where the rear and bottom surfaces meet (Figures 5–7). These results are similar to Kim et al. with respect to the location of adhered fibrinogen/albumin/IgG in a study with their total artificial heart though they did not quantify the shear levels but only general ranges [27].
Figure 9 compared the TSP resulting from parallel flow with the microscopy samples from corresponding sections. The diagram in the upper left portion of the figure showed measured distances along the arc of the model for the 1 mm parallel plane. For locations of 39.69, 47.59, 55 and 63.33 mm along the 1 mm parallel plane, there was little to no fluorescent activity. On the graph of TSP values, each of these locations corresponded to a value of 0. Thrombus formation was seen at the 72.35 and 90 mm locations. The TSP value near 72 mm just preceded a location where TSP rises from 0, indicating some correlation. This location, in addition to others on the 1 mm parallel plane, such as between 10 and 20 mm, showed a TSP value that falls between 0 and 1. This indicated that the model predicted some deposition, however, with less likelihood than in an area such as the 90 mm location, which has a TSP value of 1.
Figure 9.

Comparisons of confocal microscopy at 39.69, 47.59, 55.0, 63.33, 72.35, and 90.0 mm of the explanted sac surface along the 1 mm parallel plane (Figure 1A) with the TSP along the same 1 mm plane.. “TSP data with kind permission from Springer Science & Business Media: Annals of Biomedical Engineering, A thrombus susceptibility comparison of two pulsatile Penn State 50cc left ventricular assist device designs, 41(1), 2013, p. 14, Navitsky MA, Deutsch S, Manning KB, Figure 13, and 2012 Biomedical Engineering Society.”
The 50.8 mm normal plane (Figure 1B) was another region where platelet and fibrin deposition corresponded well to the TSP calculations. Figure 10 showed a spatial comparison of microscopy from locations both on the rear wall and the bottom wall with TSP values along the 50.8 mm normal plane. Sac samples from the 0 mm location showed high levels of fluorescence, indicating significant fibrin and platelet deposition. The level of adhesion is similar to the surface evaluated by Kim et al. with their total artificial heart [27]. This region corresponded to a TSP value of 1. At a location of 17 mm, the TSP graph increased as the potential for thrombus formation increased. Evaluation of the explanted sac from this location showed considerable microclots, also corresponding to the TSP value. The next section compared was from the 25 mm location. There was very little fluorescent activity and the structures observed on the SEM did not appear to be platelets or fibrin, but rather debris. This corresponded well with the TSP as the value for this location was near 0. Finally, the 35 mm location showed a TSP increase again and the microscopy confirmed platelet and fibrin deposition. The correlations between these images and the in vitro prediction gave confidence to the experimental results obtained. It was important to note that in using TSP as a prediction tool, calculations in both the normal and parallel directions must be considered and correlated.
Figure 10.

Comparisons of confocal microscopy and SEM images at 0, 17, 25, and 35 mm along the explanted sac surface on the 50.8 mm normal plane (Figure 1B) with the TSP along the same 50.8 mm plane.. “TSP data with kind permission from Springer Science & Business Media: Annals of Biomedical Engineering, A thrombus susceptibility comparison of two pulsatile Penn State 50cc left ventricular assist device designs, 41(1), 2013, p. 14, Navitsky MA, Deutsch S, Manning KB, Part of Figure 12a, and 2012 Biomedical Engineering Society.”
Conclusion
In this study, we have expanded our PIV and CFD efforts to predict thrombus deposition, specifically on the microscopic level with platelets and fibrin, on the surface of our pulsatile blood pump contacting surface, polyurethane urea. Previously published correlations were focused solely on the macroscopic deposition, but here, we have correlated a new thrombus susceptibility parameter to explanted animal data. Unlike the previous work, we were able to fix the beat rate (75 bpm) for the VAD in the animal study. Explanted sac samples were labeled with fluorescent antibodies and imaged using a confocal microscope and further analyses with SEM. The flow was measured using PIV, and a CFD simulation was performed whereby both velocities and wall shear rates were calculated and a predictor of thrombus potential, the TSP, used.
Microscopic surface evaluation of the explanted sac on both normal and parallel planes showed significantly more fluorescence activity, indicating platelet and fibrin deposition, on the outlet side of the pump. Fibrin clots ranging from 10 to 40 μm in diameter were imaged on the 42.5 and 50.8 mm normal planes along the bottom wall of the pump. On the bottom wall, the clots with the largest diameters were observed, at approximately 10 mm from the rear wall. Smaller, less isolated clots, were observed near the bottom curve and on the rear wall. The deposition patterns corresponded well to the TSP from PIV wall shear calculations.
Though many points along the 1 mm parallel plane and the normal planes showed strong correlations with the TSP values, the TSP can be improved. For example, the uncertainty in calculating normal wall shear rates (±90 s−1) and parallel wall shear rates (±138 s−1) from PIV could be reduced. In addition, we used limiting shear rates for deposition and values for Δt not fully validated for the material of the Penn State VAD. Because of these current limitations, the TSP would be more useful in comparing competing VAD designs than in providing a method to optimize a design. In addition, we need to obtain more surface analysis from explants.
Acknowledgments
We would like to acknowledge the National Institutes of Health for their support of this project through NIH NHLBI HL60276.
Footnotes
There are no conflicts of interest.
Stephen R. Topper, Michael A. Navitsky, Richard B. Medvitz, Eric G. Paterson, Christopher A. Siedlecki, Margaret J. Slattery, Steven Deutsch, Gerson Rosenberg, and Keefe B. Manning declare that they have no conflict of interest.
All institutional and national guidelines for the care and use of laboratory animals were followed and approved by the appropriate institutional committees (Penn State IACUC #97104). No human studies were carried out by the authors for this article.
References
- 1.Roger VL, Go AS, Lloyd-Jones DM, Adams RJ, Berry JD, et al. Heart disease and stroke statistics—2011 update, a report from the American Heart Association. Circulation. 2011;123:18–209. doi: 10.1161/CIR.0b013e3182009701. [DOI] [PMC free article] [PubMed] [Google Scholar]
- 2.Shreenivas S, Rame J, Jessup M. Mechanical circulatory support as a bridge to transplant or for destination therapy. Curr Heart Fail Rep. 2010;7:159–166. doi: 10.1007/s11897-010-0026-4. [DOI] [PMC free article] [PubMed] [Google Scholar]
- 3.Hernandez AF, Shea AM, Milano CA, Rogers JG, Hammill BG, O’Connor CM, Schulman KA, Peterson ED, Curtis LH. Long-term outcomes and costs of ventricular assist devices among Medicare beneficiaries. JAMA. 2008;300(20):2398–2406. doi: 10.1001/jama.2008.716. [DOI] [PMC free article] [PubMed] [Google Scholar]
- 4.Kirklin JK, Naftel DC, Kormos RL, Stevenson LW, Pagani FD, Miller MA, Baldwin JT, Young JB. Fifth INTERMACS annual report: risk factor analysis from more than 6,000 mechanical circulatory support patients. J Heart Lung Transplant. 2013;32(2):141–156. doi: 10.1016/j.healun.2012.12.004. [DOI] [PubMed] [Google Scholar]
- 5.Mehta S, Pae W, Rosenberg G, Snyder AJ, Weiss WJ, Lewis JP, Frank DJ, Thompson JJ, Pierce WS. The LionHeart LVD-2000: A completely implanted left ventricular assist device for chronic circulatory support. Ann Thorac Surg. 2001;71:156–161. doi: 10.1016/s0003-4975(00)02641-2. [DOI] [PubMed] [Google Scholar]
- 6.Hochareon P, Manning KB, Fontaine AA, Tarbell JM, Deutsch S. Fluid dynamic analysis of the 50cc Penn State artificial heart under physiological operating conditions using particle image velocimetry. J Biomech Eng. 2004;126:585–593. doi: 10.1115/1.1798056. [DOI] [PubMed] [Google Scholar]
- 7.Yamanaka H, Rosenberg G, Weiss WJ, Snyder AJ, Zapanta CM, Siedlecki CA. Multiscale analysis of surface thrombosis in vivo in a left ventricular assist system. ASAIO J. 2005;51(5):567–77. doi: 10.1097/01.mat.0000181707.06225.a0. [DOI] [PubMed] [Google Scholar]
- 8.Yamanaka H, Rosenberg G, Weiss WJ, Snyder AJ, Zapanta CM, Siedlecki CA. Short-term in vivo studies of surface thrombosis in a left ventricular assist system. ASAIO J. 2006;52(3):257–265. doi: 10.1097/01.mat.0000219067.19482.1e. [DOI] [PubMed] [Google Scholar]
- 9.Gorbet MB, Sefton MV. Biomaterial-associated thrombosis: roles of coagulation factors, complement, platelets and leukocytes. Biomaterials. 2004;25:5681–5703. doi: 10.1016/j.biomaterials.2004.01.023. [DOI] [PubMed] [Google Scholar]
- 10.Hochareon P, Manning KB, Fontaine AA, Tarbell JM, Deutsch S. Correlation of in vivo clot deposition with the flow characteristics in the 50 cc Penn State artificial heart: a preliminary study. ASAIO J. 2004;50(6):537–42. doi: 10.1097/01.mat.0000145694.40637.a0. [DOI] [PubMed] [Google Scholar]
- 11.Nanna JC, Navitsky MA, Topper SR, Deutsch S, Manning KB. A fluid dynamics study in a 50 cc pulsatile ventricular assist device: influence of heart rate variability. J Biomech Eng. 2011;133(10):101002. doi: 10.1115/1.4005001. [DOI] [PMC free article] [PubMed] [Google Scholar]
- 12.Navitsky MA, Deutsch S, Manning KB. A thrombus susceptibility comparison of two pulsatile Penn State 50cc left ventricular assist device designs. Ann Biomed Eng. 2013;41(1):4–16. doi: 10.1007/s10439-012-0627-z. [DOI] [PMC free article] [PubMed] [Google Scholar]
- 13.Hochareon P, Manning KB, Fontaine AA, Tarbell JM, Deutsch S. Wall shear-rate estimation within the 50cc Penn State artificial heart using particle image velocimetry. J Biomech Eng. 2004;126:430–437. doi: 10.1115/1.1784477. [DOI] [PubMed] [Google Scholar]
- 14.Hubbell JA, McIntire LV. Visualization and analysis of mural thrombogenesis on collagen, polyurethane and nylon. Biomaterials. 1986;7:354–63. doi: 10.1016/0142-9612(86)90006-2. [DOI] [PubMed] [Google Scholar]
- 15.Kreider J, Manning KB, Oley LA, Fontaine AA, Deutsch S. The 50cc Penn State LVAD: a parametric study of valve orientation flow dynamics. ASAIO J. 2006;52:123–131. doi: 10.1097/01.mat.0000199750.89636.77. [DOI] [PubMed] [Google Scholar]
- 16.Nanna JC, Wivholm JA, Deutsch S, Manning KB. Flow field study comparing design iterations of a 50 cc left ventricular assist device. ASAIO J. 2011;57(5):349–357. doi: 10.1097/MAT.0b013e318224e20b. [DOI] [PMC free article] [PubMed] [Google Scholar]
- 17.Medvitz RB, Kreider JW, Manning KB, Fontaine AA, Deutsch S, Paterson EG. Development and validation of a computational fluid dynamics methodology for simulation of pulsatile left ventricular assist devices. ASAIO J. 2007;53(2):122–131. doi: 10.1097/MAT.0b013e31802f37dd. [DOI] [PubMed] [Google Scholar]
- 18.Medvitz RB, Reddy V, Deutsch S, Manning KB, Paterson EG. Validation of a CFD methodology for positive displacement LVAD analysis using PIV data. J Biomech Eng. 2009;131(10):111009. doi: 10.1115/1.4000116. [DOI] [PMC free article] [PubMed] [Google Scholar]
- 19.Rosenberg G, Phillips WM, Landis DL, Pierce WS. Design and evaluation of the Pennsylvania State University mock circulatory system. ASAIO J. 1981;4:41–49. [Google Scholar]
- 20.Long JA, Undar A, Manning KB, Deutsch S. Viscoelasticity of pediatric blood and its implications of the testing of a pulsatile pediatric blood pump. ASAIO J. 2005;51:63–566. doi: 10.1097/01.mat.0000180353.12963.f2. [DOI] [PubMed] [Google Scholar]
- 21.Crowe CT, Sommerfeld M, Tsuji Y. Multiphase Flows with Droplets and Particles. Boca Raton, FL: CRC Press; 1998. [Google Scholar]
- 22.Cooper BT, Roszelle BN, Long TC, Deutsch S, Manning KB. The 12 cc Penn State pulsatile pediatric ventricular assist device: fluid dynamics associated with valve selection. J Biomech Eng. 2008;130(4):041019. doi: 10.1115/1.2939342. [DOI] [PubMed] [Google Scholar]
- 23.Roszelle B. PhD thesis. The Pennsylvania State University; 2010. The 12 cc Penn State pediatric ventricular assist device: a flow visualization study of bridge-to-recovery and weaning. [Google Scholar]
- 24.Balasubramanian V, Slack SM. The effect of fluid shear and co-adsorbed proteins on the stability of immobilized fibrinogen and subsequent platelet interactions. J Biomater Sci Polym Ed. 2002;13:543–561. doi: 10.1163/15685620260178391. [DOI] [PubMed] [Google Scholar]
- 25.Milner KR, Snyder AJ, Siedlecki CA. Sub-micron texturing for reducing platelet adhesion to polyurethane biomaterials. J Biomed Mater ResA. 2006;76A(3):561–570. doi: 10.1002/jbm.a.30554. [DOI] [PubMed] [Google Scholar]
- 26.Jen CJ, Li H-M, Wang J-S, Chen H, Usami S. Flow-induced detachment of adherent platelets from fibrinogen-coated surface. Am J Physiol. 1996;270 :H160–H166. doi: 10.1152/ajpheart.1996.270.1.H160. Heart Circ Physiol 39. [DOI] [PubMed] [Google Scholar]
- 27.Kim J, Ryu G, Shin I, Lee K, Han D, Kim Y, Min B. Effect of shear rates on protein adsorption in the total artificial heart. ASAIO J. 1992;38:M532–M535. doi: 10.1097/00002480-199207000-00092. [DOI] [PubMed] [Google Scholar]