Abstract
Histone modifications are important markers of function and chromatin state, yet the DNA sequence elements that direct them to specific genomic locations are poorly understood. Here, we identify hundreds of quantitative trait loci, genome-wide, that affect histone modification or RNA polymerase II (Pol II) occupancy in Yoruba lymphoblastoid cell lines (LCLs). In many cases, the same variant is associated with quantitative changes in multiple histone marks and Pol II, as well as in deoxyribonuclease I sensitivity and nucleosome positioning. Transcription factor binding site polymorphisms are correlated overall with differences in local histone modification, and we identify specific transcription factors whose binding leads to histone modification in LCLs. Furthermore, variants that affect chromatin at distal regulatory sites frequently also direct changes in chromatin and gene expression at associated promoters.
Variation at noncoding regulatory sequences contributes to the genetics of complex traits (1–3), yet we still have limited understanding of the primary mechanisms by which they act. One possibility is that regulatory variants affect histone modifications that have downstream consequences on chromatin remodeling or transcription (4). There are many possible post-translational modifications of histones (i.e., “histone marks”) (4), and sets of these co-occur in distinct chromatin states (5–9), are associated with functional elements (2, 10, 11), and are sensitive indicators of changes in gene regulation (9, 12). However, we still do not know whether histone modifications are generally a cause or a consequence of gene regulation or which DNA elements direct cell type–appropriate histone marking (7, 13). Thus, studies of genetic variants that disrupt transcription factor binding sites (TFBSs) may illuminate whether histone modifications enable transcription factor binding or whether the binding of transcription factors results in histone modification.
We performed chromatin immunoprecipitation followed by sequencing (ChIP-seq) for RNA polymerase II (Pol II) and four posttranslational modifications of histone H3 (H3K4me1, H3K4me3, H3K27ac, and H3K27me3) in 10 unrelated Yoruba lymphoblastoid cell lines (LCLs). H3K4me3 (trimethylation of lysine 4) is primarily associated with active promoters; H3K4me1 (mono-methylation of lysine 4) is associated with active chromatin outside of promoters (e.g., enhancers); H3K27ac (acetylation of lysine 27) is associated with both active promoters and enhancers (6, 14); and H3K27me3 (trimethylation of lysine 27) is associated with silencing by the polycomb repressive complex 2 (PRC2) (15, 16). We mapped the ChIP-seq reads to the human genome, controlling for mapping biases introduced by polymorphic sites (17). Comparisons with ENCODE (1) showed consistent distributions of each mark (fig. S1).
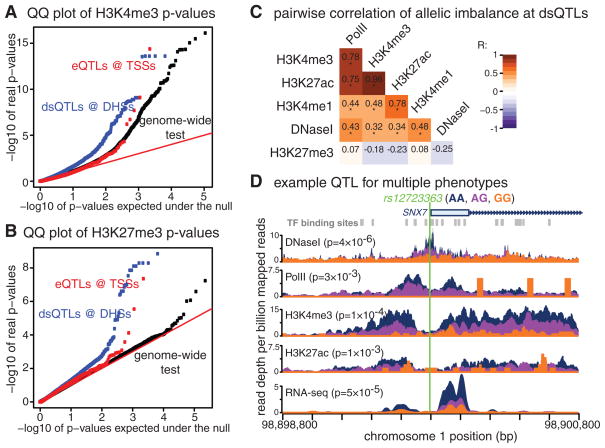
To identify genetic associations with histone marks and Pol II, we developed a “combined haplotype test” that uses both read depth and allelic imbalance to enable mapping of cis–quantitative trait loci (QTLs) with small sample sizes (17). We applied the combined haplotype test to hundreds of thousands of polymorphic sites with sufficient read depth (i.e., sites within ChIP-seq peaks) and identified more than 1200 histone mark and Pol II QTLs at a false discovery rate (FDR) of 20% (Fig. 1, A and B, and fig. S3). After merging overlapping regions, we identified a total of 27 distinct QTLs for H3K4me1, 469 for H3K4me3, 730 for H3K27ac, 118 for Pol II, and 2 for H3K27me3 (which tends not to fall into strong peaks) (table S2). At an FDR threshold of 10%, we identified 582 distinct histone mark and Pol II QTLs (table S2). In principle, some of these signals might be due to imprinting (8) or random allelic inactivation; however, several lines of evidence indicate that most of the regions that we identify are conventional QTLs (supplementary text).
Fig. 1. Identification of histone mark and RNA polymerase II QTLs.
(A) Quantile-quantile plot for H3K4me3 comparing expected to observed −log10 P values from the combined haplotype test. (B) Quantile-quantile plot for H3K27me3. (C) Correlation in allelic imbalance between data types at dsQTLs (*P < 10−3 by likelihood ratio test). (D) An example of a QTL for multiple molecular phenotypes including DNase I sensitivity, gene expression, H3K4me3, H3K27ac, and Pol II levels. The tracks are colored by the genotype of the SNP rs12723363. P values were computed with the combined haplotype test, except for DNase I and RNA-seq, where a linear model (t test) was used.
Many of the histone mark QTLs overlap previously identified QTLs for deoxyribonuclease (DNase I) sensitivity (denoted “dsQTLs”) (18). DNase I sensitivity is an indicator of open chromatin, and DNase I hypersensitive sites (DHSs) typically mark active regulatory regions that are associated with active histone marks and transcription factor binding (19). Indeed, we found an enrichment of low P values when testing for QTL associations with Pol II and all four histone marks at dsQTLs, compared to the genome-wide set of tested single-nucleotide polymorphisms (SNPs) (Fig. 1, A and B, and fig. S3). Nevertheless, although most histone mark and Pol II QTLs are within 1 kb of a DHS (table S5), many are far from known dsQTLs (fig. S8). This suggests that histone modifications may provide more power to detect differences in chromatin state beyond that of DNase I sensitivity.
We plotted aggregate ChIP-seq read depth around DHSs associated with dsQTLs (Fig. 2), grouping read counts according to whether an individual carries the genotype associated with high, medium, or low sensitivity at a dsQTL. Most of the dsQTLs lie outside promoters, and the average histone mark read depths at dsQTL DHSs follow qualitative expectations for distal enhancers (6), with higher levels of H3K4me1 and lower levels of H3K4me3 and Pol II as compared to promoters. High-sensitivity genotypes tend to have reduced nucleosome occupancy within the DHS (20); higher levels of transcription factor binding (18); higher levels of the active marks H3K4me1, H3K4me3, and H3K27ac; and higher Pol II occupancy. The relation between DNase I and the repressive mark H3K27me3 is more complicated, as we find both positive and negative associations. We find no opposite-direction effects between DNase I and either H3K4me1, H3K4me3, or H3K27ac (fig. S5).
Fig. 2. Multiple molecular phenotypes are associated withthe same genetic variants.
Panels show aggregate read depth for molecular traits at DNase I–hypersensitive sites(DHSs)associated with dsQTLs or transcription start sites (TSSs) associated with eQTLs. Reads are grouped into high-, medium-, and low-sensitivity genotypes for dsQTLs and high-, medium-, and low-expression genotypes for eQTLs. Plots were made from half of the significant dsQTLs and eQTLs (those with the lowest P values; n=2787 for dsQTLs; n = 638 for eQTLs).
At expression QTLs (eQTLs) (21), we stratified the samples by the genotype of the most significant eQTL SNP and found overall patterns similar to those at dsQTLs (Fig. 2). Individuals who are homozygous for the high-expression genotype generally have higher levels of DNase I sensitivity, H3K4me3, H3K27ac, and Pol II occupancy at transcription start sites (TSSs). The repressive H3K27me3 mark shows the opposite trend and is highest in the low-expression genotype class.
We estimated the correlation of allele-specific changes across pairs of data types, while accounting for the sampling variance at individual sites (17). The allelic imbalances for features associated with active regions—DNase I, Pol II, H3K4me1, H3K4me3, and H3K27ac—are all highly positively correlated across 2-kb windows centered at dsQTL DHSs (Fig. 1C). In particular, the strong correlation in H3K4me3 and H3K27ac allelic imbalances indicates that these modifications are functionally linked and often depend on the same genetic elements.
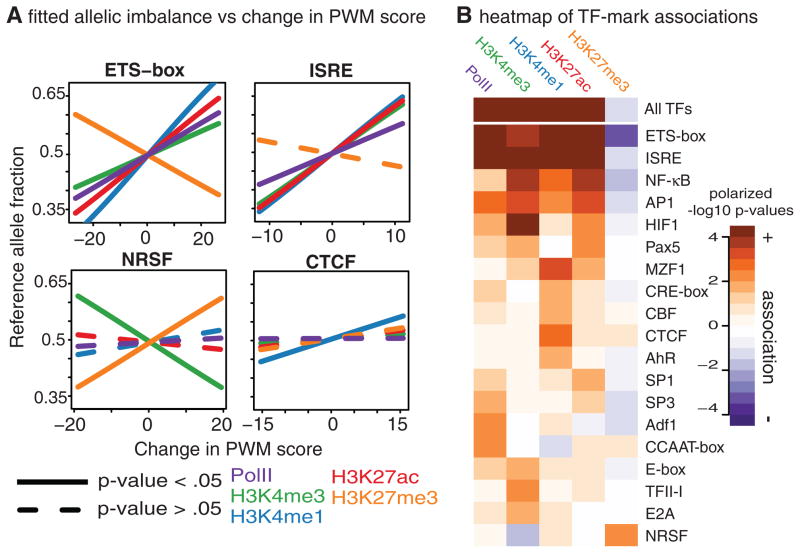
To test the hypothesis that histone modification is directed by sequence-specific transcription factors, we developed a statistical method to evaluate whether polymorphisms in TFBSs are associated with allelic imbalance in histone marks or Pol II (17). This method can infer causation because it is likely that these polymorphisms affect transcription factor binding. We identified 11,437 high-confidence TFBSs (22) that contain sequence polymorphisms in the 10 individuals that we studied. For each TFBS polymorphism, we computed the difference in the transcription factor position weight matrix (PWM) score between the two alleles (ΔPWM) and looked for associations between ΔPWM and allelic imbalance of ChIP-seq reads. The associations are positive and highly significant for the activating histone marks and Pol II [P < 10−5 for all marks by likelihood ratio test (LRT)] and are significantly negative for H3K27me3 (P = 0.028 by LRT; Fig. 3B). As ΔPWM is positively correlated with transcription factor occupancy (18, 23) (fig. S11), these results suggest that increased transcription factor occupancy generally increases levels of nearby activating histone marks and lowers the levels of H3K27me3.
Fig. 3. Polymorphisms in transcription factor binding sites affect local histone modification.
(A) Examples of transcription factor polymorphisms associated with histone marks or Pol II. Each plot shows the estimated relationship between difference in the transcription factor position weight matrix score between alleles (ΔPWM) and allelic imbalance (17). (B) Heatmap showing significance and direction of association between ΔPWM and allelic imbalance of histone marks or Pol II. Only transcription factor clusters with at least one nominally significant association are shown.
To identify specific transcription factors that direct histone marking, we grouped factors into clusters on the basis of sequence motifs and DNase I footprint similarity and tested TFBSs from each cluster for association between ΔPWM and allelic imbalance in the ChIP-seq reads. Out of the 39 clusters that have a sufficient number of polymorphic TFBSs to be testable, 11 have a significant association (FDR = 10% by LRT) with at least one histone mark (Fig. 3B). Most transcription factor clusters have positive associations with activating marks and negative (or nonsignificant) associations with H3K27me3. The transcriptional repressor NRSF (also called REST) is a prominent exception and has a positive association with H3K27me3 (Fig. 3A). NRSF directs PRC2-mediated gene silencing and H3K27me3 deposition during neuronal cell differentiation (24), and our results indicate that this factor may also be important for H3K27me3 deposition in lymphoblasts. These results demonstrate that transcription factor binding is often the first step in a series of events that leads to histone modification, although they do not exclude the possibility that other factors may also have important causal roles.
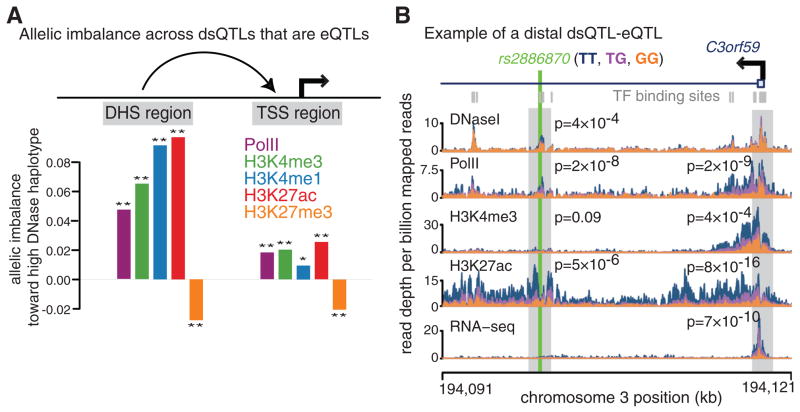
Because dsQTLs are frequently also eQTLs (18), we used dsQTLs that are eQTLs (dsQTL-eQTLs) to assign DHSs to TSSs. We classified dsQTL-eQTLs as “activating” if the high–DNase I sensitivity allele was also the high–gene expression allele, and as “repressing” otherwise (Fig. 4A). We confirmed that most activating dsQTL-eQTLs are true joint associations (as opposed to independent QTLs in linkage disequilibrium), but we discarded the repressive dsQTLs because only a small number had lower P values than expected by chance (fig. S10). We only used dsQTL-eQTLs where the associated DHS was at least 5 kb away from the associated TSS, so the regions are likely to be functionally distinct.
Fig. 4. Histone modification changes at dsQTLs that are also eQTLs.
(A) Estimates of allelic imbalance for histone marks and Pol II across DNase I hypersensitive sites (DHSs; n = 239) and transcription start sites (TSSs; n = 246) from joint dsQTL-eQTLs (17). (*) and (**) indicate that allelic imbalance is significantly different from 0 with P < 0.05 and P < 0.01, respectively (by likelihood ratio test). (B) An example of a dsQTL-eQTL. The SNP rs2886870 disrupts a NF-κB binding site and is significantly associated with local DNase sensitivity, H3K27ac, and Pol II levels. The SNP is also significantly associated with gene expression, H3K27ac, H3K4me3, and Pol II levels at a distal promoter (>18 kb away). P values are from the combined haplotype test, except for DNase I and RNA-seq, where linear regression and t tests were used. Read depth tracks are aggregated and colored by the genotype of rs2886870.
For each dsQTL-eQTL pair, we estimated average allelic imbalance in histone marks and Pol II after polarizing genotypes by DNase I sensitivity at the associated DHS. At activating DHSs, the allelic imbalance is positive (in the same direction as DNase I sensitivity at the DHS) for the three activating histone marks and Pol II and is negative for H3K27me3 (Fig. 4A). The same pattern is present at the associated TSSs, which demonstrates that polymorphisms can jointly affect chromatin state at distal enhancers and at promoters, perhaps via chromatin looping interactions (25). We found that for several of the dsQTL-eQTLs, the SNP that is most significantly associated with DNase I sensitivity is located in a binding site for a known transcription factor (Fig. 4B).
In summary, our study allowed us to link genetic variation in a human population to variation in chromatin state. We identified QTLs associated with histone modification and Pol II binding that are enriched at both dsQTLs and eQTLs, and we found that single genetic variants may affect multiple aspects of chromatin state, including histone modification, DNase I sensitivity, and nucleosome positioning. In some cases, polymorphisms in TFBSs are causally responsible for differences in histone marking, and we have identified several specific transcription factors that are key regulators of histone marking in LCLs, an important step toward understanding how chromatin state is encoded by the genome.
Supplementary Material
Acknowledgments
We thank A. Ruthenberg, B. Howie, and members of the Pritchard, Przeworski, Stephens, and Gilad laboratories for discussions and three anonymous reviewers for comments. This work was supported by grants from the NIH (HG007036, HG006123, GM007197 and MH084703), by an NSF predoctoral award (DGE-0638477 to B.v.d.G.), and by the Howard Hughes Medical Institute. ChIP-seq data have been deposited in the Gene Expression Omnibus (www.ncbi.nlm.nih.gov/geo/) under accession GSE47991. RNA-seq, DNase-seq, and MNase-seq data were previously deposited with accessions GSE19480, GSE31388, and GSE36979. J.K.P. is on the scientific advisory boards for 23andMe and DNANexus with stock options.
Footnotes
References and Notes
- 1.ENCODE Project Consortium. Nature. 2012;489:57–74. doi: 10.1038/nature11247. [DOI] [PMC free article] [PubMed] [Google Scholar]
- 2.Ernst J, et al. Nature. 2011;473:43–49. doi: 10.1038/nature09906. [DOI] [PMC free article] [PubMed] [Google Scholar]
- 3.Schaub MA, Boyle AP, Kundaje A, Batzoglou S, Snyder M. Genome Res. 2012;22:1748–1759. doi: 10.1101/gr.136127.111. [DOI] [PMC free article] [PubMed] [Google Scholar]
- 4.Kouzarides T. Cell. 2007;128:693–705. doi: 10.1016/j.cell.2007.02.005. [DOI] [PubMed] [Google Scholar]
- 5.Bernstein BE, et al. Cell. 2006;125:315–326. doi: 10.1016/j.cell.2006.02.041. [DOI] [PubMed] [Google Scholar]
- 6.Heintzman ND, et al. Nature. 2009;459:108–112. doi: 10.1038/nature07829. [DOI] [PMC free article] [PubMed] [Google Scholar]
- 7.Jenuwein T, Allis CD. Science. 2001;293:1074–1080. doi: 10.1126/science.1063127. [DOI] [PubMed] [Google Scholar]
- 8.Mikkelsen TS, et al. Nature. 2007;448:553–560. doi: 10.1038/nature06008. [DOI] [PMC free article] [PubMed] [Google Scholar]
- 9.Rada-Iglesias A, et al. Nature. 2011;470:279–283. doi: 10.1038/nature09692. [DOI] [PMC free article] [PubMed] [Google Scholar]
- 10.Hoffman MM, et al. Nat Methods. 2012;9:473–476. doi: 10.1038/nmeth.1937. [DOI] [PMC free article] [PubMed] [Google Scholar]
- 11.Kharchenko PV, et al. Nature. 2011;471:480–485. doi: 10.1038/nature09725. [DOI] [PMC free article] [PubMed] [Google Scholar]
- 12.Wamstad JA, et al. Cell. 2012;151:206–220. doi: 10.1016/j.cell.2012.07.035. [DOI] [PMC free article] [PubMed] [Google Scholar]
- 13.Henikoff S, Shilatifard A. Trends Genet. 2011;27:389–396. doi: 10.1016/j.tig.2011.06.006. [DOI] [PubMed] [Google Scholar]
- 14.Barski A, et al. Cell. 2007;129:823–837. doi: 10.1016/j.cell.2007.05.009. [DOI] [PubMed] [Google Scholar]
- 15.Czermin B, et al. Cell. 2002;111:185–196. doi: 10.1016/s0092-8674(02)00975-3. [DOI] [PubMed] [Google Scholar]
- 16.Müller J, et al. Cell. 2002;111:197–208. doi: 10.1016/s0092-8674(02)00976-5. [DOI] [PubMed] [Google Scholar]
- 17.See supplementary materials and methods on Science Online.
- 18.Degner JF, et al. Nature. 2012;482:390–394. doi: 10.1038/nature10808. [DOI] [PMC free article] [PubMed] [Google Scholar]
- 19.Boyle AP, et al. Cell. 2008;132:311–322. doi: 10.1016/j.cell.2007.12.014. [DOI] [PMC free article] [PubMed] [Google Scholar]
- 20.Gaffney DJ, et al. PLOS Genet. 2012;8:e1003036. doi: 10.1371/journal.pgen.1003036. [DOI] [PMC free article] [PubMed] [Google Scholar]
- 21.Pickrell JK, et al. Nature. 2010;464:768–772. doi: 10.1038/nature08872. [DOI] [PMC free article] [PubMed] [Google Scholar]
- 22.Pique-Regi R, et al. Genome Res. 2011;21:447–455. doi: 10.1101/gr.112623.110. [DOI] [PMC free article] [PubMed] [Google Scholar]
- 23.Reddy TE, et al. Genome Res. 2012;22:860–869. doi: 10.1101/gr.131201.111. [DOI] [PMC free article] [PubMed] [Google Scholar]
- 24.Arnold P, et al. Genome Res. 2013;23:60–73. doi: 10.1101/gr.142661.112. [DOI] [PMC free article] [PubMed] [Google Scholar]
- 25.Sanyal A, Lajoie BR, Jain G, Dekker J. Nature. 2012;489:109–113. doi: 10.1038/nature11279. [DOI] [PMC free article] [PubMed] [Google Scholar]
Associated Data
This section collects any data citations, data availability statements, or supplementary materials included in this article.


