

Abstract
Methionine adenosyltransferases (MATs) catalyze the formation of S-adenosyl-L-methionine (SAM) inside living cells. Recently, S-alkyl analogues of SAM have been documented as cofactor surrogates to label novel targets of methyltransferases. However, these chemically synthesized SAM analogues are not suitable for cell-based studies because of their poor membrane permeability. This issue was recently addressed under a cellular setting through a chemoenzymatic strategy to process membrane-permeable S-alkyl analogues of methionine (SAAM) into the SAM analogues with engineered MATs. Here we describe a general, sensitive activity assay for engineered MATs by converting the reaction products into S-alkyl-thioadenosines, followed by HPLC/MS/MS quantification. With this assay, 40 human MAT mutants were evaluated against seven SAAM as potential substrates. The structure-activity-relationship revealed that, besides better engaged SAAM binding by the MAT mutants (lower Km value in contrast to native MATs), the gained activity towards the bulky SAAM stems from their ability to maintain the desired linear SN2 transition state (reflected by higher kcat value). Here the I117A mutant of human MATI was identified as the most active variant for biochemical production of SAM analogues from diverse SAAM.
Keywords: epigenetics, methyltransferase, MAT, S-adenosyl-L-methionine, LC-MS/MS
INTRODUCTION
SAM1, one of the most commonly used enzyme cofactors, is found among all living organisms [1, 2]. The biochemical reactivity of SAM is largely embedded within its three carbon-sulfonium bonds as well as their neighboring regions [2–4]. For instance, the two alkyl sulfonium bonds can undergo enzyme-mediated homolytic cleavage to yield the canonical 5′-deoxyadenosyl or noncanonical 3-amino-3-carboxypropyl radical [5, 6]. In contrast, the methyl sulfonium bond is often subjected to the heterolytic cleavage to render a methyl electrophile for diverse acceptors ranging from large DNA, RNA, and protein complexes to small-molecule metabolites [7]. In conjunction with the increased interest in these transformations, multiple SAM analogues have been documented to probe reactions or mechanisms of SAM-utilizing enzymes including methyltransferases [8–10]. Among the early examples was to replace SAM’s sulfonium moiety with selenium to examine the effect of the weaker carbon chalcogen bond on catalytic turnover [11]. As demonstrated recently by our laboratory and others, bulky sulfonium-β-sp2/sp1-alkyl analogues of SAM can serve as cofactor surrogates of native or engineered methyltransferases for substrate labeling or profiling [9, 12–23].
To access bulky sulfonium-alkyl analogues of SAM, most previous efforts relied on chemical alkylation of S-adenosyl-L-homocysteine (SAH) with the corresponding alkyl electrophiles [12–23]. However, besides the limitation of less desirable yields and requiring laborious HPLC purification [12–23], chemically synthesized SAM analogues often consist of diastereomeric mixtures with only the sulfonium-(S)-epimer bioactive [12–24]. More importantly, SAM analogues generally show poor membrane permeability, which limits their use in a cellular setting [8].
Within living cells, SAM is mainly generated by MATs with endogenous methionine and ATP as substrates; phosphate and pyrophosphate as byproducts (Fig. 1) [2, 16]. An alternative biosynthesis of SAM involves the SalL-catalyzed reverse transformation with methionine and 5′-chloro-5′-deoxyadenosine as substrates [22]. The general in vivo setting of MATs also inspired us to develop a chemoenzymatic strategy with engineered MATs to process membrane-permeable S-alkyl analogues of methionine (SAAM or S-alkyl-L-homocysteines) into the SAM analogues [16]. Despite the previous proof-of-concept use of the engineered MAT in vitro and inside living cells [16], few efforts have been made to characterize systematically these MAT variants, likely because of the lack of a general activity assay for MAT mutants with diverse SAAM as substrates and SAM analogues as products [16, 25–27]. Given the potential use of the chemoenzymatic strategy for multiple SAM-utilizing enzymes, as exemplified recently by methyltransferases [12–23], here we document a sensitive, generally applicable mass-spectroscopy-based assay to quantify SAM analogues (Fig. 2).
Figure 1.
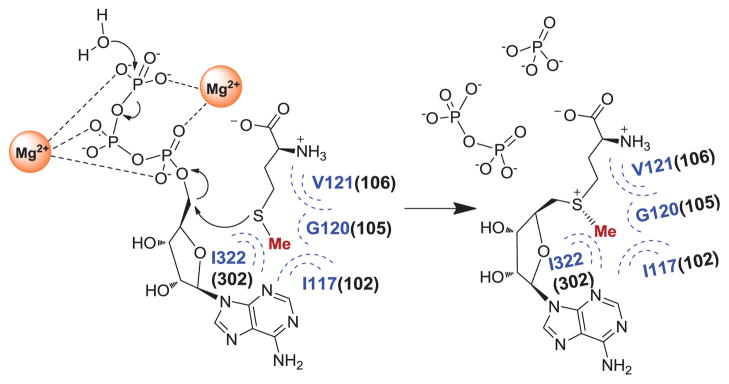
MAT-catalyzed SAM production with methionine and ATP as substrates; phosphate and pyrophosphate as byproducts. Here the residues adjacent to S-methyl moiety of the substrate methionine are constructed and highlighted upon comparing human MATI/II (Blue, PDB 2OBV and 2P02) and E. coli MAT (black in the bracket) as reported previously [29].
Figure 2.

Schematic presentation of MS-based MAT activity assay. In this assay, SAM/SAM analogues were quantitatively converted into the corresponding MTA/MTA analogues and lactone through intramolecular lactonization, followed by tandem HPLC/MS/MS quantification.
The conventional kinetic analysis of MATs was carried out through HPLC-based spectroscopic quantification of the reaction product SAM, a less sensitive assay format that often requires a large amount of reaction materials [25]. Alternatively, less environmentally friendly radiolabeled methionine or ATP can be used as a substrate with the reaction product SAM isolated by chromatography and quantified by a scintillation counter [26]. Recently, a more sensitive spectroscopic MAT assay was developed by monitoring the production of nicotinamide adenine dinucleotide phosphate (NADPH) from the reaction byproduct pyrophosphate using three coupling enzymes: uridine diphosphoglucose pyrophosphorylase, phosphoglucomutase and glucose 6-phosphate dehydrogenase [27]. This continuous assay is sensitive but can be affected by potential cellular components interfering with the coupling enzymes or NADPH readout. Here we described a sensitive mass-spectroscopy(MS)-based assay by converting SAM and S-alkyl analogues of SAM (the reaction products of native and engineered MATs) into S-alkyl thioadenosines for quantification (Fig. 2). This assay is further featured by its potential application to quantify S-alkyl analogues of SAM in complex cellular settings. We implemented the assay to evaluate activities of 40 MAT variants towards 7 SAMM as potential substrates. The structure-activity-relationship revealed that the difference of the overall catalytic efficiency (kcat/Km values) of engineered MATs towards bulky SAAM largely arises from the values of kcat reflected at the chemical step and enzymatic transition state, while the values of Km for binding substrates are comparable among diverse SAAM. This observation argues for the importance of engineering MATs to both bind bulky substrates (the step reflected by small Km values) and efficiently process them into products through active enzymatic transition states (the step reflected by decent kcat value). Here the I117A mutant of human MATI was identified to be the most active MAT variant for biochemical production of sulfonium-alkyl analogues of SAM from diverse SAAM.
EXPERIMENTAL PROCEDURES
General materials and methods
SAM, SAH, L-methionine 1, S-ethyl analogue of methionine (L-ethionine, 2) and the reagents for chemical synthesis were obtained from Aldrich Chemical and used without further purification. Optima grade acetonitrile was obtained from Fisher Scientific and degassed under vacuum prior to HPLC purification. Citrate buffer was purchased from Sigma-Aldrich (Cat. No: 83273). Cocktail of EDTA-free protease inhibitors was purchased from Roche Applied Science. Aqueous solutions of S-alky analogues of methionine (SAAM) were concentrated with a Savant Sc210A SpeedVac Concentrator (Thermo) and then lyophilized with Flexi-Dry™ μP Freeze-Dryer (FTS™ System). Nuclear magnetic resonance spectra (NMR) were recorded on a Burke AVIII 500MHz or 600MHz spectrometer. NMR Chemical shifts are reported in ppm; multiplicity is indicated by s (singlet), d (doublet), t (triplet), q (quartet), m (multiplet), dd (doublet of doublet), etc.; coupling constants (J) are reported in Hz with peak integration provided. Occasionally, formic acid-d2 of 5 μL was added into 600 μL D2O as the NMR solvent to increase the solubility of the compounds containing an α-amino acid moiety. 1H/13C-NMR chemical shifts were referenced to solvent peaks (residual 1H in D2O and DMSO-d6= 4.79 ppm, 3.50 ppm; residual 13C in formic acid-d2 and DMSO-d6=166.2 ppm, 39.7 ppm, respectively). Analytical HPLC was carried out on a Waters 600 Controller HPLC/2998 diode array detector using an XBridge™ Prep C18 5μm 4.6×150mm reverse phase column. Preparative HPLC purification was carried out on a DELTA PAK C18 15μm, 300A 300×3.9 mm column or an XBridge™ Prep C18 5μm OBD™ 19×150mm reverse phase column with UV detection at 260 nm. Mass spectral analysis was carried out at the MSKCC Analytical Core Facility on a PE SCIEX API 100 or Waters Acuity SQD LC-MS with electron spray ionization (ESI). LS-MS samples were analyzed by MRM modes using the 6410 tandem LC-MS/MS system (Agilent Technologies) coupled with a Zorbax Eclipse XDB-C18 column (2.1×50 mm, 3.5μm).
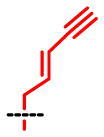
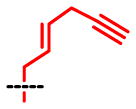
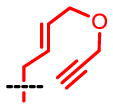
Synthesis, purification and characterization of SAAM 2–8
S-ethyl analogue of methionine (SAAM 2, L-ethionine) is available from Sigma-Aldrich. S-Benzyl-L-homocysteine and S-allyl-L-homocysteine (SAAM 3) were prepared as reported previously [28]. To prepare SAAM 4–8 (Scheme 1), S-benzyl-L-homocysteine (255 mg, 1 mmol) [29] was placed in a round-bottom flask connected to an ammonia cylinder and dissolved in approximately 20 mL condensed liquid ammonia in a dry ice-ethanol bath. Sodium metal (50 mg, 2.2 mmol) was then added gradually to afford a dark blue solution. After the dark blue solution became colorless a few minutes later, the dry ice-ethanol bath was removed to allow the evaporation of ammonia. The remaining trace of ammonia was removed with the aid of a flow of argon, followed by vacuum for 3 h. The resultant white solid was dissolved in dry ethanol (10 mL) and cooled down to 0 °C. A solution of tosylate or bromide (1.05 mmol) in ethanol (3 mL) was added (bromides for the synthesis of SAAM 3, 4, 7 and 8; tosylates for SAAM 5 and 6) [16–19, 21, 22]. This reaction mixture was stirred at 0 °C for 1 h, and then brought to ambient temperature (23 °C) overnight. Solvent was then removed by rotary evaporation and the resultant residue was redissolved in water (5 mL) and purified using a self-packed 1.5×5 cm Dowex 50® (H+) cation exchange column. The column was washed with water until the pH of the eluent became neutral. The products were then eluted from the column using 5% ammonia hydroxide, which was later removed by rotary evaporation. The portions containing the expected products (monitored by silica gel TLC with the eluting solvent, n-BuOH/AcOH/H2O 4:1:1; the staining protocol, 0.2% nihydrin in 96% EtOH/AcOH/s-collidine 6:3:1 upon heating) were combined and concentrated on a rotary evaporator to yield a white solid. The crude products were then dissolved in 0.1 N HCl and subject to further purification with a preparative reversed-phase HPLC (XBridge™ Prep C18 5μm OBD™ 19×150mm). The final products were eluted by a solvent of a linear gradient from 10% to 60 % of acetonitrile in aqueous trifluoroacetic acid (0.1%) for 15 min with a flow rate of 10 mL/min. The desired fractions were combined and lyophilized to yield a white powder (overall yields of 82%, 67%, 56%, 56%, 35% and 58% for SAAM 3, 4, 5, 6, 7 and 9, respectively).
Scheme 1.
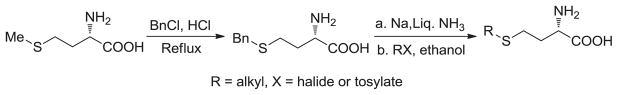
General synthesis of SAAM 3–8.
1H-NMR (500MHz, D2O) of SAAM 3 (S-allyl-L-homocysteine) [28]: δ 2.07–2.20(m, 2H), 2.62(t, 2H, J = 7.5Hz), 3.23(d, 2H, J = 7.2Hz), 3.84(t, 1H, J = 6.3Hz), 5.16–5.22(m, 2H), 5.80–5.88(m, 1H).
1H-NMR (500MHz, D2O) of SAAM 4 (S-crotyl-L-homocysteine): δ 1.71(d, 3H, J = 6.4 Hz), 2.15–2.20(m, 1H), 2.23–2.29(m, 1H), 2.67(t, 2H, d = 7.5Hz), 3.20(d, 2H, J = 7.3Hz), 4.17(t, 1H, J = 6.3Hz), 5.47–5.53(m, 1H), 5.70–5.71(m, 1H); 13C-NMR (125MHz, D2O): δ 16.88, 24.91, 29.45, 32.50, 52.15, 126.04, 129.92, 172.07; ESI-MS: 190 [M+H] +. HRMS: calculated for C8H16NO2S ([M+H]+) 190.0902, found 190.0897.
1H-NMR (500MHz, D2O) of SAAM 5 (trans-pent-2-enyl-L-homocysteine): δ 1.02(t, 3H, J = 7.4 Hz), 2.09–2.13(m, 2H), 2.15–2.19(m, 1H), 2.22–2.23(m, 1H), 2.68(t, 2H, d = 7.3Hz), 3.23(d, 2H, J = 7.2Hz), 4.01(t, 1H, J = 6.2Hz), 5.50–5.54(m, 1H), 5.76–5.79(m, 1H); 13C-NMR (150MHz, D2O): δ 12.81, 24.70, 24.94, 29.70, 32.41, 53.05, 123.73, 136.90, 173.15; ESI-MS: 204 [M+H]+. HRMS: calculated for C9H18NO2S ([M+H]+) 204.1058, found 204.1056.
1H-NMR (500MHz, D2O+formic acid-d2) of SAAM 6 (S-(pent-2-en-4-yny)-L-homocysteine): δ 1.98–2.04(m, 1H), 2.06–2.12(m, 1H), 2.50(t, 2H, J = 7.4Hz), 3.12(d, 2H, J = 7.4Hz), 3.15(s, 1H), 3.99(t, 1H, J = 6.0Hz), 5.50(d, 1H, 15.7Hz), 6.06–6.12(m, 1H); 13C-NMR (125MHz, D2O+formic acid-d2): δ 25.99, 30.15, 33.06, 52.86, 79.09, 82.71, 111.45, 142.06, 172.77; MS(ESI) m/z: 200 [M+H]+; HRMS: calculated for C9H14NO2S ([M+H]+) 200.0745, found 200.0746.
1H-NMR (500MHz, D2O) of SAAM 7 (S-(hex-2-en-5-yny)-L-homocysteine): 2.13–2.19(m, 1H), 2.22–2.28(m, 1H), 2.52(t, 1H, J = 2.4Hz), 2.66(t, 2H, J = 7.5Hz), 3.00–3.02(m, 2H), 3.23(dd, 2H, J = 7.2, 0.7Hz), 4.14(t, 1H, J = 6.3Hz), 5.64–5.70(m, 1H), 5.75–5.81(m, 1H); 13C-NMR (150MHz, D2O+formic acid-d2): δ 21.20, 25.68, 30.14, 32.68, 52.78, 71.94, 83.23, 117.00(q, J = 289.78), 127.90, 128.37, 163.65(q, J = 35.2Hz), 172.76; MS(ESI) m/z: 214 [M+H]+; HRMS: calculated for C10H16NO2S ([M+H]+) 214.0902, found 214.0898.
1H-NMR (500MHz, DMSO-d6) of SAAM 8 (S-[4-(prop-2-ynyloxy)but-2-enylthio]-L-homocysteine): 1.74–1.82(m, 1H), 1.93–1.99(m, 1H), 2.54(t, 1H, J = 7.6Hz), 3.15(d, 2H, J = 5.8Hz), 3.20–3.33(m, 1H), 3.45(d, 1H, J = 2.4Hz), 3.98(d, 2H, J = 4.3Hz), 4.12(d, 2H, J = 2.4Hz),5.64–5.67(m, 2H), 7.54(brs, 2H); 13C-NMR (150MHz, DMSO-d6): δ26.62, 31.06, 32.04, 53.14, 56.53, 68.79, 77.27, 80.32, 128.38, 129.49, 169.15; MS(ESI) m/z: 244 [M+H]+; HRMS: calculated for C11H17NO3NaS ([M+Na]+) 266.0827, found 266.0822.
Protein expression and purification
Human MAT plasmids (full-length MATI and MATII) were generous gift from Dr. Udo Oppermann at University of Oxford (http://www.sgc.ox.ac.uk/structures/MAT1A_2obv.html; http://www.sgc.ox.ac.uk/structures/MM/MAT2AA_2p02_MM.html). To express the N-terminal 6×His MATI and MATII, the plasmids were transformed into the E. coli (DE3) Rosseta 2 strain and induced with 0.5 mM IPTG at 17 °C for 16 h before harvesting. The resultant cell pellets were lysed with a buffer containing 50 mM Tris-HCl (pH=8.0), 50 mM NaCl, 5 mM β-mercaptoethanol, 25 mM imidazole, and the cocktail of Roche protease inhibitors and 5% (v/v) glycerol. The MATI/II proteins were then purified by Ni-NTA agarose resin (Qiagen) followed by a 5-ml HiTrap-Q Sepharose XL column (GE healthcare). The fractions containing MATI/II proteins were combined and concentrated using an Amicon Ultra-10K centrifugal filter device. The protein concentrations were determined with a Bradford assay kit (BioRad) using BSA as a standard. The concentrated proteins were stored at −80 °C before use. The MAT mutants were generated from the native plasmids with QuikChange site-directed mutagenesis kit (Agilent) with the vendor’s protocols. The mutation sites of the plasmids were confirmed by DNA sequencing. All the mutants were expressed and purified as described above for the native MATs.
Conventional HPLC analysis of SAM production by native MATs
A prior HPLC-based MAT activity assay was used to characterize the kinetics of native MATs [25]. This experiment was carried out as an established standard to evaluate the robustness of the newly-developed LC-MS/MS-based assay in the present work. Briefly, the activities of native MATs were measured in 2 mL reaction mixture containing 100 mM Tris-HCl (pH=8.0), 100 mM KCl, 2 mM MgCl2, 8 mM glutathione, 2.5 mM ATP, 7.5 μM MATs, and varied concentrations of methionine (up to 4 mM). The reaction mixture was incubated at ambient temperature (23 °C) with 4-min interval within 20 min (a linear range of initial rates) and then 300 μL reaction aliquot was quenched with 300 μL of 20% HClO4 aqueous solution. After centrifugation at 15,350 × g for 30 min, the supernatants containing SAM were resolved by reverse-phase HPLC using a DELTA PAK C18 column (15 μm, 300 × 3.9 mm) by monitoring UV260 nm. The triethylamine-acetic acid buffer (50 mM, pH=5.0) and methanol were premixed with the ratios of 98:2 (Buffer A) and 50:50 (Buffer B). SAM was eluted with Buffer A for 30 min, followed by Buffer B for 5 min at a flow rate of 1 mL/min. The integrated peak areas at 260 nm were used to generate the standard curve with the known concentration of SAM and quantify the SAM produced in the kinetic assay (ε260=15,400 L.mol−1.cm−1 for SAM’s adenine moiety).
LC-MS/MS-based MAT activity assay for heat map analysis
The reactions of MATs and their mutants were carried out in a reaction mixture containing 50 mM Tris-HCl (pH=8.0), 100 mM KCl, 2 mM MgCl2, 2.5 mM ATP, 7.5 μM native or engineered MATs, and 2.5 mM methionine or SAAM in a final volume of 10 μL. The active mutants were incubated with SAAM in a 96-well plate at ambient temperature (23 °C) for 8–10 h. The long incubation time, although saturating the signals of more reactive substrate-enzyme pairs, allowed maximizing the signals of less active substrate-enzyme pairs (96-well PCR plates sealed with adhesive PRC sealing foil sheets should be used to avoid potential evaporation in particular for the latter step involved with heating). Subsequently, 1.0 μL of 1.0 M citrate buffer was added into the reaction mixture, followed by incubation at 55 °C for 3.5 h to convert the SAM/SAM analogues into the corresponding MTA(5′-methylthioadenosine)/MTA analogues. This degradation procedure was reported previously to give a consistent yield around 80% from SAM to MTA through intramolecular lactonization [30]. The reaction mixture was then diluted by 1:100 ratio with double-distilled H2O containing a known amount of SAH as the internal reference for MS analysis. Then 2 μL of the diluted reaction mixture was injected into the 6410 tandem LC-MS/MS system for quantitative analysis. As a result, the dilution factor of “110” was applied here upon calculating the concentrations of SAM/SAM analogues as described below.
The integrated peak areas for the MTA/MTA analogues and the SAH standards were quantified by the corresponding MRM modes using the 6410 tandem LC-MS/MS system (Agilent Technologies). Prior to the MS analysis, the sample was applied to a Zorbax Eclipse XDB-C18 column (2.1×50 mm, 3.5μm) for LC separation using a gradient elution system with buffer A (0.1% HCOOH in double-distilled H2O) and buffer B (CH3CN) of the following gradient: 0–0.5 min 5%–30% B, 0.5–5 min 30% B, 5–7 min 30%–5% B. Integrated peak areas for all MTA/MTA analogues were compared with those of exogenously-added SAH standards (see Fig. S1 as an example). Here SAM/SAM analogues in the enzymatic reactions were quantified on the basis of the relative peak ratios to the known amount of SAH rather than the absolute peak areas of MTA/MTA analogues (see below for details), a procedure that was implemented to avoid potential errors from the multiple-step operation.
Prior to quantification of the SAM/SAM analogues, a standard curve was generated by applying known concentrations of SAM/SAM analogues and equal concentrations of SAH (after the step of 1:100 dilution) under the conditions described above. The ratios of the peak areas between the SAH standard and the resultant MTA/MTA analogues were calculated to give the “correction factors” (see Fig. S1 as an example). The concentrations of SAM/SAM analogues in the chemoenzymatic reactions were then quantified from the converted MTA/MTA analogues according to the following equation: [SAM]reaction = (Peak area of MTA/MTA analogues)/(Peak area of SAH) × [SAH]standard × “correction factor” × “dilution factor”. Here [SAM]reaction is the concentration of SAM or SAM analogues generated in the enzymatic reaction; (Peak area of MTA/MTA analogues)/(Peak area of SAH) is the peak ratio obtained by the corresponding MRM MS; [SAH]standard is the concentration of internal SAH standard added in the step of the 1:100 dilution; the “correction factor” was obtained as described from the standard curves generated with known concentrations of SAM and SAM analogues; the “dilution factor” is “110” upon counting the 1:10 dilution with 1.0 M citrate buffer and the subsequent 1:100 dilution with double-distilled H2O as described above.
Characterization of kinetics of native and engineered MATs
To determine the apparent kcat and Km values of native MATI/II and their mutants with methionine or SAAM as substrates, the assays were carried out as described above (the LC-MS/MS-based MAT assay) except that 100 μL reaction mixture containing SAM or SAAM (up to 4 mM) was used and linear initial velocities were measured within 20 min with 4-min interval for native MATs with methionine as a substrate or within 60 min with 10-min interval for engineered MATs with SAAM as substrates. The steady state kinetic parameters were obtained upon fitting the initial velocities (the production of SAM or SAM analogues versus the reaction time) against the concentrations of methionine or SAAM with Graphpad Prism 5 software according to the standard Michaelis-Menten equation (v = kcat×[S]/(Km +[S]).
RESULTS AND DISCUSSION
Selection of SAAM and engineered MATs
To evaluate systematically the substrate specificity of MAT variants, we prepared SAAM 2–8 featured by their varied S-alkyl substituents (Scheme 1). The less sterically-hindered S-ethyl analogue of methionine (SAAM 2) was reported previously to be an active substrate of native MATs (yeast and rat), producing the corresponding S-ethyl analogue of SAM [31, 32]. Using a similar synthetic method [28], SAAM 3, 4 and 5 were obtained (Experimental Procedure and Supporting Information). In addition, bulkier SAAM 6, 7 and 8 were also synthesized given that the corresponding SAM analogues have been reported as SAM surrogates for multiple native or engineered methyltransferases [17, 19–21]. Briefly, the treatment of methionine with benzyl chloride in concentrated HCl furnished S-benzyl-L-homocysteine [29]. Its benzyl moiety was then removed by sodium metal in liquid ammonia. The resultant sodium thiolate was readily reacted with the corresponding alkyl tosylates or bromides in dry ethanol to afford SAAM 3–8 (Experimental Procedure). The general synthetic strategy for SAAM 3–8 is featured by the use of the common precursor S-benzyl-L-homocysteine (Scheme 1). The collection of methionine derivatives contains characteristic S-β-vinyl substituents (e.g. 3–8) and terminal alkyne moiety (e.g. 6–8). The former is essential for the efficient transalkylation from the corresponding SAM analogues, while the latter, after transalkylation to the targets, is amenable to copper-catalyzed azide-alkyne Huisgen cycloaddition (the click reaction) with azide-containing probes for further characterization of the labeled targets [9, 17, 21, 23, 33].
To identify and characterize potential MAT variants that can act on SAAM 2–8, we focused on the two isoforms of human MATs (MATI and MATII), whose primary sequences are conserved across species with liver-specific and ubiquitous localization (Fig. 3A), respectively [34]. Upon aligning the MAT sequences of different species, we can profile a cluster of conserved residues that account for binding the methyl moiety of the substrate methinione (I117, C120, V121, S247, I322 for human MATI, PDB 2OBV and I117, G120, V121, S247, I322 for human MATII, PDB 2P02) (Fig. 1, 3A) [16]. To expand this region to accommodate bulky SAAM for enzyme catalysis, we systematically replaced these residues with less-sterically-hindered hydrophobic amino acids individually (e.g. Ala or Gly) or in combination. Here a collection of 40 MAT mutants was expressed and purified for further characterization.
Figure 3.

Sequence alignment of MATs and reactivity heat map of MATI/II variants against SAAM as substrates. (A) Sequence alignment of human and rat MATs. Highlighted are the conserved residues (I117, C120, V121, S247 and I322 of human MATs), which account for binding the methyl moiety of the substrate methinione on the basis of the structures of human MATI/II (PDB 2OBV and 2P02). (B–C) Native and MATI/II mutants were screened against SAAM 2–8 in a combinatorial manner. The results for MATI variants (B) and MATII variants (C) were presented in a heat map format. The amount of the produced SAM analogues was normalized to that of the ethyl-SAM produced by the corresponding I117A mutants.
Development of a sensitive, generally applicable LC-MS/MS-based activity assay for MATs with SAAM as substrates
To measure the activity of native MATs, many prior approaches relied on HPLC to separate and quantify SAM via its characteristic UV absorbance at 260 nm (ε260=15,400 L.mol−1.cm−1 for SAM’s adenine moiety)[25]. However, given the inherent instability of SAM (many SAM analogues as well) and the low sensitivity of UV detection [18, 19], we envisioned a more robust assay (Fig. 2) through the quantitative conversion of the reaction product SAM (or SAM analogues) to MTA (or the corresponding S-alkylthioadenosines for SAM analogues) (55 °C in citrate buffer for 3.5 h as implemented before for MTA synthesis, see Experimental Procedure and Supporting Information) [30]. After the acidic degradation in a 96-well format, followed by centrifugation and adding SAH as an internal standard, the reaction mixture was then analyzed by tandem HPLC-mass/mass spectrometry (HPLC-MS/MS). The amount of SAM (5 μM ~ 1 mM in a 10 μL reaction mixture) is linearly converted to MTA as quantified by HPLC-MS/MS (data now shown). The LC-MS/MS-based assay was further validated upon comparing its kinetic data with those generated by the conventional HPLC-based MAT assay (see results below).
The newly-developed LC-MS/MS-based activity assay for MATs is highly sensitive and generally applicable. Under the current assay setting, we were able to process a 2% aliquant of a 10 μL reaction sample (after 1:100 dilution) for the MS analysis and detected as little as 0.1 pmol MTA (equivalent to 2% aliquant of 5 μM SAM in a 10 μL reaction mixture as described above). Such sensitivity is three orders of magnitude higher than that of the conventional HPLC-coupled UV spectroscopy method, which typically requires a 300 μL reaction mixture for each time point [21, 25]. The LC-MS/MS-based assay format is convenient in comparison with the conventional MAT assay using radioactive ATP or methionine [26], which is sensitive but has to deal with expensive and less environmentally friendly materials. Our LC-MS/MS-based MAT activity is also generally applicable to engineered MATs with diverse SAAM as substrates, because the daughter ions of the corresponding S-alkylthioadenosines can be readily selected with the readily altered MS/MS detection mode (see Experimental Procedure above and the results below). In addition, our LC-MS/MS-based MAT activity assay was designed in a mix-then-measure format and to handle a small volume of reaction samples (10 μL in the current format), which can be further improved and adapted by automatic liquid dispensers into a high throughput format. In terms of sensitivity and general application, our MAT activity assay is comparable to a newly-reported spectroscopic MAT assay, which quantifies the enzyme-coupled production of NADPH from the reaction byproduct pyrophosphate [27]. However, the latter assay is not tolerant to the presence of interfering metabolites (e.g. pyrophosphate and glucose 6-phosphate) and thus is not suitable for evaluating native or engineered MATs in complex cellular settings. In contrast, the LC-MS/MS-based MAT activity can be implemented to examine native or engineered MATs under cellular settings by selectively monitoring the ions of interests (see Experimental Procedure). Admittedly, the current LC-MS/MS MAT assay requires the access to a specialized LC-MS/MS instrument, which might not be generally available. It remains to be determined whether the current assay format can be adapted for other HPLC-MS instruments.
Identification of MAT variants recognizing SAAM as substrates
After validating the MS-based activity MAT assay, we applied it to screen the MAT mutants against SAAM 2–8 in the presence of a physiologically relevant concentration of ATP (2.5 mM) [35]. As displayed in the heat map, the I117A variants of both MATI and MATII demonstrated broad substrate specificity and high efficiency in processing the SAAM as substrates (Fig. 3B,C). Among the examined mutant-substrate pairs, most of the MAT mutants showed detectable activity with the less sterically-hindered S-ethyl analogue of methionine 2 as a substrate (Fig. 3B,C). Such wide substrate specificity dropped dramatically from SAAM 3, 4 to SAAM 5. In particular, many MAT mutants displayed barely detectable ability to process bulkier methionine analogues such as SAAM 6, 7 and 8. However, among the MAT mutants, the two I117A variants still showed relatively higher efficiency to act on all the examined SAAM (Fig. 3B,C). Given that the native MATs show barely detectable activity toward SAAM 6–8 (Fig. 3B,C), mutating I117 is thus essential for MATs to gain the ability to recognize these bulky SAAM.
Kinetic analysis of native and I117A MATs
Since the I117A mutants of MATI and MATII are most effective in processing SAAM 2–8, we implemented the above-established LC-MS/MS MAT activity assay to characterize their kinetics (Fig. 4, S8, Table 1, S1). Apparent kinetic parameters obtained for native MATI/II and methionine using the newly-developed assay are consistent with those obtained using the conventional HPLC-based MAT assay except that much more materials had to be used in the latter assay [25]. This consistency thus validated the robustness of the current LC-MS/MS-based MAT assay for the current application (Fig. 4, S8, Table 1, S1). Consistent with the heat-map comparison (Fig. 3B,C), the catalytic turnover (kcat values) of native MATI and MATII dropped approximately 50-fold with SAAM 2 and was barely measurable for the bulkier SAAM 3–8. Although kcat values of the I117A variants of MATI and MATII are 5-fold lower than those of native MATI and MATII toward methionine, the I117A mutants showed comparable kcat values between methionine and SAAM 2 (<2-fold decrease of its kcat value). The broad substrate specificity of the MAT I117A variants is further maintained for the bulkier SAAM 3–5 and 7 (3~7-fold difference in their kcat values from 2). For the I117A variants, the SAAM 6 and 8, which respectively contain the sterically rigid alkynyl-trans-vinyl moiety and the bulkiest propargyl-oxy-trans-butenyl moiety, are the least reactive substrates as shown by their 30~100-fold decrease of kcat values in contrast to methionine 1 and SAAM 2.
Figure 4.

Representative Michaelis-Menten kinetics of methionine analogues paired with MATI variants (A) and MATII variants (B) Here kcat=11.5 min−1, Km=0.73 mM for native MATI with methionine 1 as substrate; kcat=1.9 ± 0.1, 2.1 ± 0.2, 0.59 ± 0.6 min−1, Km=1.0 ± 0.2, 2.0 ± 0.5, 1.4 ± 0.4 mM for MATI I117A with methionine 1, SAAM 2 and SAAM 7 as substrates, respectively; kcat=8.8 ± 0.6 min−1, Km=0.6 ± 0.1 mM for native MATII with methionine 1 as substrate; kcat=1.9 ± 0.1, 1.1 ± 0.1, 0.62 ± 0.05 min−1, Km=1.8 ± 0.3, 1.0 ± 0.4, 2.5 ± 0.4 mM for MATII I117A with methionine 1, SAAM 2 and SAAM 7 as substrates, respectively. See Fig. S8 for the complete set of kinetic data.
Table 1.
Relative kcat and Km values of native MATI/II and their I117A variants with methionine 1 or SAAM 2–8.a
|

|

|

|
|
|
|
|
|
|---|---|---|---|---|---|---|---|---|
| SAAM | 1 | 2 | 3 | 4 | 5 | 6 | 7 | 8 |
|
Native MATI |
kcat = 1.0 Km = 1.0 kcat/Km = 1.0 |
kcat = 0.017 Km = 2.3 kcat/Km = 0.0070 |
ND | ND | ND | ND | ND | ND |
|
MATI I117A |
kcat = 0.17 Km = 1.4 kcat/Km = 0.12 |
kcat = 0.18 Km = 2.8 kcat/Km = 0.064 |
kcat = 0.052 Km = 1.2 kcat/Km = 0.042 |
kcat = 0.060 Km = 0.58 kcat/Km = 0.11 |
kcat = 0.024 Km = 1.0 kcat/Km = 0.024 |
kcat = 0.010 Km = 0.81 kcat/Km = 0.013 |
kcat = 0.051 Km = 1.9 kcat/Km = 0.027 |
kcat = 0.0065 Km = 5.1 kcat/Km = 0.0013 |
|
Native MATII |
kcat = 1.0 Km = 1.0 kcat/Km = 1.0 |
kcat = 0.015 Km = 1.7 kcat/Km = 0.0081 |
ND | ND | ND | ND | ND | ND |
|
MATII I117A |
kcat = 0.22 Km = 3.0 kcat/Km = 0.074 |
kcat = 0.12 Km = 1.7 kcat/Km = 0.070 |
kcat = 0.034 Km = 0.80 kcat/Km = 0.042 |
kcat = 0.062 Km = 8.5 kcat/Km = 0.0074 |
kcat = 0.033 Km = 5.3 kcat/Km = 0.0063 |
kcat = 0.0025 Km = 10 kcat/Km = 0.00025 |
kcat = 0.071 Km = 4.3 kcat/Km = 0.016 |
kcat = 0.011 Km = 4.5 kcat/Km = 0.0024 |
Apparent kinetic parameters (kcat and Km values) were obtained in the presence of 2.5 mM ATP and varied concentrations of SAAM as substrates. The relative kinetic parameters were obtained by dividing their kcat and Km values with those of the I117A variants. Here kcat=11.5 ± 0.7 min−1, Km=0.7 ± 0.1 mM for native MATI and methionine; kcat=8.8 ± 0.6 min−1, Km=0.6 ± 0.1 mM for native MATII and methionine. The kinetic parameters of native MATs with methionine were validated by the conventional HPLC assay (Fig. S9). See Fig. 4 for Michaelis-Menten curves of the representative SAAM-mutant pairs; ND: Not Detectable. See Table S1 for the complete set of kinetic data with error bars.
Despite up to 100-fold variation of the kcat values of native MATI/II and their I117A variants with methionine and SAAM as substrates, the corresponding Km values are within the 2~3-fold difference for the same set of SAAM. Upon comparing the overall catalysis efficiency (kcat/Km values), methionine 1 and most SAAM (2–7 but not 8) are suitable substrates of the I117A variant of MATI (with 10-fold difference of the kcat/Km values for 2–7). In contrast, the kcat/Km values of the I117A variant of MATII is more substrate-dependent with the higher preference for SAAM 1–4 and 7 than for 5, 6 and 8 (< 5-fold versus 30~100 drop of their kcat/Km values). Among the SAAM containing terminal-alkyne amenable to the click reaction (6–8), SAAM 7 is the most reactive substrate for both MATI and MATII I117A variants with slight preference for the former (<2-fold difference of the kcat/Km values between the two variants; 2~100 difference of the kcat/Km values between 7 and 6 or 8).
Relevant steady-state parameters of engineered MATs with bulky SAAM as substrates
The methionine-binding pocket of native human MATI/II appears not to be spacious enough to accommodate bulky SAAM as reflected by the significant decrease or complete loss of enzymatic activities toward the bulky SAAM 2–8. In contrast, removal of several bulky amino acids (e.g. I117, C120, V121, S247, and I332 in Fig. 3) adjacent to the S-methyl binding site of the substrate methionine readily expands the binding pocket to accommodate these bulky SAAM (Fig. 3). The slight variation of Km values (<10-fold) of the most active MATI/II I117A mutants for the SAAM (Km values in Table 1) further argues that these MATI/II variants gain comparable affinity to the structurally diverse SAAM as substrates. This result is remarkable given the small decrease of the size from Ile to Ala versus the significant increase of size from methionine to SAAM 8. Here we also noticed that the heat maps for SAAM agree well between native MATI/II, their I117A mutants but not their I117V mutants (Fig. 3B). The striking gain-of-function activities of certain MATI/II mutants towards SAAM and the difference for others (e.g. I117V) could be attributed to specific conformational changes associated with each variant. However, more structural characterization is required to provide a molecular-level rationale about how a single point mutation can lead to such difference among the closely-related MAT variants.
Our data further suggest that the binding of SAAM 2–8, though necessary, is insufficient for the MATI/II I117A mutants to act on these compounds as substrates. In contrast to the <10-fold variation of Km values, which reflects the enzyme-substrate binding along the reaction path, the >100-fold fluctuation of kcat values (Fig. 4, Table 1) plays a more significant role on the overall enzyme catalysis. The MAT-catalyzed adenylation on methionine is expected to go through a linear SN2 transition state with methionine and pyrophosphate as the nucleophile and leaving group, respectively (Fig. 1,5) [36]. Given that a kcat value likely reflects the enzymatic efficiency at this chemical step, the activities of the MATI/II I117A mutants on the SAAM can be ranked as 2 > 3, 4, 5, 7 > 6, 8 according to their respective kcat values. Such a trend features the SAAM containing smaller S-alkyl substituents as the less active substrates (e.g. 2, 7) versus those containing bulky or rigid S-alkyl substituents as more inert substrates (e.g. 6, 8). We argued that this difference likely arises from the ability of the former to maintain the linear SN2 transition state of native MATI/II as reflected by the higher kcat value at the chemical step (Fig. 5). In contrast, the bulkiness or rigidity may restrict the latter from forming an optimized linear SN2 transition state along the reaction path (Fig. 5).
Figure 5.

Expected transition state structures of MAT-catalyzed adenylation. Top panel: the proposed linear SN2 transition state of native MATI/II with methionine and ATP as substrates; Bottom panel: the expected transition states of engineered MATs with methionine analogues and ATP as substrates. The active transition state (left) is featured by its linear SN2 configuration in contrast to the less active enzyme-substrate intermediate (right).
Most active MAT variants with matched SAAM substrates
Upon comparing kcat, Km and kcat/Km values for the panel of substrates (methionine or SAAM), we concluded that the MATI/II I117A mutants have the highest activities toward methionine (Table 1). Here SAAM 7 is only 4-fold less reactive than methionine as the substrate of the MATI/II I117A mutants. This result is consistent with the prior observation that SAAM 7 can be processed by the MATII I117A mutant to produce the corresponding SAM analogue within living cells [16]. The prior work also showed that SAAM 7 is a better substrate of the MATII variant than is SAAM 8 [16]. Such a finding is readily reflected by the 7-fold higher kcat (or kcat/Km) value of SAAM 7 in comparison with SAAM 8. The intracellular concentration of methionine varies from 150–280 pmol/107 cells [37]. In previous work, we showed that the incubation of 1 mM SAAM 7 in combination with methionine depletion in the growth medium is sufficient for the MATII I117A variant to produce the corresponding SAM analogue with its intracellular concentration comparable to that of SAM in a native setting [16]. The comparable kcat, Km and kcat/Km values between SAAM and methionine (4-fold difference for SAAM 7) for the MATI/II I117A variants (Table 1) suggest that complete depletion of methionine may not be necessary for in-cell production of the corresponding SAM analogues.
CONCLUSION
Here we describe a sensitive HPLC/MS/MS-based MAT assay to characterize native and engineered MATs with methionine and SAAM as substrates. In contrast with the several conventional MAT activity assays, which are of low sensitivity and have limited application, our assay is characterized by its high sensitivity and general applicability. With the aid of this robust assay, > 40 MATI/II mutants were screened against SAM and seven SAAM. Here MATI I117A was identified to be the most active MATI variant by acting on structurally diverse SAAM. The relatively constant Km values versus largely altered kcat values of MATI I117A across SAAM 2–8 further argues that, although the MAT variant is able to bind bulky SAAM with comparable affinity as native MATI/II bind methionine, such binding is not sufficient to promote enzymatic catalysis. The most reactive substrates such as 3 and 7 for the MATI/II I117A variants may be featured by their ready formation of the active SN2 transition state. In contrast, the less reactive substrates such as 6 and 8 cannot be processed because of the potential disruption of the enzyme transition states by their structurally-rigid or sterically-hindered S-alkyl substituents. These results collectively argue that the flexibility and size of S-alkyl substituents are important parameters for SAAM to be recognized as substrates by the engineered MATs. More importantly, the current work enabled us to identify the I117A variant of MATI as a more general MAT variant to process SAAM into corresponding SAM analogues.
As the primary biological methyl donor, SAM plays a pivotal role under a variety of physiological settings. For instance, protein methyltransferases (PMTs), which transfer the methyl group from SAM to the specific Lys or Arg residues of substrates, are essential for epigenetic regulation [12, 13]. Given the potential utility of the terminal-alkyne-containing SAM analogues to label substrates of methyltransferases [12, 13, 16–18], the revealed structure-activity-relationship of MAT variants and SAAM can provide further guidance to couple two sets of enzymes for more efficient substrate labeling inside living cells. The high sensitivity and robustness of the current MS-based MAT assay also permits the analysis of the corresponding metabolites in cell lysates.
Supplementary Material
Acknowledgments
We thank Dr. Islam for providing several SAAM, Dr. Oppermann for MAT plasmids and Dr. Taldone for developing the HPLC/MS/MS method, Ian Bothwell for comments on the manuscript, and the financial supports from NIGMS (1R01GM096056), the NIH Director’s New Innovator Award Program (1DP2-OD007335), March of Dimes Foundation (Basil O’connor Starter Scholar Award), Starr Cancer Consortium, and the Alfred W. Bressler Scholars Endowment Fund.
Footnotes
Abbreviations used: HPLC: high-performance liquid chromatography
HPLC/MS/MS or LC-MS/MS: high-performance liquid chromatography-mass/mass spectrometry
MAT: methionine adenosyltransferase
MTA: 5′-methylthioadenosine
NADPH: nicotinamide adenine dinucleotide phosphate
SAH: S-adenosyl-L-homocysteine
SAM: S-adenosyl-L-methionine
SAAM: S-alkyl analogue(s) of methionine (S-alkyl-L-homocysteines)
Supporting Information. Fig. S1 (HPLC-MS/MS trace), Fig. S2–S7 (1H- and 13C-NMR spectra), Fig. S8 (kinetic data), and Table S1 (PCR primers).
Publisher's Disclaimer: This is a PDF file of an unedited manuscript that has been accepted for publication. As a service to our customers we are providing this early version of the manuscript. The manuscript will undergo copyediting, typesetting, and review of the resulting proof before it is published in its final citable form. Please note that during the production process errors may be discovered which could affect the content, and all legal disclaimers that apply to the journal pertain.
References
- 1.Klimasauskas S, Weinhold E. A new tool for biotechnology: AdoMet-dependent methyltransferases. Trends Biotechnol. 2007;25:99–104. doi: 10.1016/j.tibtech.2007.01.006. [DOI] [PubMed] [Google Scholar]
- 2.Lu SC. S-Adenosylmethionine. Int J Biochem Cell Biol. 2000;32:391–395. doi: 10.1016/s1357-2725(99)00139-9. [DOI] [PubMed] [Google Scholar]
- 3.Kim J, Xiao H, Bonanno JB, Kalyanaraman C, Brown S, Tang X, Al-Obaidi NF, Patskovsky Y, Babbitt PC, Jacobson MP, Lee YS, Almo SC. Structure-guided discovery of the metabolite carboxy-SAM that modulates tRNA function. Nature. 2013;498:123–126. doi: 10.1038/nature12180. [DOI] [PMC free article] [PubMed] [Google Scholar]
- 4.Landgraf BJ, Booker SJ. Biochemistry: the ylide has landed. Nature. 2013;498:45–47. doi: 10.1038/nature12247. [DOI] [PMC free article] [PubMed] [Google Scholar]
- 5.Yan F, LaMarre JM, Röhrich R, Wiesner J, Jomaa H, Mankin AS, Fujimori DG. RlmN and Cfr are radical SAM enzymes involved in methylation of ribosomal RNA. J Am Chem Soc. 2010;132:3953–3964. doi: 10.1021/ja910850y. [DOI] [PMC free article] [PubMed] [Google Scholar]
- 6.Zhang Y, Zhu X, Torelli AT, Lee M, Dzikovski B, Koralewski RM, Wang E, Freed J, Krebs C, Ealick SE, Lin H. Diphthamide biosynthesis requires an organic radical generated by an iron-sulphur enzyme. Nature. 2010;465:891–896. doi: 10.1038/nature09138. [DOI] [PMC free article] [PubMed] [Google Scholar]
- 7.Struck AW, Thompson ML, Wong LS, Micklefield J. S-adenosyl-L-methionine-dependent methyltransferases: highly versatile enzymes in biocatalysis, biosynthesis and other biotechnological applications. Chembiochem. 2012;13:2642–2655. doi: 10.1002/cbic.201200556. [DOI] [PubMed] [Google Scholar]
- 8.Lin Q, Jiang F, Schultz PG, Gray NS. Design of allele-specific protein methyltransferase inhibitors. J Am Chem Soc. 2001;123:11608–11613. doi: 10.1021/ja011423j. [DOI] [PubMed] [Google Scholar]
- 9.Peters W, Willnow S, Duisken M, Kleine H, Macherey T, Duncan KE, Litchfield DW, Lüscher B, Weinhold E. Enzymatic site-specific functionalization of protein methyltransferase substrates with alkynes for click labeling. Angew Chem Int Ed. 2010;49:5170–5173. doi: 10.1002/anie.201001240. [DOI] [PubMed] [Google Scholar]
- 10.Li J, Wei H, Zhou MM. Structure-guided design of a methyl donor cofactor that controls a viral histone H3 lysine 27 methyltransferase activity. J Med Chem. 2011;54:7734–7738. doi: 10.1021/jm201000j. [DOI] [PMC free article] [PubMed] [Google Scholar]
- 11.Iwig DF, Grippe AT, McIntyre TA, Booker SJ. Isotope and elemental effects indicate a rate-limiting methyl transfer as the initial step in the reaction catalyzed by Escherichia coli cyclopropane fatty acid synthase. Biochemistry. 2004;43:13510–13524. doi: 10.1021/bi048692h. [DOI] [PubMed] [Google Scholar]
- 12.Wang R, Luo M. A journey toward Bioorthogonal Profiling of Protein Methylation inside living cells. Curr Opin Chem Biol. 2013:729–731. doi: 10.1016/j.cbpa.2013.08.007. [DOI] [PMC free article] [PubMed] [Google Scholar]
- 13.Luo M. Current chemical biology approaches to interrogate protein methyltransferases. ACS Chem Biol. 2012;7:443–463. doi: 10.1021/cb200519y. [DOI] [PMC free article] [PubMed] [Google Scholar]
- 14.Winter JM, Chiou G, Bothwell GIR, Xu W, Garg NK, Luo M, Tang Y. Expanding the structural diversity of polyketides by exploring the cofactor tolerance of an inline methyltransferase domain. Org Lett. 2013;15:3774–3777. doi: 10.1021/ol401723h. [DOI] [PMC free article] [PubMed] [Google Scholar]
- 15.Islam K, Chen Y, Wu H, Bothwell IR, Blum GJ, Zeng H, Dong A, Zheng W, Min J, Deng H, Luo M. Defining efficient enzyme–cofactor pairs for bioorthogonal profiling of protein methylation. Proc Natl Acad Sci USA. 2013;110:16778–16783. doi: 10.1073/pnas.1216365110. [DOI] [PMC free article] [PubMed] [Google Scholar]
- 16.Wang R, Islam K, Liu Y, Zheng W, Tang H, Lailler N, Blum G, Deng H, Luo M. Profiling genome-wide chromatin methylation with engineered posttranslation apparatus within living cells. J Am Chem Soc. 2013;135:1048–1056. doi: 10.1021/ja309412s. [DOI] [PMC free article] [PubMed] [Google Scholar]
- 17.Islam K, Bothwell I, Chen Y, Sengelaub C, Wang R, Deng H, Luo M. Bioorthogonal Profiling of Protein Methylation using azido derivative of S-adenosyl-L-methionine. J Am Chem Soc. 2012;134:5909–5915. doi: 10.1021/ja2118333. [DOI] [PMC free article] [PubMed] [Google Scholar]
- 18.Bothwell IR, Islam K, Chen Y, Zheng W, Blum G, Deng H, Luo M. Se-Adenosyl-L-selenomethionine cofactor analogue as a reporter of protein methylation. J Am Chem Soc. 2012;134:14905–14912. doi: 10.1021/ja304782r. [DOI] [PMC free article] [PubMed] [Google Scholar]
- 19.Islam K, Zheng W, Yu H, Deng H, Luo M. Expanding cofactor repertoire of protein lysine methyltransferase for substrate labeling. ACS Chem Biol. 2011;6:679–684. doi: 10.1021/cb2000567. [DOI] [PMC free article] [PubMed] [Google Scholar]
- 20.Wang R, Ibáñez G, Islam K, Zheng W, Blum G, Sengelaub C, Luo M. Formulating a fluorogenic assay to evaluate S-adenosyl-L-methionine analogues as protein methyltransferase cofactors. Mol Biosyst. 2011;7:2970–2981. doi: 10.1039/c1mb05230f. [DOI] [PMC free article] [PubMed] [Google Scholar]
- 21.Wang R, Zheng W, Yu H, Deng H, Luo M. Labeling substrates of protein arginine methyltransferase with engineered enzymes and matched S-adenosyl-L-methionine analogues. J Am Chem Soc. 2011;133:7648–7651. doi: 10.1021/ja2006719. [DOI] [PMC free article] [PubMed] [Google Scholar]
- 22.Lipson JM, Thomsen M, Moore BS, Clausen RP, La Clair JJ, Burkart MD. A tandem chemoenzymatic methylation by S-adenosyl-L-methionine. Chembiochem. 2013;14:950–953. doi: 10.1002/cbic.201300221. [DOI] [PMC free article] [PubMed] [Google Scholar]
- 23.Dalhoff C, Lukinavicius G, Klimasăuskas S, Weinhold E. Direct transfer of extended groups from synthetic cofactors by DNA methyltransferases. Nat Chem Biol. 2006;2:31–32. doi: 10.1038/nchembio754. [DOI] [PubMed] [Google Scholar]
- 24.Cantoni G. The nature of the active methyl donor formed enzymatically from L-methionine and adenosinephosphate. J Am Chem Soc. 1952;74:2942–2943. [Google Scholar]
- 25.Kamarthapu V, Rao KV, Srinivas PN, Reddy GB, Reddy VD. Structural and kinetic properties of Bacillus subtilis S-adenosylmethionine synthetase expressed in Escherichia coli. Biochim Biophys Acta. 2008;1784:1949–1958. doi: 10.1016/j.bbapap.2008.06.006. [DOI] [PubMed] [Google Scholar]
- 26.Markham GD, Hafner EW, Tabor CW, Tabor H. S-Adenosylmethionine synthetasefrom Escherichia coli. J Biol Chem. 1980;255:9082–9092. [PubMed] [Google Scholar]
- 27.Zano SP, Bhansali P, Luniwal A, Viola RE. Alternative substrates selective for S-adenosylmethionine synthetases from pathogenic bacteria. Arch Biochem Biophys. 2013;536:64–71. doi: 10.1016/j.abb.2013.05.008. [DOI] [PMC free article] [PubMed] [Google Scholar]
- 28.Jiracek J, Collinsova M, Rosenberg I, Budesinsky M, Protivinska E, Netusilova H, Garrow TA. S-alkylated homocysteine derivatives: new inhibitors of human betaine-homocysteine S-methyltransferase. J Med Chem. 2006;49:3982–3989. doi: 10.1021/jm050885v. [DOI] [PMC free article] [PubMed] [Google Scholar]
- 29.Peric Simov B, Wuggenig F, Mereiter K, Andres H, France J, Schnelli P, Hammerschmidt F. Direct chemical synthesis of chiral methanol of 98% ee and its conversion to [(2)H1,(3)H]methyl tosylate and [(2)H1,(3)H-methyl]methionine. J Am Chem Soc. 2005;127:13934–13940. doi: 10.1021/ja051568g. [DOI] [PubMed] [Google Scholar]
- 30.Gutierrez JA, Luo M, Singh V, Li L, Brown RL, Norris GE, Evans GB, Furneaux RH, Tyler PC, Painter GF, Lenz DH, Schramm VL. Picomolar inhibitors as transition-state probes of 5′-methylthioadenosine nucleosidases. ACS Chem Biol. 2007;2:725–734. doi: 10.1021/cb700166z. [DOI] [PubMed] [Google Scholar]
- 31.Alix JH. Molecular aspects of the in vivo and in vitro effects of ethionine, an analog of methionine. Microbiol Rev. 1982;46:281–295. doi: 10.1128/mr.46.3.281-295.1982. [DOI] [PMC free article] [PubMed] [Google Scholar]
- 32.Leopold WR, Miller JA, Miller EC. Comparison of some carcinogenic, mutagenic, and biochemical properties of S-vinylhomocysteine and ethionine. Cancer Res. 1982;42:4364–4374. [PubMed] [Google Scholar]
- 33.Blum G, Bothwell IR, Islam K, Luo M. Profiling protein methylation with cofactor analog containing terminal alkyne functionality. Curr Protoc Chem Biol. 2013:67–88. doi: 10.1002/9780470559277.ch120241. [DOI] [PMC free article] [PubMed] [Google Scholar]
- 34.Mato JM, Alvarez L, Ortiz P, Pajares MA. S-adenosylmethionine synthesis: molecular mechanisms and clinical implications. Pharmacol Ther. 1997;73:265–280. doi: 10.1016/s0163-7258(96)00197-0. [DOI] [PubMed] [Google Scholar]
- 35.Gribble FM, Loussouarn G, Tucker SJ, Zhao C, Nichols CG, Ashcroft FM. A novel method for measurement of submembrane ATP concentration. J Biol Chem. 2000;275:30046–30049. doi: 10.1074/jbc.M001010200. [DOI] [PubMed] [Google Scholar]
- 36.Markham GD, Takusagawa F, Dijulio AM, Bock CW. An investigation of the catalytic mechanism of S-adenosylmethionine synthetase by QM/MM calculations. Arch Biochem Biophys. 2009;492:82–92. doi: 10.1016/j.abb.2009.08.010. [DOI] [PMC free article] [PubMed] [Google Scholar]
- 37.Carmel R, Jacobsen DW. Homocysteine in health and disease. Cambridge University Press; 2001. [Google Scholar]
Associated Data
This section collects any data citations, data availability statements, or supplementary materials included in this article.