

Abstract
Large-scale analysis of cellular response to anti-cancer drugs typically focuses on variation in potency (IC50) assuming that it is the most important difference between effective/ineffective drugs or sensitive/resistant cells. We took a multi-parametric approach involving analysis of the slope of the dose-response curve (HS), the area under the curve (AUC) and the maximum effect (Emax). We found that some of these parameters vary systematically with cell line and others with drug class. For cell-cycle inhibitors, Emax often but not always correlated with cell proliferation rate. For drugs targeting the Akt/PI3K/mTOR pathway dose-response curves were unusually shallow. Classical pharmacology has no ready explanation for this phenomenon but single-cell analysis showed that it correlated with significant and heritable cell-to-cell variability in the extent of target inhibition. We conclude that parameters other than potency should be considered in the comparative analysis of drug response, particularly at clinically relevant concentrations near and above IC50.
INTRODUCTION
Patient-to-patient variability in drug response is a primary challenge facing development and use of new medicines 1. A recent approach to understanding such variability involves genotyping coupled with systematic measurement of dose-response across a large and diverse bank (“encyclopedia”) of cell lines 2–8. In the case of anti-cancer drugs that block cell proliferation or induce apoptosis 9, the concentration of drug is usually varied over a 104 to 105-fold range and viability measured after 72–96 hr. Such data is conventionally analyzed from the perspective of IC50 values (or similar parameters), which are descriptive of the shape of the dose-response curve at its mid-point. However, inspection of dose-response curves reveals that they differ substantially in shape from one drug to the next and from one cell line to the next. Variability in shape can be quantified by performing a multi-parametric analysis using a conventional logistical sigmoidal function:
| (1) |
where y is a response measure at dose D (typically the experimental data), E0 and Einf are the top and bottom asymptotes of the response; EC50 is the concentration at half-maximal effect; and HS is a slope parameter analogous to the Hill coefficient 10–12 (Fig. 1a). Three values derived from equation (1) are in common use: IC50, the concentration of drug at which response is half its theoretical maximum (i.e. y = 0.5); Emax, the value of y at the maximum drug concentration tested, and the area under the dose-response curve (AUC). Although not strictly parameters of equation (1) we refer to Emax, IC50 and AUC as “parameters” for simplicity. EC50 and IC50 are the classic measures of drug potency and Emax and Einf are measures of drug efficacy (for anti-cancer drugs Emax varies between 1 at low doses and 0 at high dose, which corresponds to death of all cells). AUC combines potency and efficacy of a drug into a single parameter. AUC values can be compared for a single drug across multiple cell lines exposed to the same range of drug concentrations but comparison of different drugs is problematic (because the scaling between drugs and dose ranges is generally arbitrary). In the simple case of second-order competitive inhibition, the case considered in most pharmacology textbooks, E0 = 1, Emax = Einf = 0, EC50 = IC50 and HS = 1 (denoted by the red dash line in Fig. 1a).
Figure 1.

Diversity of anti-cancer compounds with respect to variation in dose-response parameters across a panel of breast cell lines. (a) Schematic of key dose-response parameters (EC50, IC50, Einf, Emax and AUC) calculated following curve fitting to the cell survival data. The pink area represents area under the curve (AUC). The red dash line represents the simple case of E0 = 1, Emax = Einf = 0, EC50 = IC50 and HS = 1. Effects of variations in EC50, slope (HS), and Einf on the shape of dose-response curve are shown on the right; see text for details of parameters and logistic equation. (b) Schematic of key dose-response parameters (GI50, TGI) that can be calculated by fitting logistic curves to data on relative cell growth comprising a change in cell number after drug treatment normalized to the change in cell number in an untreated control well. (c) The range of dose-response parameters, IC50 (a measure of potency), Emax (a measure of efficacy), and Hill slope (HS) estimated for all 64 compounds across all the 53 breast cell lines represented by box and whisker plots drawn and median parameter values and inter-quartile ranges; bars extending to 1.5-times the inter-quartile range are shown for each drug as a measure of variance. Parameter values for outlier cell lines are denoted by stars. Compounds are sorted based on the median IC50 value. Drug targets are nominal and do not include off-target effects.
The focus to data on potency 2–4, 6–8, 13 ignores the potential impact and biological significance of variation in other parameters such as the steepness of the dose-response curve or differences in maximum effect (although one recent large-scale study did compute Emax and AUC 5). In this paper we showed that different dose-response parameters encode distinct information; some parameters varied systematically with cell line and others with drug. For example, HS and Emax were frequently uncorrelated with each other or with GI50 but the parameters varied in a consistent way within a drug class. Because the origins of systematic variation in HS and Emax are poorly understood, we performed single-cell analysis of Akt/PI3K/mTOR inhibitors and found that cell-to-cell variability is one explanation for shallow dose-response relationships. Thus, multi-parametric analysis yields insight into understudied aspects of drug response that are particularly important near and above the IC50 value, a concentration range relevant to human patients.
RESULTS
Dose-response parameters vary with compound and cell line
We focused on analysis of previously published data comprising CellTiter-Glo measurement of per-well ATP levels (a metric of metabolically active cells) 14 for 64 anti-cancer drugs (Supplementary Results, Supplementary Table 1) and 53 well-characterized breast cell lines 3. Assays were performed before and three days after exposure to drugs at nine doses spanning a ~105-fold range (with maximum doses between 0.5 μM and 20 mM depending on potency 3). We computed viability as y = N/NC where the cell number N was measured in the presence of drug and NC in a no-drug control. Since the number of cells present prior to the start of the experiment was available (N0) we also computed y* = (N − N0)/(NC − N0) to yield the GI50 value for y* = 0.5 (Fig. 1b). We confirmed key findings using independent dose-response data released through the Cancer Cell Line Project (for which estimates of N0 are not available) 4.
Multi-parametric analysis yielded values for EC50, IC50, GI50, HS (Hill slope), Einf, Emax and AUC for 2789 drug/cell line combinations (Supplementary Data Set 1; http://lincs.hms.harvard.edu/db/datasets/20120; see Methods for data filtering) and revealed substantial differences from one drug and cell line to the next (Fig. 1c). For example, across cell lines, IC50 varied ~104-fold and Emax from 0–0.8 for the microtubule stabilizer docetaxel and HSP90 inhibitor geldanamycin (Fig. 2a,b) whereas IC50 varied little for the CDK4/cyclin D1 kinase inhibitor fascaplysin (ca. 10-fold) and maximum effect was high in all cases (Emax ~ 0; Fig. 2c). In the case of the PI3K inhibitor GSK2126458, Hill slope was ~1.0, whereas it varied significantly for the polyamine analogue CGC-11144 (Fig. 2d,e).
Figure 2.
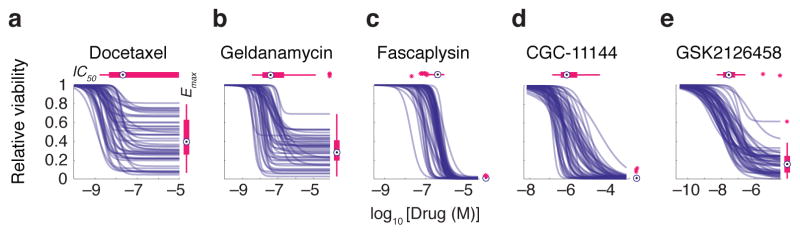
Selected examples of dose-response curves representing different types of variation in dose-response relationships. Patterns of dose-response across the breast cell line panel for (a) docetaxel, a microtubule stabilizer, (b) geldanamycin, an HSP90 inhibitor, (c) fascaplysin, a CDK4 inhibitor, (d) CGC-11144, a polyamine analogue, and (e) GSK2126458, a PI3K inhibitor are shown. These drugs are highlighted in red in Fig. 1c. The range of IC50 and Emax values is represented by box and whisker plots drawn and median parameter values and inter-quartile ranges shown above and to the right; bars extending to 1.5-times the inter-quartile range are shown for each drug as a measure of variance. Parameter values for outlier cell lines are denoted by stars.
Association of maximal effect parameters with cell type
We observed that potency, maximal effect and slope were well-correlated only for a subset of drugs and cell lines (Fig. 3a and Supplementary Fig. 1). For example, whereas IC50 and Emax correlated in the case of geldanamycin they did not for the PI3K inhibitor GSK1059615 (Fig. 3b,c). IC50 and Emax were generally more highly correlated than GI50 and Emax (e.g. for the Src/Abl inhibitor bosutinib: P = 10−11 vs. P = 0.03; Fig. 3d–f). Thus, parameters we might assume to be interchangeable (e.g. IC50 and GI50) were not, implying that different dose-response parameters convey different information. To quantify this we computed the mutual information (MI) 15 between parameter values and either cell or drug type. MI is an information theoretic metric that reveals how informative one variable (e.g. IC50 or Emax) is about a second variable (e.g. drug identity or cell type). For example, an MI score of 0 bits for a parameter-drug pair means that they are independent whereas a score of 1 bit means pairs can be divided into 21 = 2 groups having either a low or a high parameter value; similarly, a score of 1.6 bits implies division into 21.6 ≈ 3 groups. We estimated the probabilities of observing different values of each dose-response parameter for all compounds and cell lines and used MI P values as a statistical measure of significance (this is necessary because non-zero MI values are expected by chance for randomly permuted data). We computed empirical P values by randomly shuffling the dose-response data (n = 10,000) across all cell lines and drugs (see Methods for details).
Figure 3.

Different dose-response parameters do not always correlate with each other. (a) Pairwise correlation between different key dose-response parameters estimated for each drug across the breast cancer cell line collection. P values were corrected using the Bonferroni-Holm method. A complete view of panel (a) including drug names corresponding to each drug index is presented in Supplementary Fig. 1. Correlation coefficient values and corrected P values are presented in Supplementary Data Set 3. (b, c) Pairwise distribution and correlation of Emax and IC50 for geldanamycin (an HSP90 inhibitor) and GSK1059615 (a PI3K inhibitor). (d–f) Pairwise distribution and correlation of Emax, IC50 and GI50 for bosutinib (a Src/Abl inhibitor) across the cell line panel. Each circle represents a cell line. Colors represent different drugs.
Parameters quantifying maximum effect (Emax and Einf) exhibited strong association (P < 10−4) with cell type. For example, all but three drugs exhibited an equal or higher value for Emax in SKBR3 cells than in SUM159PT cells (Fig. 4a). IC50 had a weaker association (P = ~0.05) with cell type and EC50 and HS had no significant association (Supplementary Table 2). Prevailing “fractional kill” theory 16, 17 posits that inhibitors of cell-cycle progression (such as paclitaxel) kill only the subset of cells that pass through S or M phases in the presence of drug. Consistent with this, SKBR3 had a substantially longer doubling time than SUM159PT cells (~50 vs. ~20 hr, and thus lower mitotic and S phase fractions) under the growth conditions used in this study. When we calculated the correlation between dose-response parameters and cell doubling time for all 64 drugs, we observed a strong positive correlation between Emax or IC50 and doubling time, particularly in the case of DNA damaging agents and microtubule stabilizers (Fig. 4b and Supplementary Fig. 2). However, when we excluded nominally cell-cycle specific drugs from the analysis (see Supplementary Fig. 2 for details) the association between cell line and both Emax and Einf was still statistically significant (P = ~0.02), albeit weaker. Moreover, drugs not classically considered to be inhibitors of cell cycle processes exhibited Emax values that correlated with proliferation rate; in the case of bortezemib the correlation might reflect the role of the proteasome in degradation of cyclins, p21 and p27 18–20, etc. but this is less obvious in the case of drugs such as the HSP90 inhibitor geldanamycin. Also unexpected was the observation that Emax values for some cell-cycle inhibitors did not correlate with proliferation rate. For example, the CDK4 inhibitor fascaplysin, CDC25 inhibitor NSC663284, and DNA cross-linking agents cisplatin, carboplatin and oxaliplatin all exhibited Emax ~ 0 in most cell lines and any variation was independent of proliferation rate.
Figure 4.

Association of dose-response parameters with cell type, drug type and drug class. (a) An example showing that two cell lines (SUM159PT and SKBR3) are distinguishable by Emax values with SUM159PT cells having lower values for all but three compounds. Significance of difference between the Emax values for the two cell lines was evaluated by a P value based on nonparametric Wilcoxon signed rank test. (b) Correlation between different dose-response parameters estimated for the set of anti-cancer compounds and the doubling times across the breast cell lines. Drugs are grouped in two groups: cell cycle phase-specific and –nonspecific drugs. See Supplementary Fig. 2 for the complete list of drugs in each group. The percentage of drugs within each group that exhibit significant correlation (P < 0.05) between doubling time and parameters Emax and IC50 is shown. P values were corrected using the Benjamini-Hochberg method. Correlation coefficient values and corresponding P values are presented in Supplementary Data Set 4. (c–e) Three examples of anti-cancer drugs that are distinguishable based on dose-response parameter values across the breast cell line panel as discovered by mutual information analysis. The Significance of differences between drugs was evaluated by P values based on nonparametric Wilcoxon signed rank test. (f) Variation of Emax and Hill slope for different classes of drugs defined based on target or mechanism of action across the breast cell lines. Significance of differences between drug classes was evaluated by P values based on nonparametric Mann-Whitney U test and corrected using Bonferroni-Holm method.
Association of Emax and Hill slope with drug class
We observed a strong association (P < 10−4) between drug type and potency, efficacy and steepness of the dose-response relationships (Supplementary Table 2) meaning that virtually all pairs of drugs could be distinguished based on cell-line dependent variation in one or more parameters. For example, the parameters IC50, Emax and HS allowed high confidence (P = 10−9 to 10−6) discrimination between the pairs of drugs (i) oxamflatin and vorinostat (two HDAC inhibitors), (ii) MG-132 (a proteasome inhibitor) and 17-AAG (an HSP90 inhibitor) and (iii) GSK1059615 (a PI3K inhibitor) and trichostatin A (an HDAC inhibitor) (Fig. 4c–e). Distinguishability by IC50 is intuitively obvious and arises when the affinity of a drug for its target is greater than that of a second drug for its target, making the first compound universally more potent.
To better understand distinguishability by parameters other than potency, we grouped drugs into classes based on nominal target or mechanism of action (ignoring potential secondary targets and poly-pharmacology). We subjected dose-response data for different drug classes to principal component analysis (PCA; Supplementary Fig. 3) so as to rotate the data into a new principal component space in which relationships between dose-response parameters and target could be visualized (independent of cell line). We found that drugs from the same class usually clustered together (Supplementary Fig. 3). For example, HDAC inhibitors, proteasome inhibitors and DNA cross-linking drugs had uniformly high maximal effects (Emax ~ Einf ~ 0) whereas inhibitors of EGFR and HSP90 exhibited large variation in Emax (Fig. 4f). In the case of Hill Slope, mTOR inhibitors exhibited (with a median absolute deviation – MAD – of 0.11) and for pyrimidine analogue or thymidylate synthase (TYMS) inhibitors, (MAD = 0.15). These values were significantly less than one (P < 1×10⁻⁸), whereas values of for HDAC and proteasome inhibitors were significantly greater than one (P < 1×10⁻¹³). Cooperativity is the usual explanation for HS > 1 in classical enzymology and pharmacology, and the steep dose-response curve for proteasome inhibitors is presumed to reflect the presence of seven catalytic subunits in the active enzyme 21. However, situations in which HS < 1 are less commonly considered and neither sequential nor independent binding schemes with negative cooperativity result in HS < 1 22.
We confirmed that Hill slope varied with drug class using the Cancer Cell Line Project dataset which covers 639 human cell lines and 130 drugs 4. The published data comprise concentration values at different fractional effect size (i.e. EC25, EC50, EC75 and EC90) and we therefore approximated HS by the EC25/EC75 ratio (Supplementary Data Set 2). Among the 40 breast cancer lines in this dataset, we found that EGFR inhibitors had significantly higher HS values than PI3K inhibitors (P = 9×10⁻⁶) and PI3K and AKT inhibitors had higher HS values than mTOR inhibitors (P = ~10−5-10−4), whereas HDAC and proteasome inhibitors had significantly higher HS values than all three classes of drugs (P = 10−3 to 10−8); this was also true when we examined all cell lines in the Cancer Cell Line Project dataset (Supplementary Fig. 4). We conclude that Hill slope varies in a consistent way with drug class across multiple datasets.
Cell-to-cell variability and shallow dose-response curves
To investigate how a shallow dose-response curve might arise we focused on drugs inhibiting the PI3K/Akt/mTOR pathway that varied widely in HS and Emax values independent of proliferation rate. As a class, these drugs are undergoing extensive clinical investigation 23 with more than 300 trials in ClinicialTrials.gov. For three compounds with varying HS, we measured target inhibition by immunofluorescence microscopy and cell killing in four breast cell lines (HER2-amplified AU565 and HCC1954 cancer cells, hormone receptor-positive T47D cancer cells, and non-transformed MCF10A cells). We probed the effects of the mTOR inhibitor PP242, PI3K inhibitor GSK1059615, and dual specificity mTOR/PI3K inhibitor dactolisib (BEZ235) 24 hr after drug exposure in 9-point dose-response assays using antibodies specific for p-Akt (Ser473), p-4EBP1 (Thr37/46), and p-S6 (Ser235/236) (Fig. 5a); among these measurements p-4EBP1 is thought to be particularly informative as a downstream marker of Akt/mTOR/PI3K pathway activity 24, 25. We also measured levels of phosphorylated Rb (p-Rb at Ser807/811) as a surrogate for commitment to the cell cycle 26. Immunofluorescence microscopy revealed dose-dependent inhibition of p-Akt, p-4EBP1 and p-S6 (Supplementary Fig. 5) and viability assays performed 72 hr after drug exposure confirmed that HS ≪ 1 for PP242 and dactolisib and HS ~ 1 for GSK1059615 in all cell lines (Supplementary Fig. 6). However, we also observed substantial cell-to-cell variability in phospho-protein staining intensity for cells exposed to the first two drugs (Fig. 5b,c): the coefficient of variation (CV) in p-4EBP1 staining (i.e. the standard deviation of immunofluorescence signal intensity at the single cell level divided by the population-average) rose for cells treated with PP242 or dactolisib near the IC50 but not for GSK1059615, which exhibited a low and constant CV (Fig. 5d). We observed similar results for other cell lines (Supplementary Fig. 7–9). We conclude that a shallow dose-response curve is correlated with high cell-to-cell variability in target inhibition as compared to drugs for which HS ~ 1 (in four of four cell lines tested).
Figure 5.

High cell-to-cell variability is associated with shallow dose-response and suboptimal maximum effect for pharmacological inhibition of mTOR. (a) PI3K/Akt/mTOR pathway and its associated downstream effectors. Highly simplified schematic showing how drug response was assessed by measuring levels of phosphorylated Akt, S6 ribosomal protein, 4EBP1 and Rb on a single-cell level by immunofluorescence microscopy. (b) Dose-dependent inhibition of p-4EBP1 with increasing drug concentrations as illustrated by intensity values on a single-cell basis. (c) Selected immunofluorescence images of p-4EBP1 (green), p-Rb (red) and Hoechst (blue) staining of MCF10A cells in the absence of drug and 24 hr after exposure to 10 μM PP242. (d) The effect of PP242, dactolisib and GSK1059615 on coefficient of variation (CV; the standard deviation for single cell measurements divided by the population-average) of single cell p-4EBP1 levels. Data represent mean values ± s.d. calculated from two replicates per dose of drug. (e) Cells with high p-4EBP1 levels (i.e. cells with p-4EBP1 levels above the population average) 24 hr after exposure to 10 μM PP242 exhibit >10 times higher levels of p-Rb than low-p4EBP1 cells (cells with p-4EBP1 levels below the population average). Median p-Rb signal intensities and inter-quartile ranges, and bars extending to 1.5-times the inter-quartile range are shown. (f) Retreating surviving MCF10A cells (exposed to 10 μM PP242 for 72 hr followed by fresh growth media for 24 hr) with 9 doses of PP242 for 72 hr results in a shallow dose-response curve with similar dose-response parameters as observed for parental cells.
Even at the highest drug concentrations tested (10 μM) a fraction of cells exposed to PP242 but not GSK1059615 retained high p-4EBP1 staining (Fig. 5b,c). The outlier population in PP242-treated cells with high p-4EBP1 staining exhibited ~10-fold higher p-Rb staining (P < 10−50) as compared to the low p-4EBP1 population, implying that outliers were committed to cell proliferation (Fig. 5e). The presence of a subset of cells in which the Akt/mTOR/PI3K pathway is insensitive to inhibition by PP242 or dactolisib is a likely explanation for fractional cell killing by these drugs (Emax > 0). To determine whether these insensitive cells represent a stable subpopulation or whether they interconvert with sensitive cells we exposed cultures to two successive drug treatments. We treated MCF10A cells with PP242 for 72 hr at a concentration (10 μM) sufficient to induce apoptosis or block proliferation in ~80% of cells. We exchanged the medium and allowed viable cells to recover for 24 hr before being exposed a second time to PP242 at a range of 9 doses (1 nM to 10 μM) for 72 hr. When we compared dose-response curves for the parental (drug-naïve) and survivor cell populations (Fig. 5f), IC50 values (~1 μM) and HS < 1 were indistinguishable, showing that drug-sensitive cells can arise rapidly from relatively insensitive cells. Thus fractional response did not reflect the presence of a stable subpopulation of drug-insensitive cells but rather rapid inter-conversion between resistant and sensitive states. Cell-to-cell variability in response to PP242 and the shallow dose-response curve it generates therefore appeared to be stable properties of cell populations.
Variation of cell line responsiveness to each drug class
The value of any single parameter as an effective descriptor of cellular response to a class of drugs should depend on how well the parameter correlates across cell lines. We computed a similarity score for drugs with related nominal targets and treated as significant only those cases in which variation across cell lines was more highly correlated within a drug class than across drugs randomly selected from multiple classes (as scored by P value; see Methods for details, Supplementary Fig. 10). For example, in the case of the HDAC inhibitors vorinostat and LBH589, Emax values had a high similarity score since they varied in a consistent way (as illustrated by MDAMB134VI and T47D cells in Supplementary Fig. 10). For EFGR inhibitors IC50 values were strongly correlated across cell lines (Pearson’s correlation coefficient = 0.90, P < 10−7 for erlotinib and AG1478) but Emax was not correlated (Pearson’s correlation coefficient ~ 0.4, P ~ 0.1). The reasons for these differences are not known but we speculate that erlotinib and AG1478 exert their effects on the same target (EGFR) near their IC50 values but have additional and different targets at high drug concentrations where Emax values become relevant. When comparing drugs we must therefore account for the fact that different parameters are informative for different drug classes.
An alternative way to approach this problem is to determine the ability of a single parameter to accurately describe a full dose-response relationship. We computed the correlation between the response estimated from a single parameter of a conventional logistic curve and the measured response. We performed the analysis across the range of doses for all drugs and cell lines by scoring the P values of the correlation coefficient. We observed that Emax was best correlated with actual response at high doses, IC50 and AUC were best at intermediate doses (near the median IC50 for all cell lines) and EC50 or GI50 were best at low doses (near the IC50 for the most sensitive cell line). This is depicted as continuous plots for 17-AAG, carboplatin and doxorubicin and for the full dataset, as a set of optimal parameters for each dose range (Fig. 6a,b). A priori, we are most interested in analyzing drugs at clinically relevant concentration ranges. We can estimate these ranges from the plasma concentration (Cmax) at the maximal tolerated dose (MTD); in general, effective drugs are ones in which Cmax/IC50 ≫ 1 (Supplementary Table 3). Incorporating this information we saw that, in the clinical range, the most informative parameter varied with drug; for example, AUC for 17-AAG, IC50 for carboplatin and Emax for doxorubicin.
Figure 6.

Different dose-response parameters capture cell line to cell line variation at different dose regimes. (a) Variations of the predictive value (coefficient of Pearson correlation with relative viability) for each of the three key dose-response parameters (IC50, Emax and AUC) with dose for three selected drugs, 17-AAG, carboplatin and doxorubicin. (b) Predictive value of different dose-response parameters for drug sensitivity is a function of the clinical concentration of drug. Dose-response parameters corresponding to the most significant correlation (as evaluated by P value) with cellular response (i.e. relative viability) at doses spanning a range from the most sensitive cell line’s IC50 to the highest tested dose for each drug are shown. For example for the mTOR inhibitor PP242, EC50 (denoted by green bar) is the parameter with the highest correlation with relative viability when cell lines are exposed to drug concentrations around 10−4 times the maximal tested dose (i.e. 10−5×10−4.3 M 0.5 nM). At a 100-fold higher concentration (i.e. 10−3×10−4.3 M ≈ 50 nM), AUC (denoted by red bar) shows the strongest correlation with relative viability.
DISCUSSION
To date, systematic analysis of large scale dose-response data has concentrated on the closely related parameters EC50, IC50 and GI50, thereby making the implicit assumption that potency at the mid-point of the dose response curve is the most important difference between drugs or between sensitive and resistant cells 2–4, 6–8, 13. In this paper, we examined variation in features other than potency such as maximum drug effect (Emax), the slope of the dose-response curve (Hill Slope; HS), and the area under the dose-response curve (AUC). For many drugs, IC50 (or GI50), Emax and HS did not correlate and mutual information (MI) analysis revealed systematic variation with both drug and cell type: in the latter case, differences in cell proliferation rates emerged as a probable explanation, particularly for variation in Emax and drugs that target cell cycle processes. This is consistent with extensive evidence that inhibitors of DNA synthesis or mitotic spindle assembly exert their effects (at least in culture) only when cells transit S or M phase. However, not all cell cycle inhibitors have Emax > 0. For example, inhibitors of cyclin-dependent kinase 4 (CDK4; fascaplysin), CDK phosphatase CDC25 (NSC663284) and the DNA cross-linking agents cisplatin, carboplatin and oxaliplatin had Emax ~ 0 for the vast majority of cell lines tested. Moreover, observed variation in Emax was independent of proliferation rate. Conversely, we observed a significant association between Emax and proliferation rate for drugs that are not typically considered to be cell cycle inhibitors, including the HSP90 inhibitor geldanamycin and the proteasome inhibitor bortezomib (although the latter drug does impact degradation of cyclins and other cell cycle regulators). Further analysis of killing by cell cycle inhibitors whose effects do and do not correlate with proliferation is likely to be informative, particularly in the case of clinically important cytotoxic chemotherapeutics with similar targets.
For drugs that exhibited large variation in multiple, uncorrelated, dose-response parameters, a question arose as to which one is most informative. AUC, a parameter that combines potency and efficacy into a single measure was robust as a response metric when the goal was to compare a single drug across cell lines exposed to identical dose ranges. Other parameters could be used with multiple drugs and concentration ranges but their value varied with dose: Emax was more informative at high than low doses and the opposite was true of IC50 and GI50. With anti-cancer drugs it is typical to aim for a maximum serum dose (Cmax) near the maximum tolerated dose (MTD) and drugs for which Cmax/IC50 ≫ 1 are preferred clinically. During development of a new drug, reducing IC50 is obviously an important goal but when the aim is to understand variability in patient responses to an existing drug our data suggested that it is likely to be more informative to focus on Emax and HS.
In many cases, the origins of variation in dose response parameters remain to be determined. Association with drug class or target is confounded by polypharmacology which almost certainly impacts the shape of dose-response curves at high drug concentrations (particularly with phenotypic measures of response). Future analysis of different compounds having the same nominal target should help resolve this issue. Differences in the physicochemistry of drug/target interaction (e.g. association rate, polar surface area, etc.) are potential source of variation in parameters other than IC50, and it should be possible to tackle this with sophisticated cheminformatic analysis 27, 28. However, in this paper we focused on understanding the origins of fractional maximum effect and shallow dose-response curves.
We found that HS was particularly high for drugs such as proteasome and HDAC inhibitors (e.g. bortezomib and LBH589) whereas inhibitors of the Akt/PI3K/mTOR pathway exhibited low and variable HS, particularly drugs such as PP242, temsirolimus, everolimus and rapamycin. Positive cooperativity provides a framework for understanding steep dose-response relationships (HS > 1) 10, 22 but even negative cooperativity should not result in HS < 1. By comparing the dose-dependent inhibition of proteins in the Akt/PI3K/mTOR pathway following exposure of cells to drugs with HS ~ 1 or HS < 1, we found that shallow dose-response was associated with high cell-to-cell variability in target inhibition. Moreover, when we recovered and expanded cells that were initially insensitive to a drug such as PP242 and then re-assayed drug response several days later, we observed the same shallow dose-response curve and fractional killing at high dose as the original cell population. This implies that HS < 1 is a stable property of a cell population and that states of drug-sensitivity and insensitivity interconvert on the time scale of days. We and others have observed similar effects in receptor-mediated cell death 29, 30, activation of immune response 31, or sensitivity to chemotherapeutic drugs 32 and ascribed it to stochastic fluctuation in the levels or activities of intracellular signaling proteins. In principle, the molecules of a drug target present in any single cell could exhibit a canonical HS = 1 dose-response curve but fluctuation in target level, activity or interaction with other proteins 33 might cause the IC50 value to vary from cell to cell, giving rise to a shallow dose-response curve at the population level.
It is striking that mTOR inhibitors exhibited some of the lowest values for HS and that this pathway is also subject to complex feedback regulation. Importantly, what appear as static differences from one cell to the next in the fixed-timepoint experiments in this paper are likely to arise from temporal fluctuations that are asynchronous across the population. Mutations and non-genetic factors that generate dose-response curves with HS < 1 and Emax > 0 are likely to be important clinically: the incremental therapeutic benefit of getting closer and closer to the maximum tolerated dose will be less for a drug exhibiting a shallow than a steep dose-response curve. Studies on dose-response relationships for antiviral drugs have also concluded that variation in HS is important for assessing drug sensitivity and resistance 21, 34. Attempts to identify new drugs or effective combination therapies might therefore focus on steepening the dose response relationship and increasing maximum effect, not just decreasing IC50.
ONLINE METHODS
Dose response curve fitting
We obtained dose-response curves for the 72 h effect of 64 drugs, including both targeted agents and cytotoxic therapeutics on the viability and growth of 53 breast cell lines using previously published data 3 (http://lincs.hms.harvard.edu/db/datasets/20120). Briefly, we fitted triplicate nine-dose (1:5 serial dilution) data to the logistical sigmoidal model (equation (1); constraints: E0 = 1 and 0 < HS < 4) using nonlinear least squares regression performed in GraphPad Prism 6. We excluded “no response” data defined as data that (i) showed higher statistical quality (based on extra-sum-of-squares F test) when fitted to a constant model (y = Einf) in comparison with the sigmoidal model, or (ii) their sigmoidal fitted curve Hill slopes were < 0.25, from the analysis. We also removed data fitted to the sigmoidal model with R2 < 0.70 from the analysis. Approximately 82% of the 64×53 possible combinations of drug/cell line data passed all filtering requirements and were used in all of the analyses.
We estimated doubling times for cell lines from the ratio of cell numbers at 72 h to 0 h for untreated cells. We estimated different dose-response parameters for each individual curve, including EC50, IC50, GI50, Hill slope (HS), Einf, and Emax. In the case of IC50 and GI50, when the dose-response data were of high quality but IC50 or GI50 values were not reached, we set the values to the largest concentration tested. Additionally, we calculated a parameter AUC representing the area under the relative viability curve, defined as the sum of measured responses (relative viability) at all tested concentrations of the drug. Hence, AUC = 9 corresponds to an inactive compound, whereas smaller AUC values correspond to higher drug activities in inhibiting cell proliferation and/or inducing cell death. When multiple replicates of data on a drug/cell line combination are available, we used medians of the dose-response parameters estimated across replicates for the statistical analysis.
Association of different dose-response parameters with anti-cancer drugs and breast cell lines
We assessed associations of each of the key dose-response parameters, log10 (EC50), log10 (IC50), Hill slope, Emax and Einf, with the set of n = 64 drugs (or n = 38 when excluding cell cycle inhibitors) and the set of m = 53 cell lines using mutual information 15. A rationale for using mutual information is to capture differences not only in the median (or mean) but also in the variance of dose-response parameters across different cell lines and compounds. We discretized each of the dose-response parameters X, into q equally spaced bins where q = floor [log2 (# of samples) + 1] = 12 (or q = 11 when excluding cell cycle inhibitors) 35. We defined matrix N for each individual dose-response parameter so that Ni,j was the number of cell lines whose dose-response parameter values for the ith drug (1 ≤ i ≤ n) lied within the jth bin of Xd, the discretized form of X (1 ≤ j ≤ q). We computed the empirical mutual information between Xd and the drugs as:
| (2) |
where , and . Similarly, we defined matrix M, where Mk,j was the number of drugs whose dose-response parameter values for the kth cell line (1 ≤ k ≤ m) belonged to the jth bin of Xd. The empirical mutual information between Xd and the cell lines was given by:
| (3) |
where , and .
Mutual information scores of zero correspond to independence of the dose-response parameters from the tested drugs and cell lines, whereas larger values imply strong association, indicating that knowing a dose-response parameter value gives significant information about drugs and cell lines to which the parameter is expected to belong. To evaluate the significance of the mutual information scores, we computed empirical mutual information P values by randomly shuffling (10,000 trials) the dose-response parameter values among all the tested cell lines and drugs.
Statistical analysis of drug response profiles
We evaluated differences in values of a dose-response parameter between different drugs or different cell lines by using nonparametric Wilcoxon signed rank test. We evaluated differences in dose-response parameters between different drug classes that might contain different numbers of drugs by using nonparametric Mann-Whitney U test. We corrected P values from the Mann-Whitney U test and Pearson correlation analyses using the Benjamini-Hochberg method 36 for multiple independent comparisons, and the Bonferroni-Holm correction 37 for other comparisons.
To measure the extent of similarity among drug response profiles, we used pairwise Pearson correlation scores by considering for each drug its pattern of dose-response parameter values across the cell lines. We computed Similarity score for a selected group of N drugs (e.g. drugs within a class defined based on drug target or mechanism of action) as the average similarity between all the possible pairs of drugs belonging to the selected group (average correlation), divided by the expected average similarity between all the possible pairs of drugs in a randomly selected set of N drugs. To evaluate the significance of the similarity score for a selected group of N drugs (SS), we computed empirical P values by permutation test; for a number of n = 10,000 trials, we sampled a random set of N drugs from the whole set of 64 drugs and computed the similarity score for that set (SS*). For a given SS ≥ 0 we counted the number of times (r) that SS ≤ SS* across the n permutation trials. We then computed the empirical P value as (r+1)/(n+1).
Principal component analysis
Principal component analysis (PCA) is an efficient way to simplify and present multi-dimensional data into fewer dimensions 38. For example, each drug in our analysis can be described by 53 IC50 values, 53 HS values and 53 Emax values corresponding to the parameters for growth inhibition assays for 53 breast cell lines. Therefore, each drug can be represented by a vector pointing into 53×3 = 159 dimensional space that depicts its effect on the cell line panel. Because it is not possible to visualize 159-dimensional graphs, we used PCA to recognize the 159-dimensional relationships into three primary dimensions (i.e. principal components) that can be plotted on a graph. These principal components are a linear combination of the original dimensions. We organized dose-response parameters into a matrix with 64 rows (corresponding to drugs) and 159 columns (corresponding to dose-response parameters IC50, HS and Emax for all cell lines), took the logarithm of parameters, imputed missing values from the nearest-neighbor row (the closest row in Euclidean distance), normalized each parameter value via calculating the z-score for each parameter across the 64 drugs, and performed PCA. We can discuss the results of PCA in terms of component scores (the transformed variable values corresponding to a particular data-point) and loadings (the weight by which each normalized original variable should be multiplied to get the component score).
Cell lines and reagents
We obtained AU565, HCC1954 and T47D breast cancer cell lines and MCF10A mammary epithelial cells from the American Type Culture Collection (ATCC). We cultured AU565 and HCC1954 cells in RPMI 1640 (ATCC) supplemented with 10% fetal bovine serum (FBS), T47D cells in RPMI 1640 supplemented with 10% FBS and insulin (0.2 U/ml), and MCF10A cells in DMEM/F12 (Invitrogen) supplemented with 5% horse serum, EGF (20 ng/ml), insulin (10 μg/ml), hydrocortisone (0.5 μg/ml), and cholera toxin (100 ng/ml). We added penicillin (50 U/ml) and streptomycin (50 μg/ml) to all growth media.
We purchased dactolisib (BEZ235), GSK1059615 and PP242 from Selleck Chemicals. All compounds were at least 97% pure as evaluated by HPLC and MS analysis. All compounds were dissolved in DMSO as 10 mM stock solutions. For dose-response experiments, we plated cells in 2 replicates at 7,000 cells per well in 96-well plates (Corning) in full growth media for 24 hr and then treated them with 9 doses in serial dilutions (10−10 to 10−5 M) of each compound for 6, 24 and 72 hr.
Immunofluorescence microscopy
Cells were fixed in 2% paraformaldehyde for 10 min at room temperature and washed with PBS with 0.1% Tween 20 (Sigma-Aldrich) (PBS-T), permeabilized in methanol for 10 min at room temperature, rewashed with PBS-T and blocked in Odyssey Blocking Buffer (LI-COR Biosciences) for 1 hr at room temperature. Cells were incubated overnight at 4°C with rabbit monoclonal antibodies to p-Akt (1:400, Ser473, 4060, Cell Signaling Technology), p-4EBP1(1:400, Thr37/46, 2855, Cell Signaling Technology), p-S6 ribosomal protein (1:400, Ser235/236, 4858, Cell Signaling Technology), and a goat polyclonal antibody to p-Rb (1:400, Ser807/811, sc-16670, Santa Cruz) in Odyssey Blocking Buffer. Cells were washed three times in PBS-T and incubated with rabbit and goat secondary antibodies labeled with 647 and 568 Alexa Fluors (Invitrogen), respectively, diluted 1:2,000 in Odyssey Blocking Buffer. Cells were washed once in PBS-T, once in PBS and incubated in 250 ng/ml Hoechst 33342 (Invitrogen) and 1:1,000 Whole Cell Stain (blue; Thermo Scientific) solutions. Cells were then washed twice with PBS and imaged with 10× objective on Operreta (Perkin Elmer). Image segmentation and storage was performed using ImageRail software 39. Data were analyzed using Matlab software. Selected images were RGB-transformed and merged using ImageJ software.
Online databases
Dose-response data (both raw and processed), including estimates of all dose-response parameters used in this study are available online through the Harvard Medical School Library of Integrated Network-based Cellular Signatures (HMS LINCS) database (http://lincs.hms.harvard.edu/db/datasets/20120).
Supplementary Material
Acknowledgments
We thank W. Chen, M. Niepel, M. Hafner, D. Flusberg, T. Mitchison, D. Marks and C. Shamu for help. This work was supported by the NIH LINCS Program grant HG006097 to PKS and by Stand Up to Cancer grant AACR-SU2C-DT0409 to PKS and JWG. MF is a Merck Fellow of the Life Sciences Research Foundation.
Footnotes
AUTHOR CONTRIBUTIONS
MF designed and performed the experiments, analyzed the experimental data, performed statistical analyses and wrote the manuscript. SH designed and performed the experiments and wrote the manuscript. LMH designed and performed the experiments and wrote the manuscript. JWG designed the experiments and wrote the manuscript. PKS designed the experiments and wrote the manuscript.
COMPETING FINANCIAL INTERESTS STATEMENT
The authors declare no financial conflict of interest.
References
- 1.Borden EC, Dowlati A. Phase I trials of targeted anticancer drugs: a need to refocus. Nat Rev Drug Discov. 2012;11:889–890. doi: 10.1038/nrd3909. [DOI] [PubMed] [Google Scholar]
- 2.Sos ML, et al. Predicting drug susceptibility of non-small cell lung cancers based on genetic lesions. J Clin Invest. 2009;119:1727–1740. doi: 10.1172/JCI37127. [DOI] [PMC free article] [PubMed] [Google Scholar]
- 3.Heiser LM, et al. Subtype and pathway specific responses to anticancer compounds in breast cancer. Proc Natl Acad Sci U S A. 2012;109:2724–2729. doi: 10.1073/pnas.1018854108. [DOI] [PMC free article] [PubMed] [Google Scholar]
- 4.Garnett MJ, et al. Systematic identification of genomic markers of drug sensitivity in cancer cells. Nature. 2012;483:570–575. doi: 10.1038/nature11005. [DOI] [PMC free article] [PubMed] [Google Scholar]
- 5.Barretina J, et al. The Cancer Cell Line Encyclopedia enables predictive modelling of anticancer drug sensitivity. Nature. 2012;483:603–607. doi: 10.1038/nature11003. [DOI] [PMC free article] [PubMed] [Google Scholar]
- 6.Greshock J, et al. Molecular target class is predictive of in vitro response profile. Cancer Res. 2010;70:3677–3686. doi: 10.1158/0008-5472.CAN-09-3788. [DOI] [PubMed] [Google Scholar]
- 7.Solit DB, et al. BRAF mutation predicts sensitivity to MEK inhibition. Nature. 2006;439:358–362. doi: 10.1038/nature04304. [DOI] [PMC free article] [PubMed] [Google Scholar]
- 8.Staunton JE, et al. Chemosensitivity prediction by transcriptional profiling. Proc Natl Acad Sci U S A. 2001;98:10787–10792. doi: 10.1073/pnas.191368598. [DOI] [PMC free article] [PubMed] [Google Scholar]
- 9.Tyson DR, Garbett SP, Frick PL, Quaranta V. Fractional proliferation: a method to deconvolve cell population dynamics from single-cell data. Nat Methods. 2012;9:923–928. doi: 10.1038/nmeth.2138. [DOI] [PMC free article] [PubMed] [Google Scholar]
- 10.Hill A. The possible effects of the aggregation of the molecules of haemoglobin on its dissociation curves. J Physiol (Lond) 1910;40 [Google Scholar]
- 11.Chou TC. Derivation and properties of Michaelis-Menten type and Hill type equations for reference ligands. J Theor Biol. 1976;59:253–276. doi: 10.1016/0022-5193(76)90169-7. [DOI] [PubMed] [Google Scholar]
- 12.Holford NH, Sheiner LB. Understanding the dose-effect relationship: clinical application of pharmacokinetic-pharmacodynamic models. Clin Pharmacokinet. 1981;6:429–453. doi: 10.2165/00003088-198106060-00002. [DOI] [PubMed] [Google Scholar]
- 13.Shoemaker RH. The NCI60 human tumour cell line anticancer drug screen. Nat Rev Cancer. 2006;6:813–823. doi: 10.1038/nrc1951. [DOI] [PubMed] [Google Scholar]
- 14.Hannah R, Beck M, Moravec R. CellTiter-Glo™ Luminescent cell viability assay: a sensitive and rapid method for determining cell viability. Promega Cell Notes. 2001;2:11–13. [Google Scholar]
- 15.Cover TM, Thomas JA. In: Elements of information theory. Schilling DL, editor. John Wiley and Sons; New York: 1991. [Google Scholar]
- 16.Berenbaum MC. In vivo determination of the fractional kill of human tumor cells by chemotherapeutic agents. Cancer Chemother Rep. 1972;56:563–571. [PubMed] [Google Scholar]
- 17.Mitchison TJ. The proliferation rate paradox in antimitotic chemotherapy. Mol Biol Cell. 2012;23:1–6. doi: 10.1091/mbc.E10-04-0335. [DOI] [PMC free article] [PubMed] [Google Scholar]
- 18.Glotzer M, Murray AW, Kirschner MW. Cyclin is degraded by the ubiquitin pathway. Nature. 1991;349:132–138. doi: 10.1038/349132a0. [DOI] [PubMed] [Google Scholar]
- 19.Aligue R, Akhavan-Niak H, Russell P. A role for Hsp90 in cell cycle control: Wee1 tyrosine kinase activity requires interaction with Hsp90. EMBO J. 1994;13:6099–6106. doi: 10.1002/j.1460-2075.1994.tb06956.x. [DOI] [PMC free article] [PubMed] [Google Scholar]
- 20.Bazzaro M, et al. Ubiquitin-proteasome system stress sensitizes ovarian cancer to proteasome inhibitor-induced apoptosis. Cancer Res. 2006;66:3754–3763. doi: 10.1158/0008-5472.CAN-05-2321. [DOI] [PubMed] [Google Scholar]
- 21.Shen L, et al. Dose-response curve slope sets class-specific limits on inhibitory potential of anti-HIV drugs. Nat Med. 2008;14:762–766. doi: 10.1038/nm1777. [DOI] [PMC free article] [PubMed] [Google Scholar]
- 22.Weiss JN. The Hill equation revisited: uses and misuses. FASEB J. 1997;11:835–841. [PubMed] [Google Scholar]
- 23.Dancey J. mTOR signaling and drug development in cancer. Nat Rev Clin Oncol. 2010;7:209–219. doi: 10.1038/nrclinonc.2010.21. [DOI] [PubMed] [Google Scholar]
- 24.Hsieh AC, et al. Genetic dissection of the oncogenic mTOR pathway reveals druggable addiction to translational control via 4EBP-eIF4E. Cancer Cell. 2010;17:249–261. doi: 10.1016/j.ccr.2010.01.021. [DOI] [PMC free article] [PubMed] [Google Scholar]
- 25.Feldman ME, et al. Active-site inhibitors of mTOR target rapamycin-resistant outputs of mTORC1 and mTORC2. PLoS Biol. 2009;7:e38. doi: 10.1371/journal.pbio.1000038. [DOI] [PMC free article] [PubMed] [Google Scholar]
- 26.Sherr CJ. Cancer cell cycles. Science. 1996;274:1672–1677. doi: 10.1126/science.274.5293.1672. [DOI] [PubMed] [Google Scholar]
- 27.Keiser MJ, et al. Predicting new molecular targets for known drugs. Nature. 2009;462:175–181. doi: 10.1038/nature08506. [DOI] [PMC free article] [PubMed] [Google Scholar]
- 28.Lounkine E, et al. Large-scale prediction and testing of drug activity on side-effect targets. Nature. 2012;486:361–367. doi: 10.1038/nature11159. [DOI] [PMC free article] [PubMed] [Google Scholar]
- 29.Gaudet S, Spencer SL, Chen WW, Sorger PK. Exploring the contextual sensitivity of factors that determine cell-to-cell variability in receptor-mediated apoptosis. PLoS Comput Biol. 2012;8:e1002482. doi: 10.1371/journal.pcbi.1002482. [DOI] [PMC free article] [PubMed] [Google Scholar]
- 30.Spencer SL, Gaudet S, Albeck JG, Burke JM, Sorger PK. Non-genetic origins of cell-to-cell variability in TRAIL-induced apoptosis. Nature. 2009;459:428–432. doi: 10.1038/nature08012. [DOI] [PMC free article] [PubMed] [Google Scholar]
- 31.Feinerman O, Veiga J, Dorfman JR, Germain RN, Altan-Bonnet G. Variability and robustness in T cell activation from regulated heterogeneity in protein levels. Science. 2008;321:1081–1084. doi: 10.1126/science.1158013. [DOI] [PMC free article] [PubMed] [Google Scholar]
- 32.Cohen AA, et al. Dynamic proteomics of individual cancer cells in response to a drug. Science. 2008;322:1511–1516. doi: 10.1126/science.1160165. [DOI] [PubMed] [Google Scholar]
- 33.Sigal A, et al. Variability and memory of protein levels in human cells. Nature. 2006;444:643–646. doi: 10.1038/nature05316. [DOI] [PubMed] [Google Scholar]
- 34.Sampah ME, Shen L, Jilek BL, Siliciano RF. Dose-response curve slope is a missing dimension in the analysis of HIV-1 drug resistance. Proc Natl Acad Sci U S A. 2011;108:7613–7618. doi: 10.1073/pnas.1018360108. [DOI] [PMC free article] [PubMed] [Google Scholar]
- 35.Tourassi GD, Frederick ED, Markey MK, Floyd CE., Jr Application of the mutual information criterion for feature selection in computer-aided diagnosis. Med Phys. 2001;28:2394–2402. doi: 10.1118/1.1418724. [DOI] [PubMed] [Google Scholar]
- 36.Benjamini Y, Hochberg Y. Controlling the false discovery rate: a practical and powerful approach to multiple testing. J R Statist Soc B. 1995;57:289–300. [Google Scholar]
- 37.Holm S. A simple sequentially rejective multiple test procedure. Scand J Statist. 1979;6:65–70. [Google Scholar]
- 38.Jolliffe IT. Principal component analysis. Springer verlag; Berlin: 2002. [Google Scholar]
- 39.Millard BL, Niepel M, Menden MP, Muhlich JL, Sorger PK. Adaptive informatics for multifactorial and high-content biological data. Nat Methods. 2011;8:487–493. doi: 10.1038/nmeth.1600. [DOI] [PMC free article] [PubMed] [Google Scholar]
Associated Data
This section collects any data citations, data availability statements, or supplementary materials included in this article.