

Abstract
The Fenna–Matthews–Olson protein (FMO) binds seven or eight bacteriochlorophyll a (BChl a) molecules and is an important model antenna system for understanding pigment-protein interactions and mechanistic aspects of photosynthetic light harvesting. FMO proteins of green sulfur bacteria (Chlorobiales) have been extensively studied using a wide range of spectroscopic and theoretical approaches because of their stability, the spectral resolution of their pigments, their water-soluble nature, and the availability of high-resolution structural data. We obtained new structural and spectroscopic insights by studying the FMO protein from the recently discovered, aerobic phototrophic acidobacterium, Candidatus Chloracidobacterium thermophilum. Native C. thermophilum FMO is a trimer according to both analytical gel filtration and native-electrospray mass spectrometry. Furthermore, the mass of intact FMO trimer is consistent with the presence of 21–24 BChl a in each. Homology modeling of the C. thermophilum FMO was performed by using the structure of the FMO protein from Chlorobaculum tepidum as a template. C. thermophilum FMO differs from C. tepidum FMO in two distinct regions: the baseplate, CsmA-binding region and a region that is proposed to bind the reaction center subunit, PscA. C. thermophilum FMO has two fluorescence emission peaks at room temperature but only one at 77 K. Temperature-dependent fluorescence spectroscopy showed that the two room-temperature emission peaks result from two excited-state BChl a populations that have identical fluorescence lifetimes. Modeling of the data suggests that the two populations contain 1–2 BChl and 5–6 BChl a molecules and that thermal equilibrium effects modulate the relative population of the two emitting states.
Keywords: Acidobacteria, Type-1 reaction center, FMO protein, Baseplate, Native-electrospray mass spectrometry, Homology modeling
1. Introduction
Photosynthesis is a central biological process that produces all the food and much of the energy used by human beings. Intense attention has been focused on using photosynthetic organisms or mechanisms adapted from photosynthesis as sources to produce cheap, clean and renewable energy [1–4]. The photosynthetic process starts with photon capture by a group of pigment-binding protein complexes called light-harvesting complexes. In these complexes, energy from absorbed photons is converted to excitation energy, which is subsequently transferred to reaction centers (RC), where it is transduced into chemical potential energy through photochemically induced, redox reactions that ultimately lead to the synthesis of ATP and in many cases to the reduction of inorganic carbon to organic compounds [5].
An enormous amount of work has been done to understand the structural basis of light harvesting and the efficiency of the energy-transfer process [6–8]. Several bacterial light-harvesting (LH) complexes, such as the LH1 [9,10] and LH2 [11,12] complexes from purple bacteria and the Fenna-Matthews-Olson protein (FMO) from green sulfur bacteria [13,14], have served as model systems for structural, spectroscopic and theoretical studies. These investigations have deepened our understanding of pigment-protein interactions and how these complexes achieve photon capture and high energy-transfer efficiencies. On the other hand, the discovery of new photosynthetic species and new light-harvesting complexes has greatly expanded our vision of the evolution of photosynthesis and also provides the means to explore new systems [15–18].
The recently discovered, thermophilic bacterium, Candidatus Chloracidobacterium (C.) thermophilum, belongs to the phylum Acidobacteria, and is the only species found in the phylum so far that is a phototroph [16]. Surprisingly, the photosystem of the aerobic C. thermophilum closely resembles that of the green sulfur bacteria (GSB), which are strict anaerobes. The energy harvested by the large peripheral antenna complex called the chlorosome [19,20] is transferred through the FMO protein to a type-I reaction center in the C. thermophilum cells, in a manner similar to that in GSB. The cells of GSB, however, are susceptible to light damage under aerobic conditions [19], because reactive oxygen species are readily produced from reduced ferredoxin generated from the type-I RCs. The mechanism that enables the C. thermophilum cells to carry out phototrophy under aerobic conditions is not yet known.
The initial characterization of C. thermophilum FMO by Tsukatani et al. [21] demonstrated its apparent difference from the more commonly studied GSB FMO proteins. The C. thermophilum FMO is distantly related to the GSB FMOs, and is about 60% similar in sequence to the FMO proteins of GSB, which are approximately 80% similar to one another. As shown by its weaker CD signal, the excitonic coupling of the bacteriochlorophyll (BChl) a molecules in the C. thermophilum FMO is somewhat weaker than that in the GSB FMOs [21]. Another interesting phenomenon is that the C. thermophilum FMO exhibits two fluorescence peaks at room temperature (RT), whereas GSB FMO proteins always have a single fluorescence emission peak.
In the research reported here, we further investigated the C. thermophilum FMO protein both structurally and spectroscopically. Firstly, we determined the overall size of the C. thermophilum FMO by analytical gel filtration and native electrospray mass spectrometry, which allows the molecular weight of the complex to be measured, thus defining the stoichiometry of the interacting components [22–25]. Secondly, we applied homology modeling [26] to generate a structural model of the C. thermophilum FMO using the known crystal structure of FMO from Chlorobaculum tepidum (C. tepidum) as a template. The overall similarity of the two sequences is 57–59% (sequence identity of ~40%) [21]. In general, with this level of similarity, homology modeling is quite feasible and can provide structural information in the absence of an X-ray structure. The constructed model allowed us to identify two regions that differ significantly from the C. tepidum FMO crystal structure. One region likely interacts with CsmA in the baseplate, and the other region may interact with the RC. Finally, we measured the temperature-dependent, steady-state fluorescence emission spectra and the excited state lifetimes to understand better the origin of the two fluorescence peaks reported earlier [21]. We found that the two emission peaks are associated with two thermally equilibrated populations of excited states at RT.
2. Materials and methods
2.1. Sample preparation and analytical gel filtration
C. thermophilum cells were grown, and FMO protein was purified by the procedures described previously [21]. The purified protein was loaded onto an analytical gel filtration column (ZORBAX GF-250, 4.6×250 mm, 150 Å pore diameter, 4 μm particle size, Agilent) attached to an Agilent series 1100C high-performance liquid chromatography (HPLC) system. The equilibration and the elution buffer was 0.1 M sodium phosphate buffer (pH=7.0) with 0.15 M sodium chloride at a flow rate of 0.5 mL/min. FMO sample (10 μ;L) with optical density at 806 nm of approximately 10 in a 1 cm path cuvette (OD806 nm ~10 cm−1 was injected by using an auto sampler. Lactate dehydrogenase, catalase, conalbumin and carbonic anhydrase were purchased from Sigma (St. Louis, MO USA) and used as references to calibrate the column. They were resuspended in phosphate buffer to 10 μM, and 10 μL of each was loaded onto the column. The photodiode-array detector was set to detect 810, 600, 370, 280 and 214 nm.
2.2. Mass spectrometry analysis
MS measurements of the native and denatured FMO protein were carried out on a 12 Tesla Fourier transform ion-cyclotron resonance (FTICR) mass spectrometer equipped with a nano-electrospray source (SolariX, Bruker DaltoniK GmbH, Bremen, Germany) coupled either to a PHD ULTRA™ syringe pump (Harvard Apparatus, Holliston, MA), or to a nano-ACQUITY UltraPerformance LC (Waters Corp., Milford, MA).
For the native electrospray, the C. thermophilum FMO complex was exchanged into 0.75 M ammonium acetate buffer (pH=7.5) and concentrated to ~8 μM. Sample infusion was performed by nano-electrospray (nano-ESI), using a custom-pulled silica capillary needle at a voltage of 850–1500 V. The needle was pulled by the P-2000 Laser Puller (Sutter Instrument CO., Novato, CA) using fused silica capillary tubing with ID 150 μm (Polymicro Technologies LLC, Phoenix, AZ). The flow rates for the mass spectral measurements were between 20 nL/min and 0.1 μL/min. Optimization of the ion transfer parameters and calibration of the instrument to m/z=8000 were carried out by direct infusion of 5 mM cesium perfluoroheptanoate. To achieve better native electrospray signals, the capillary voltage was lowered to 850–1200 V once the spray was initiated at 1500 V and kept stable. The collision energy in the collision cell was increased to 20–40 eV to observe good native electrospray signals. For acquisition of some spectra, the in-source collision-induced dissociation was turned on, and collision voltages up to 25 V were used, which helped to desolvate the complex without dissociating it.
To measure the mass of the denatured C. thermophilum FMO polypeptide, a protein aliquot (10 μl of a ~0.5 μM solution) was loaded onto an Opti-Guard trap column (Optimize Technologies, INC., Oregon City, OR) and washed by 0.1% formic acid (FA) in water before it was eluted by using 80% acetonitrile with 0.1% FA. The ESI conditions were: positive-ion mode; capillary voltage, 4000 V; dry gas, 5 L/min; and dry gas temperature, 150 °C.
Charge deconvolution of the ESI mass spectrum of the denatured C. thermophilum FMO was determined by MagTran algorithm [27]. The charge deconvolution of the native electrospray spectrum was manually calculated. For the simulation of the native electrospray spectrum, a Gaussian function with a bandwidth of 60 m/z at each charge state was applied by using Origin (OriginLab Corporation, Northampton, MA).
2.3. Homology modeling
Homology modeling of the C. thermophilum and Chloroherpeton thalassium FMO proteins was carried out using the web-based program SwissModel (http://swissmodel.expasy.org/) under automated mode. The atomic structure of FMO from C. tepidum (TFMO, PDB ID: 3BSD) was automatically selected as the template. The generated PDB file of the C. thermophilum FMO structure was viewed and aligned with the crystal structure of TFMO (PDB ID: 3ENI) by Pymol (Version 1.2r3pre, Schrödinger, LLC).
The alignment of CsmA sequences was performed using the ClustalW2 program on the website http://www.ebi.ac.uk/Tools/clustalw2/index.html. Phylogenetic analyses were carried out using the MEGA4 [28] program. Construction of the phylogenetic tree was performed by the neighbor-joining method applying the p-distance parameter.
2.4. Temperature-dependent fluorescence emission and fluorescence lifetime measurements
The fluorescence emission was measured using a setup previously described by us [29]; the excitation wavelength was 370 nm. The sample in 70% (v/v/) glycerol with OD806 nm =0.1 cm−1 was placed in a cryostat (OptistatDN, Oxford Instrument, USA), and the temperature of the cryostat was controlled by the Intelligent Temperature Controller (ITC 5035, Oxford Instrument, USA). At each temperature, the sample was incubated for 10 min to allow it to reach equilibrium. The fitting of the fluorescence spectra was done by using PeakFit (Systat Software, INC. USA).
The excited state lifetime of the C. thermophilum FMO was measured by using the same time-correlated single photon counting (TCSPC) setup as described before [29]. Briefly, a 370-nm excitation pulse was generated by a frequency doubler after the original pulse output from a Ti:Sapphire laser (Tsunami, Spectra-Physics). The frequency of the excitation was 80 kHz controlled by a pulse picker (3980, Spectra Physics). The applied excitation power for all the measurements was 22 μW at 800 kHz, which corresponded to excitation densities of 1×10⁷ to 1×10⁸ photons/(pulse · cm2). The excitation and emission bandwidths were 12 and 6 nm, respectively. The instrument response function (IRF) of the entire TCSPC system (35 ps full width at half maximum) was recorded by measuring the scattered light from a piece of metal placed in the sample chamber. Fluorescence decay curves were fitted to a sum of exponentials, convoluted with the IRF. The quality of a fit was judged from the χ2-value and by visual inspection of the residuals. The number of exponentials was considered sufficient if the addition of one extra decay component did not significantly improve the fit.
3. Results
3.1. Stoichiometry of C. thermophilum FMO protein and pigments
The FMO protein from GSB is a trimer with seven or eight BChl a [14,30] in each monomer. Given that the C. thermophilum FMO has different spectroscopic properties from proteins of GSB [21], we wished to identify the subunit stoichiometry of the complex and also the number of BChl a pigments bound to each subunit. To obtain such information, the C. thermophilum FMO was analyzed by analytical gel filtration chromatography by using mass standards: lactate dehydrogenase (146 kDa), catalase (232 kDa), carbonic anhydrase (29 kDa) and conalbumin (77 kDa). The elution profiles of these proteins are shown in SI-Fig. 1 and a calibration curve was generated by linear fitting as shown in Fig. 1. Using this standard curve, we calculated the molecular mass of the C. thermophilum FMO to be approximately 135 kDa, indicating that it is a trimer. The molecular mass of the C. thermophilum FMO polypeptide deduced from the fmoA gene sequence is 40.5 kDa, and the mass of the assembly is 140. 5 kDa if one includes 21 BChl a molecules.
Fig. 1.
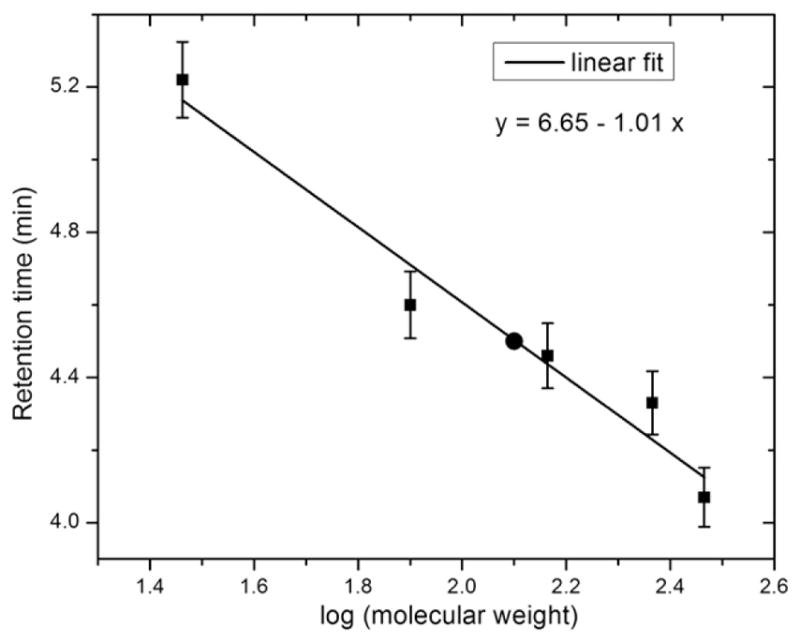
A standard curve calibrated by the elution times of monomer and dimer of the lactic dehydrogenase complex, catalase, conalbumin and carbonic anhydrase and fit (solid line) by linear least-squares of retention time versus the molecular mass (in kDa). The retention time of the C. thermophilum FMO is labeled on the standard curve by a black dot.
To determine the pigment stoichiometry independently, we adapted the recently developed native electrospray mass spectrometry technique, which has emerged as a tool to introduce large protein assemblies into the gas phase for the purpose of determining structure and stoichiometry [31,32]. As described in Materials and methods, under native conditions the C. thermophilum FMO complex shows a simple mass spectrum comprised of four main charge states (+21, +22, +23, +24) in the high m/z range (Fig. 2A); this is an indication that the protein maintains a compact structure in the vacuum. After charge deconvolution using these peaks, the measured protein mass was 140,400±500 Da. A simulated mass spectrum (red curve) of a protein of mass 140,430 Da carrying 22, 23 and 24 positive charges agreed well with the experimental data (Fig. 2A).
Fig. 2.

Mass spectra of the native (A) and denatured (B) C. thermophilum FMO. Certain charge states are labeled on the spectra. A simulated spectrum of a protein with mass 140,430 Da carrying +22, +23 and +24 charges is shown in red in panel A. A shoulder for charge state +22 is indicated by the arrow. The deconvoluted mass (40325±2 Da) of denatured C. thermophilum FMO is shown in the inset of panel B.
In contrast, the mass spectrum of the denatured C. thermophilum FMO protein shows a series of charge states (+25 to +49) in the low m/z range between 800 and 1700 Da with the most abundant ions carrying 38 positive charges (Fig. 2B). Deconvolution of the mass spectrum of C. thermophilum FMO afforded a molecular mass of 40,325±2 Da (Fig. 2B inset), which was nearly identical to that deduced from the protein sequence when the N-terminal Met (40,326.4 Da) was omitted.
If the C. thermophilum FMO complex is a trimer containing 21 BChl a (average molecular mass 911.5 Da), the theoretical mass of the protein complex would be 140,116.5 Da (40235×3+911.5×21), which is nearly identical to the measured value. The larger measured mass (+283.5 Da) likely arises from incomplete desolvation or buffer adducts, which have been frequently observed and reported for native electrospray mass spectrometry [33]. Thus, the dominant peaks of each charge state indicate that each monomer has seven BChl a. However, if there were to be an 8th BChl a in the C. thermophilum FMO or if it were partially occupied, a trimer with 22, 23 and 24 BChl a would shift each charge state to a higher m/z value. Such heterogeneity would broaden the high m/z side of each peak or generate shoulders. We do see such shoulders, for example in the +22 charge state (indicated by arrow), but it is hard to determine whether these arise from solvent adducts or from extra BChl a, partially owing to the low signal-to-noise ratio of the spectrum.
3.2. Homology structural modeling
We constructed a three-dimensional model of C. thermophilum FMO by SwissModel using the available crystal structure of FMO from C. tepidum (TFMO) as a template. The generated C. thermophilum FMO model is generally similar to TFMO, as shown in the overlaid structures of C. thermophilum FMO and TFMO in Fig. 3. All of the magnesium binding sites for BChl a except #2 are conserved in the sequence alignment [16,21], and are also perfectly overlapping in the deduced structural model when mapped onto the TFMO structure. BChl a #2 is ligated to a water molecule in TFMO, which cannot be re-generated in the C. thermophilum FMO model.
Fig. 3.

Proposed structure of C. thermophilum FMO (red) using homology modeling in comparison with TFMO (green). (A) Monomer view of overlapped C. thermophilum FMO and TFMO. (B) Side view of overlapped C. thermophilum FMO and TFMO with the three fold symmetry axis (C3) labeled. (C) Top view of the trimer from the BChl a #1 side of the protein, which is the side that faces the chlorosome. The pigments of TFMO in panels A–C are colored in cyan. The structurally different regions between C. thermophilum FMO and TFMO are labeled and colored in blue (regions 1–3 and 5–6) and in grey (region 4). The pigment conformations corresponding to the protein orientations in panels A–C are shown in D–F, respectively. BChl a 1–8 with the tails omitted for clarity are colored in red, blue, green, yellow, magenta, orange, cyan and black, respectively.
There are, however, several regions that show structural differences for the backbone carbons. Almost all of the structural differences are in the loops that connect neighboring β-strands (Fig. 3). The structural differences are mainly due to insertions or deletions in the C. thermophilum FMO sequence, as shown in the alignment (SI-Fig. 2). The structurally different regions are labeled from 1 to 6 along the sequence (SI-Fig. 2) and on the structure (Fig. 3B). All of these regions are distant from the BChl a-binding sites; instead, they are located on the side and surface of the FMO protein (Fig. 3). Thus, these regions probably play structural roles instead of modifying the electronic structure of the pigments.
Among the structural differences is the location of region 4 on the BChl a #1 side of the FMO protein (Fig. 3B). This side of the protein interacts with the baseplate of the chlorosome [34], but the detailed binding site(s) is not yet known. In region 4, the protein sequence is not highly conserved in the C. thermophilum FMO [16, 21, SI-Fig. 2]. Such sequence and structural differences of C. thermophilum FMO at this region might be an indication for the baseplate binding sites. This hypothesis requires that the corresponding C. thermophilum FMO binding region on the baseplate is different from that on the GSB baseplate.
To test the above proposal, a sequence comparison of the baseplate-forming CsmA proteins from C. thermophilum, GSB and Chloroflexus spp. was performed, as shown in Fig. 4A. Although the CsmA proteins from GSB and Chloroflexus spp. are not as highly conserved as the sequences within each family, two conserved regions were previously identified [35]. The conserved histidine residue (H25) was proposed to be the BChl a binding site [36,37], and the other conserved INRNAY region was identified as the site of interaction with FMO by surface plasmon resonance in GSB [38] and was proposed to be the binding site for the light-harvesting complex in Chloroflexus spp. [37]. The histidine residue is also conserved in the C. thermophilum baseplate, but the proposed FMO interaction region (INRNAY) is not conserved. These differences support the hypothesis that region 4 on C. thermophilum FMO is the baseplate binding region. The phylogenetic tree of the CsmA baseplate proteins (Fig. 4B) also clearly illustrates that the C. thermophilum baseplate protein (CsmA) is distantly related to the others. Recently, region 4 was confirmed as the baseplate binding region on FMO by using hydrogen/deuterium exchange coupled with MS [39].
Fig. 4.

Sequence alignment of CsmA (chlorosome baseplate BChl a-binding protein) (A) and phylogenetic tree (B). The conserved residues are shaded, and residues that are conserved across all the sequences are highlighted in red. The INRNAY highlighted in green is the identified FMO binding region in GSB. Abbreviation: Cfx, Chloroflexus; Chl, Chlorobium; Ptc, Prosthecochloris; Chp, Chloroherpeton; Cba, Chlorobaculum. (Chl. Clathratiforme was originally named Pelodictyon phaeoclathratiforme BU-1. Chl. phaeovibrioides was originally named Ptc. vibrioformis 265. Ptc. sp. BS1 was originally named Chl. phaeobacteroides BS1).
Electron microscopic images of the FMO-RC complex from GSB show that one side of the FMO trimer (viewed perpendicular to the C3 symmetry axis) interacts with the RC [40]. The identified structural differences on C. thermophilum FMO show that regions 1–3 and 5–6 are located on the side of the protein following the same view angle (Fig. 3). For example, the large insertion from residues 239 to 245 (VNQGGRV, labeled as region 5) can be clearly seen sticking out of the protein surface (Fig. 3A, B). Thus, these regions may be the RC binding sites on the C. thermophilum FMO and GSB FMOs. Again, these structural differences require the binding sites of FMO on the RC to be different in the C. thermophilum and GSB. Thus far, the only existing information is the reported sequence alignments for the PscA and PscB sequences [16] of C. thermophilum and GSB, which clearly illustrate their differences and distant sequence relationships.
3.3. Temperature-dependent fluorescence and thermal analysis
In the previous report, the C. thermophilum FMO interestingly showed two fluorescence emission maxima at RT but only a single maximum at 77 K [21]. To understand better the electronic structure of the C. thermophilum FMO, we recorded and analyzed steady-state fluorescence emission spectra at different temperatures. As shown in Fig. 5A, when the temperature of the sample was lowered from RT to 77 K, the higher-energy emission peak at 818 nm gradually disappeared as the temperature decreased while the intensity of the low-energy 832 nm emission peak increased. The overall peak width of the emission also decreased, and the higher energy, short wavelength side of the peak shifted towards longer wavelengths with decreasing temperature, while the low energy side of the emission peak was much less affected by temperature. At 77 K, a single emission peak, which had intensity about two times greater than that at RT, was observed at 833 nm. The temperature modulation of the yield of the two peaks suggests that two excited-state populations are connected to one another and that the higher energy population is reached by up-hill energy transfer through thermal dynamics at RT.
Fig. 5.

(A) Temperature-dependent fluorescence emission spectra recorded at 300 to 77 K. Arrows indicate the narrowing of the bandwidth and the increase of the intensity. (B) A plot of the ratio of the fluorescence yields of the two emission peaks versus the reciprocal of temperature from 160 to 300 K; the solid red line is a linear fit of the data.
The emission profile at each temperature between 160 and 300 K was fit by two peaks by using the Gaussian–Lorentzian Sum function in the PeakFit software. The fittings of the emission spectra at 280, 220 and 160 K are included in the SI-Fig. 3. Below 140 K, the fitting depends too much on the initial parameters, and, thus, these data were not used. Between 160 and 300 K, one of the two deconvoluted peak maxima was at ~834 nm, and the other ranged from 811 to 814 nm, with the longer wavelength corresponding to the lower temperature. The fluorescence yields of the two populations (the 834 nm peak as population 1 and the other as population 2) were compared by integrating the area under the individual, deconvoluted peaks to afford a temperature-dependent ratio of the two emission yields (Φ1, Φ2) (Fig. 5B). A linear relationship was obtained, when ln (Φ1/Φ2) was plotted against the reciprocal of the temperature. This means that the ratio of Φ1/Φ2 in the range of 300 to 160 K can be described by an equation based on thermal equilibrium between the two populations: Φ1/Φ2 =N1/N2*exp(−ΔE12/kT), where N1/N2 is the ratio of the number of molecules in the two populations, ΔE12 the energy gap between the two populations and k is Boltzmann’s constant. Equal fluorescence rate constants were assumed for the two populations.
From the linear fit of the data points, we calculated the value of ΔE12 from the slope of the curve to be −0.044 ± 0.005 eV (ΔE=k*slope), matching the energy difference of the two populations, for which there is a theoretical energy difference between 834 and 810 nm of −0.044 eV. From the intercept, we found the ratio of the two populations N1/N2 to be 0.3±0.1 (N1/N2 =exp(intercept)). If each C. thermophilum FMO monomer has seven or eight BChl a, population 1 will have one or two strongly coupled BChl a molecules, and population 2 will have five or six coupled BChl a molecules. Two Gaussian functions were also used to fit the emission profiles. The fitting matched the experimental data less well compared to the Gaussian–Lorentzian function. One Gaussian fitting peak is located at around 832 nm whereas the other peak shifts from 807 to 812 nm as the temperature is decreased. A plot of ln(Φ1/Φ2) versus the reciprocal of the temperature also gives a linear relationship with the calculated ΔE12 and N1/N2 values falling in the same ranges.
3.4. Excited state lifetime
To gain more insight into the electronic structure of the C. thermophilum FMO and its modulation by temperature, we measured the lifetimes of excited states at RT and 77 K. At RT, we monitored the fluorescence lifetime at four emission wavelengths: 800, 815, 830 and 845 nm. All the decays can be fit well by two exponential components with time constants of 1.9 ns (amplitude ~73%) and 0.5 ns (amplitude ~27%). The fluorescence decays at 815 and 830 nm are shown in Fig. 6 with the fitting by two exponential functions. At 77 K, the fluorescence lifetime can be fit by a single exponential decay with a time constant of 1.9 ns. Comparing C. thermophilum FMO to GSB FMOs, no fast lifetime component (~50–70 ps) was observed; the fast component is always present and sometimes dominant in the GSB FMOs under normal conditions [29].
Fig. 6.
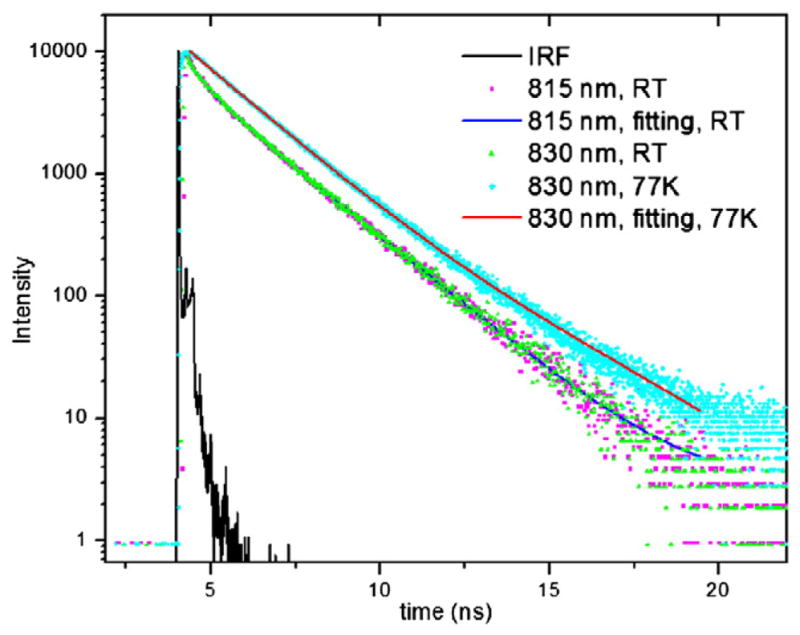
Fluorescence lifetime of C. thermophilum FMO at RT monitored at 815 and 830 nm, and fit by two exponential decays with lifetimes of 1.9 and 0.5 ns. The 77 K fluorescence decay was monitored at 830 nm and fitted by one exponential decay function with lifetime of 1.9 ns. The instrument response function (IRF) has a full width at half maximum of 35 ps.
4. Discussion
4.1. FMO complex stoichiometry
Recently, protein crystallography showed that the FMO protein contains eight BChl a pigments rather than seven as was previously held [14], with the eighth pigment binding site not fully occupied. Analyses of FMO protein sequences [21] indicate that all the BChl a binding sites are conserved in C. thermophilum FMO, which suggests that the protein should have a similar stoichiometry of BChl a as found in GSB FMOs. However, the C. thermophilum FMO also has significantly different spectroscopic properties from the GSB FMOs. Thus, it was necessary to determine whether the predicted BChl a binding sites were really occupied. Native electrospray mass spectrometry provided a measurement of the number of pigments (21–24 BChl a) per trimer. The spectra, however, have relatively low signal-to-noise ratios, making it difficult to determine unambiguously whether the 8th pigment is present in each monomer and the actual occupancy per trimer. One reason for the low signal-to-noise ratio may be the relatively longer time for ion transfer from the source to the ICR trap and for detection in the FTICR instrument compared to other mass spectrometers, which causes some loss of ions either physically or by decomposition, the effect of which is especially apparent when the sample amount is limited. Another reason may be the intrinsic nature of the FMO protein, which forms a “taco shell” compact structure that makes desolvation by electrospray difficult. In addition, if the eighth binding site is not fully occupied owing to losses during purification, sample heterogeneity (with 21–24 BChl a in each trimer) will cause broadening of the peaks at each charge state. Nevertheless, native electrospray MS does provide useful information on the stoichiometry of this and other proteins [41] and cofactors. Future improvements in sample preparation and methodology will help define the nature of the 8th pigment and its role in FMO function.
4.2. Structural modeling
Although homology structure modeling by SwissModel has been widely used to predict protein structures [42], and 60% sequence similarity is quite feasible for the construction of a reasonable 3D model, we did further tests to validate the program and the model. Firstly, we used other homology modeling programs, such as 3D-JIGSAW [43], CPHmodels [44], ESyPred3D [45] and Geno3D [46], to predict the C. thermophilum FMO model. All the programs tested gave the same structurally different regions. Secondly, homology structure modeling using the FMO sequences from Chlorobium limicola or Chlorobium phaeobacteroides DSM266 predicted structures that superimposed well onto the TFMO structure. The observed structurally different regions on the C. thermophilum FMO model were not observed for these structures. This is consistent with the fact that the FMO and CsmA sequences from these two species are highly conserved relative to the sequences from C. tepidum [21].
In the FMO phylogenetic tree built by Tsukatani et al. [21] using 16 FMO sequences from GSB, the FMO from Chloroherpeton (Chp.) thalassium was evolutionarily most distant from other GSB FMOs. The homology structure of this FMO protein predicted by SwissModel shows only one structurally different region (SI-Fig. 4), which is region 4 (the CsmA baseplate-binding region) on the C. thermophilum FMO. From the sequence alignment of baseplate CsmA proteins (Fig. 4A), the CsmA sequence of Chp. thalassium is also quite divergent from those of other GSB, and the INRNAY conserved region is not conserved in this organism. This finding further strengthens the inferred structural connection between region 4 on the FMO protein and the INRNAY region on CsmA.
There is much less information available about the interactions between FMO and RCs. We propose that the other structurally different regions on the side of the C. thermophilum FMO are the RC binding regions, although more biochemical or structural studies must be done to test this hypothesis. The previous three-dimensional imaging analysis of the FMO-RC complex [40] suggested that PscB/PscD subunits are in contact with the FMO and a C. tepidum mutant lacking PscD subunit showed that the PscD subunit [47] of GSB RC is important for the binding of FMO to RC. However, C. thermophilum does not have a PscD subunit, which means that the structural changes at regions 1–3 and 5–6 of C. thermophilum FMO might be important for it to bind to PscB stably in the absence of PscD. Interestingly and consistently, Chl. thalassium, the FMO from which does not have these structural changes, does have the PscD subunit.
4.3. The thermal equilibration model
We were surprised that there are two fluorescence emission peaks at RT but only a single peak at 77 K for the C. thermophilum FMO protein. Usually, spectral peaks are more resolved by lowering the temperature, but the situation is reversed in C. thermophilum FMO; lowering the temperature caused the higher energy emission peak to disappear. This suggests that the two emission peaks at RT are temperature correlated and that the higher energy population comes from thermally activated, up-hill energy transfer from the lower energy population. For this to occur, the energy transfer rate from the higher energy population to the lower energy population must be very fast and vice versa. In addition, the energy gap between the two populations should be similar to thermal energy.
When compared to the absorption spectrum of FMO from GSB, the Qy band of C. thermophilum FMO is weaker and broader after spectral normalization on the Qx peak, and it is blue shifted with clear spectral features resolved even at room temperature [21]. The fine spectral features of the Qy band resolved in the 77 K absorption spectra of C. thermophilum FMO and GSB FMO are also quite different in terms of peak position and intensity [21]. These differences indicate that the site energies of individual pigments and possibly their oscillator strengths are different between the two FMOs; together the thermal up-hill energy equilibrium, which causes the two emission states, is more apparent in C. thermophilum than in GSB FMO.
Following a similar analysis procedure using thermal dynamics to study the emission profile of LH2 by van Grondelle et al. [48], we estimated the number of pigments in the two populations of C. thermophilum FMO to be 1–2 and 5–6, respectively. Compared to LH2, in which the two populations (B800 and B850) are spectrally well separated, the deconvolution of the emission spectra of C. thermophilum FMO is much more complex and, therefore, less accurate.
5. Conclusion
C. thermophilum is difficult to grow, and the amount of FMO produced is much smaller compared to that of the GSB, which makes detailed structural and functional study of this FMO protein challenging. However, native electrospray MS, which generally takes only several μL of micromolar concentration, gave the stoichiometry of the protein subunits and the cofactors, whereas homology modeling generated a structural model of the protein polypeptide. Structural and sequence comparisons of FMO proteins revealed two regions of the C. thermophilum FMO that might link the chlorosome and RCs in cells. Although more experimental data are needed to validate these predictions, especially the RC binding region, we are able to propose a detailed model of the photosystems of GSB and C. thermophilum; the model includes the interaction of FMO with the chlorosome baseplate and FMO with the RCs. It is still difficult to rationalize the origin of the weak excitonic coupling in the C. thermophilum FMO as well as the structural basis of the two thermally equilibrated, excited-state populations from the structural information extracted thus far. More advanced spectroscopic techniques, such as transient absorption or hole burning, are needed to gain more information on the electronic structure of the C. thermophilum FMO. An atomic resolution structure would also help to validate the hypothetical model and provide more detailed information on the function of specific residues.
Supplementary Material
Acknowledgments
We thank Prof. Richard Loomis and his student Kenny Buyle for the help in the TCSPC experiments. This work was supported by U.S. Department of Energy Grant DE-FG02-07ER15846 to REB, DE-FG02-94ER20137 to D.A.B., and National Centers for Research Resources of the National Institutes of Health Grant P41 RR000954 to M.L.G. Y. T. was supported by a postdoctoral fellowship from The Uehara Memorial Foundation. This research is from the Photosynthetic Antenna Research Center (PARC), an Energy Frontier Research Center funded by the U.S. Department of Energy, Office of Science, Office of Basic Energy Sciences, via Grant DE-SC 0001035.
Appendix A. Supplementary data
Supplementary data to this article can be found online at doi:10.1016/j.bbabio.2010.09.008.
References
- 1.Johnson ET, Schmidt-Dannert C. Light-energy conversion in engineered microorganisms. Trends Biotechnol. 2008;26:682–689. doi: 10.1016/j.tibtech.2008.09.002. [DOI] [PubMed] [Google Scholar]
- 2.Lee HS, Vermaas WF, Rittmann BE. Biological hydrogen production: prospects and challenges. Trends Biotechnol. 2010;28:262–271. doi: 10.1016/j.tibtech.2010.01.007. [DOI] [PubMed] [Google Scholar]
- 3.Ragauskas AJ, Williams CK, Davison BH, Britovsek G, Cairney J, Eckert CA, Frederick WJ, Jr, Hallett JP, Leak DJ, Liotta CL, Mielenz JR, Murphy R, Templer R, Tschaplinski T. The path forward for biofuels and biomaterials. Science. 2006;311:484–489. doi: 10.1126/science.1114736. [DOI] [PubMed] [Google Scholar]
- 4.Zhu XG, Long SP, Ort DR. Improving photosynthetic efficiency for greater yield. Annu Rev Plant Biol. 2010;61:235–261. doi: 10.1146/annurev-arplant-042809-112206. [DOI] [PubMed] [Google Scholar]
- 5.Blankenship RE. Molecular Mechanisms of Photosynthesis. Blackwell Science; Oxford, UK: 2002. [Google Scholar]
- 6.Cheng YC, Fleming GR. Dynamics of light harvesting in photosynthesis. Annu Rev Phys Chem. 2009;60:241–262. doi: 10.1146/annurev.physchem.040808.090259. [DOI] [PubMed] [Google Scholar]
- 7.Renger T. Theory of excitation energy transfer: from structure to function. Photosynth Res. 2009;102:471–485. doi: 10.1007/s11120-009-9472-9. [DOI] [PubMed] [Google Scholar]
- 8.van Grondelle R, Novoderezhkin VI. Energy transfer in photosynthesis: experimental insights and quantitative models. Phys Chem Chem Phys. 2006;8:793–807. doi: 10.1039/b514032c. [DOI] [PubMed] [Google Scholar]
- 9.Qian P, Bullough PA, Hunter CN. Three-dimensional reconstruction of a membrane-bending complex: the RC-LH1-PufX core dimer of Rhodobacter sphaeroides. J Biol Chem. 2008;283:14002–14011. doi: 10.1074/jbc.M800625200. [DOI] [PubMed] [Google Scholar]
- 10.Roszak AW, Howard TD, Southall J, Gardiner AT, Law CJ, Isaacs NW, Cogdell RJ. Crystal structure of the RC-LH1 core complex from Rhodopseudomonas palustris. Science. 2003;302:1969–1972. doi: 10.1126/science.1088892. [DOI] [PubMed] [Google Scholar]
- 11.Cogdell RJ, Gall A, Kohler J. The architecture and function of the light-harvesting apparatus of purple bacteria: from single molecules to in vivo membranes. Q Rev Biophys. 2006;39:227–324. doi: 10.1017/S0033583506004434. [DOI] [PubMed] [Google Scholar]
- 12.Papiz MZ, Prince SM, Howard T, Cogdell RJ, Isaacs NW. The structure and thermal motion of the B800-850 LH2 complex from Rps.acidophila at 2.0A resolution and 100 K: new structural features and functionally relevant motions. J Mol Biol. 2003;326:1523–1538. doi: 10.1016/s0022-2836(03)00024-x. [DOI] [PubMed] [Google Scholar]
- 13.Li YF, Zhou W, Blankenship RE, Allen JP. Crystal structure of the bacteriochlorophyll a protein from Chlorobium tepidum. J Mol Biol. 1997;271:456–471. doi: 10.1006/jmbi.1997.1189. [DOI] [PubMed] [Google Scholar]
- 14.Tronrud DE, Wen J, Gay L, Blankenship RE. The structural basis for the difference in absorbance spectra for the FMO antenna protein from various green sulfur bacteria. Photosynth Res. 2009;100:79–87. doi: 10.1007/s11120-009-9430-6. [DOI] [PubMed] [Google Scholar]
- 15.Beatty JT, Overmann J, Lince MT, Manske AK, Lang AS, Blankenship RE, Van Dover CL, Martinson TA, Plumley FG. An obligately photosynthetic bacterial anaerobe from a deep-sea hydrothermal vent. Proc Natl Acad Sci USA. 2005;102:9306–9310. doi: 10.1073/pnas.0503674102. [DOI] [PMC free article] [PubMed] [Google Scholar]
- 16.Bryant D, Costas AG, Heidelberg J, Ward D. Candidatus Chloracidobacterium thermophilum: an aerobic phototrophic Acidobacterium with chlorosomes and type 1 reaction centers. Photosynth Res. 2007;91:269–270. [Google Scholar]
- 17.Gest H, Favinger JL. Heliobacterium-chlorum, an anoxygenic brownish-green photosynthetic bacterium containing a new form of bacteriochlorophyll. Arch Microbiol. 1983;136:11–16. [Google Scholar]
- 18.Miyashita H, Ikemoto H, Kurano N, Adachi K, Chihara M, Miyachi S. Chlorophyll d as a major pigment. Nature. 1996;383:402. [Google Scholar]
- 19.Li H, Bryant DA. Envelope proteins of the CsmB/CsmF and CsmC/CsmD motif families influence the size, shape, and composition of chlorosomes in Chlorobaculum tepidum. J Bacteriol. 2009;191:7109–7120. doi: 10.1128/JB.00707-09. [DOI] [PMC free article] [PubMed] [Google Scholar]
- 20.Psencik J, Collins AM, Liljeroos L, Torkkeli M, Laurinmaki P, Ansink HM, Ikonen TP, Serimaa RE, Blankenship RE, Tuma R, Butcher SJ. Structure of chlorosomes from the green filamentous bacterium Chloroflexus aurantiacus. J Bacteriol. 2009;191:6701–6708. doi: 10.1128/JB.00690-09. [DOI] [PMC free article] [PubMed] [Google Scholar]
- 21.Tsukatani Y, Wen JZ, Blankenship RE, Bryant DA. Characterization of the FMO protein from the aerobic chlorophototroph, Candidatus Chloracidobacterium thermophilum. Photosynth Res. 2010;104:201–209. doi: 10.1007/s11120-009-9517-0. [DOI] [PubMed] [Google Scholar]
- 22.Barrera NP, Di Bartolo N, Booth PJ, Robinson CV. Micelles protect membrane complexes from solution to vacuum. Science. 2008;321:243–246. doi: 10.1126/science.1159292. [DOI] [PubMed] [Google Scholar]
- 23.Ruotolo BT, Giles K, Campuzano I, Sandercock AM, Bateman RH, Robinson CV. Evidence for macromolecular protein rings in the absence of bulk water. Science. 2005;310:1658–1661. doi: 10.1126/science.1120177. [DOI] [PubMed] [Google Scholar]
- 24.Ruotolo BT, Robinson CV. Aspects of native proteins are retained in vacuum. Curr Opin Chem Biol. 2006;10:402–408. doi: 10.1016/j.cbpa.2006.08.020. [DOI] [PubMed] [Google Scholar]
- 25.Taverner T, Hernandez H, Sharon M, Ruotolo BT, Matak-Vinkovic D, Devos D, Russell RB, Robinson CV. Subunit architecture of intact protein complexes from mass spectrometry and homology modeling. Acc Chem Res. 2008;41:617–627. doi: 10.1021/ar700218q. [DOI] [PubMed] [Google Scholar]
- 26.Schwede T, Kopp J, Guex N, Peitsch MC. SWISS-MODEL: an automated protein homology-modeling server. Nucleic Acids Res. 2003;31:3381–3385. doi: 10.1093/nar/gkg520. [DOI] [PMC free article] [PubMed] [Google Scholar]
- 27.Zhang ZQ, Marshall AG. A universal algorithm for fast and automated charge state deconvolution of electrospray mass-to-charge ratio spectra. J Am Soc Mass Spectrom. 1998;9:225–233. doi: 10.1016/S1044-0305(97)00284-5. [DOI] [PubMed] [Google Scholar]
- 28.Tamura K, Dudley J, Nei M, Kumar S. MEGA4: molecular evolutionary genetics analysis (MEGA) software version 4.0. Mol Biol Evol. 2007;24:1596–1599. doi: 10.1093/molbev/msm092. [DOI] [PubMed] [Google Scholar]
- 29.Wen J, Harada J, Buyle K, Yuan K, Tamiaki H, Oh-Oka H, Loomis RA, Blankenship RE. Characterization of an FMO variant of Chlorobaculum tepidum carrying bacteriochlorophyll a esterified by geranylgeraniol. Biochemistry. 2010;49:5455–5463. doi: 10.1021/bi1006805. [DOI] [PMC free article] [PubMed] [Google Scholar]
- 30.Fenna RE, Matthews BW. Chlorophyll arrangement in a bacteriochlorophyll protein from chlorobium-limicola. Nature. 1975;258:573–577. [Google Scholar]
- 31.Sharon M. How far can we go with structural mass spectrometry of protein complexes? J Am Soc Mass Spectrom. 2010;21:487–500. doi: 10.1016/j.jasms.2009.12.017. [DOI] [PubMed] [Google Scholar]
- 32.van Duijn E. Current limitations in native mass spectrometry based structural biology. J Am Soc Mass Spectrom. 2010;21:971–978. doi: 10.1016/j.jasms.2009.12.010. [DOI] [PubMed] [Google Scholar]
- 33.McKay AR, Ruotolo BT, Ilag LL, Robinson CV. Mass measurements of increased accuracy resolve heterogeneous populations of intact ribosomes. J Am Chem Soc. 2006;128:11433–11442. doi: 10.1021/ja061468q. [DOI] [PubMed] [Google Scholar]
- 34.Wen J, Zhang H, Gross ML, Blankenship RE. Membrane orientation of the FMO antenna protein from Chlorobaculum tepidum as determined by mass spectrometry-based footprinting. Proc Natl Acad Sci USA. 2009;106:6134–6139. doi: 10.1073/pnas.0901691106. [DOI] [PMC free article] [PubMed] [Google Scholar]
- 35.Blankenship Robert E, Madigan Michael T, Bauer CE. Anoxygenic photosynthetic bacteria. In: Govindjee, editor. Advances in Photosynthesis. Kluwer Academic Publishing; Dordrecht, The Netherlands: 1995. pp. 399–435. [Google Scholar]
- 36.Pedersen MO, Underhaug J, Dittmer J, Miller M, Nielsen NC. The three-dimensional structure of CsmA: a small antenna protein from the green sulfur bacterium Chlorobium tepidum. FEBS Lett. 2008;582:2869–2874. doi: 10.1016/j.febslet.2008.07.020. [DOI] [PubMed] [Google Scholar]
- 37.Pedersen MO, Linnanto J, Frigaard NU, Nielsen NC, Miller M. A model of the protein-pigment baseplate complex in chlorosomes of photosynthetic green bacteria. Photosynth Res. 2010;104:233–243. doi: 10.1007/s11120-009-9519-y. [DOI] [PubMed] [Google Scholar]
- 38.Pedersen MO, Borch J, Hojrup P, Cox RP, Miller M. The light-harvesting antenna of Chlorobium tepidum: interactions between the FMO protein and the major chlorosome protein CsmA studied by surface plasmon resonance. Photosynth Res. 2006;89:63–69. doi: 10.1007/s11120-006-9081-9. [DOI] [PubMed] [Google Scholar]
- 39.Wen J, Huang RY-C, Gross ML, Blankenship RE. Architecture of a photosyn-thetic membrane revealed by hydrogen/deuterium exchange and mass spectrometry. 58th ASMS Conference on Mass Spectrometry and Allied Topics, Poster MP 047; 2010. [Google Scholar]
- 40.Remigy HW, Stahlberg H, Fotiadis D, Muller SA, Wolpensinger B, Engel A, Hauska G, Tsiotis G. The reaction center complex from the green sulfur bacterium Chlorobium tepidum: a structural analysis by scanning transmission electron microscopy. J Mol Biol. 1999;290:851–858. doi: 10.1006/jmbi.1999.2925. [DOI] [PubMed] [Google Scholar]
- 41.Hernandez H, Robinson CV. Determining the stoichiometry and interactions of macromolecular assemblies from mass spectrometry. Nat Protoc. 2007;2:715–726. doi: 10.1038/nprot.2007.73. [DOI] [PubMed] [Google Scholar]
- 42.Bordoli L, Kiefer F, Arnold K, Benkert P, Battey J, Schwede T. Protein structure homology modeling using SWISS-MODEL workspace. Nat Protoc. 2009;4:1–13. doi: 10.1038/nprot.2008.197. [DOI] [PubMed] [Google Scholar]
- 43.Contreras-Moreira B, Bates PA. Domain Fishing: a first step in protein comparative modelling. Bioinformatics. 2002;18:1141–1142. doi: 10.1093/bioinformatics/18.8.1141. [DOI] [PubMed] [Google Scholar]
- 44.Petersen MNCLOLTN. CPHmodels-3.0—remote homology modeling using structure-guided sequence profiles. Nucleic Acids Res. 2010;38:576–581. doi: 10.1093/nar/gkq535. [DOI] [PMC free article] [PubMed] [Google Scholar]
- 45.Lambert C, Leonard N, De Bolle X, Depiereux E. ESyPred3D: prediction of proteins 3D structures. Bioinformatics. 2002;18:1250–1256. doi: 10.1093/bioinformatics/18.9.1250. [DOI] [PubMed] [Google Scholar]
- 46.Combet C, Jambon M, Deleage G, Geourjon C. Geno3D: automatic comparative molecular modelling of protein. Bioinformatics. 2002;18:213–214. doi: 10.1093/bioinformatics/18.1.213. [DOI] [PubMed] [Google Scholar]
- 47.Tsukatani Y, Miyamoto R, Itoh S, Oh-Oka H. Function of a PscD subunit in a homodimeric reaction center complex of the photosynthetic green sulfur bacterium Chlorobium tepidum studied by insertional gene inactivation. Regulation of energy transfer and ferredoxin-mediated NADP+ reduction on the cytoplasmic side. J Biol Chem. 2004;279:51122–51130. doi: 10.1074/jbc.M410432200. [DOI] [PubMed] [Google Scholar]
- 48.Vangrondelle R, Kramer HJM, Rijgersberg CP. Energy-transfer in the B800-850-carotenoid light-harvesting complex of various mutants of Rhodopseudomonas-Sphaeroides and of Rhodopseudomonas-Capsulata. Biochim Biophys Acta. 1982;682:208–215. [Google Scholar]
Associated Data
This section collects any data citations, data availability statements, or supplementary materials included in this article.