Abstract
A facile synthesis of 3-6 nm, water dispersible, near-infrared (NIR) emitting, quantum dots (QDs) magnetically doped with Fe is presented. Doping of alloyed CdTeS nanocrystals with Fe was achieved in situ using a simple hydrothermal method. The magnetic quantum dots (MQDs) were capped with NAcetyl-Cysteine (NAC) ligands, containing thiol and carboxylic acid functional groups to provide stable aqueous dispersion. The optical and magnetic properties of the Fe doped MQDs were characterized using several techniques. The synthesized MQDs are tuned to emit in the Vis-NIR (530-738 nm) wavelength regime and have high quantum yields (67.5-10%). NIR emitting (738 nm) MQDs having 5.6 atomic% Fe content exhibited saturation magnetization of 85 emu/gm[Fe] at room temperature. Proton transverse relaxivity of the Fe doped MQDs (738 nm) at 4.7 T was determined to be 3.6 mM−1s−1. The functional evaluation of NIR MQDs has been demonstrated using phantom and in vitro studies. These water dispersible, NIR emitting and MR contrast producing Fe doped CdTeS MQDs, in unagglomerated form, have the potential to act as multimodal contrast agents for tracking live cells.
1. Introduction
Development of multimodal contrast agents has attracted attention recently due to their potential use in biomedical imaging applications. These probes can be used as contrast agents for complementary imaging modalities, optical and magnetic resonance imaging (MRI), thus integrating the advantages of three dimensional anatomic imaging with highly sensitive fluorescence imaging1, 2. Although numerous multimodal contrast agents have been developed3-9, research on magnetically doped quantum dots (QDs) or magnetic quantum dots (MQDs) has become particularly attractive10, 11. The advantages of MQDs include size tunable fluorescence, high quantum yields, photo stability, resistance to photo-degradation, ability to multiplex and extremely small size12, 13. MQD probes emitting in the near-infrared (NIR) window (650-900 nm) are even more attractive14-17for imaging of biological specimens, as they generate minimal absorbance and auto fluorescence, thus enabling deep tissue non-invasive in vivo imaging18 e.g. bio-distribution, tumor targeting and lymph node mapping14. The integration of optical and magnetic character into bimodal probes has been accomplished in multiple ways by forming asymmetric heterostructures (CdS-FePt)19, CdSe-Fe2O320;developing fluorescence semiconductor shell on magnetic core e.g. Core/shell Co/CdSe21; co-embedding magnetic and fluorescent nanocrystals e.g. CdSe/ZnS with Fe2O3 in polymer nanoparticles22, Fe3O4-CdTe23, γ-Fe2O3-CdSe in silica24, CdSe/ZnS-Fe3O4 encapsulation in mesoporous silica25; magnetic core-multiple shell particles e.g. γ-Fe2O3-SiO2-CdTe-SiO226; incorporation of chelated paramagnetic Gd to the QDs e.g. CdSe/ZnS in lipidic micelles27, silica coated CdS:Mn/ZnS28, CdSe/ZnS29; biomagnetic nanoparticles conjugated to QDs e.g. ferritin protein conjugated QDs30. In all the above examples, bimodal contrast agents were obtained by combining different probes possessing fluorescent and magnetic functionalities. QDs doped with magnetic ions or MQDs, offer an elegant solution by incorporating both functionalities in a single probe. Synthesis of magnetically doped core and core/shell MQDs, emitting in the visible regime and synthesized using non-aqueous solvents have been reported, for e.g. Co and Mn doped CdSe31, Cr doped CdSe32, Gd doped in CdSe3, Mn doped in CdSe33, Mn doped in the core of CdS/ZnS34 and in the shell of core/shell CdSe/Zn1-xMnxS35, Mn doped InP36, 37, Ni doped CdTeSe/CdS38. Many reports on the development of MQDs emitting in the visible regime are available, but very few exist39 for bi-functional MQDs that emit in the NIR. In addition to their NIR emission characteristics, MQDs that are water dispersible are also desirable for biological imaging applications. Biological applications of MQDs synthesized using non-aqueous techniques require further surface modifications to render aqueous dispersibility, which increases the processing steps and may adversely affects optical properties. The MQDs discussed so far were mostly synthesized using the non-aqueous organometallic process. Santra et. al34 developed CdS:Mn/ZnS QDs using the aqueous based inverse micelle method but the emission wavelength was limited to visible region. Overcoming the above challenges, we have successfully synthesized water dispersible, high quantum yield, NIR emitting and MR effective, Fe doped CdTeS MQDs. Here we report the synthesis of NIR (>700nm) emitting MQDs, achieved through hydrothermal method, along with in vitro characterizations and functional evaluations.
To the best of our knowledge this is the first time water-dispersible magnetic and vis-NIR emitting Fe doped CdTeS MQDs have been synthesized by aqueous hydrothermal technique for bioimaging applications and imaged using MRI. Characterization of the resulting MQDs was performed using XRD, TEM, XPS, ICP and SQUID. Photoluminescence (PL) emission properties of the Fe doped MQDs were studied as a function of size. MRI, optical absorbance and PL measurements of the MQDs demonstrate their utility for bimodal magnetic resonance and optical imaging. The synthesized MQDs emit in the 530-738 nm wavelength regimes and have a PL efficiency of 10-67.5%. By this process synthesis of stable MQDs emitting up to 738 nm was successful. The Fe doped MQD is an example of a model system for bimodal probes, but the methodology can be extended to other doped QD compositions.
2. Experimental
Reagents and Materials: In the experiment the chemicals used were CdCl2 (99.7% Fisher), FeCl2.4H2O (99% Sigma), N-Acetyl-Cysteine (NAC) (99% Sigma), tellurium powder (200 mesh, 99% Acros), sodium borohydride (99% Acros) and sodium hydroxide (99% Fisher).
2.1 Synthesis of the Fe doped CdTeS MQDs
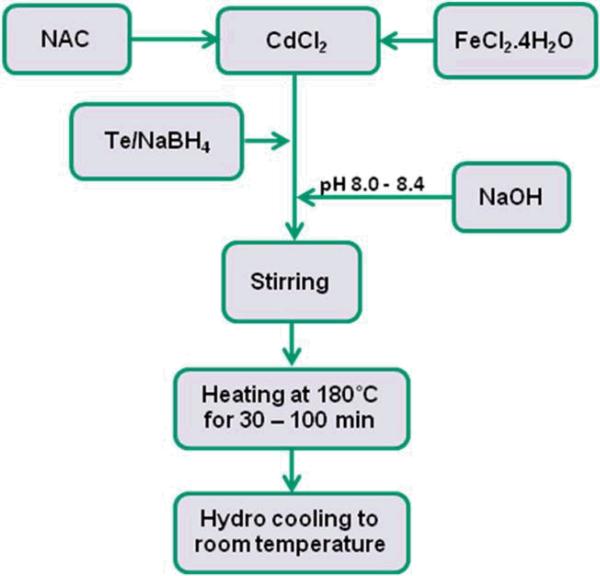
The Fe doped CdTeS MQDs were synthesized using a process similar to Zhao et al40 with some modifications. In a typical process, sodium hydrogen telluride (NaHTe) was prepared from NaBH4 and tellurium powder in argon purged distilled (DI) water. The molar ratio of NaBH4 to Te used was 2:1. The as prepared NaBH4/Te solution was aged at 4 °C for the reaction to be completed. The time period allowed for reaction was more than 8 hrs. In a separate 250 ml round bottom flask CdCl2 (30 mM) solution in 100 ml DI was prepared. N-Acetyl-Cysteine (NAC) and FeCl2.4H2O were added to the solution so that Cd:NAC and Cd:Fe molar ratios were 1:2.5 and 8.5:1 respectively. The solution was Argon purged for more than 30 min with subsequent addition of NaHTe resulting in a wine red color solution. The pH of the precursor solution was adjusted to (8.1 – 8.4) by using 2M NaOH followed by heating the solution in several 23 ml polytetrafluoroethylene (PTFE) lined autoclaves (Parr acid digestion bombs) in batches of 10 ml, for different time intervals, and at a constant temperature of 180 °C. The autoclaves were cooled by a hydro-cooling process. The MQDs thus prepared were taken out and characterized after washing. Washing of the MQDs was achieved by centrifugation at 2600 rpm for 4-5 minutes, using Amicon Ultra-15 Centrifugal Filter Unit with membranes suitable for 30 kDa protein filtration.
2.2 Characterization
Vis-NIR PL
SpectraMax® M5 Multi-Mode Microplate Reader was used for collecting Vis-NIR absorption and emission spectra of the MQDs at room temperature over a wavelength range of 400 – 850 nm and plotted using SoftMax Pro v5.3 software. The MQD samples were measured against water as reference. The excitation wavelength was set at 300 nm and the emission spectra obtained over 430 – 850 nm. The PL quantum yields (QYs) of the MQDs were determined at room temperature by comparing with a solution of Rhodamine 6G in ethanol (QY 95%)41. The absorbance or optical density (OD) of Rhodamine 6G and the MQDs were adjusted to less than 0.1 for QY determination. For the QY measurements, the excitation wavelength used was 500 nm.
TEM
JEOL 2010F operating at 200 kV was used for acquiring HRTEM images of the MQDs. The TEM sample preparations were done by drying a dispersion of MQDs on carbon coated Cu grids (01813-F, Ted Pella, Inc., USA), overnight at room temperature. The same TEM and samples were used for EDS analysis of the MQDs.
ICP
Inductively coupled plasma optical emission spectrometer (ICP-AES Perkin Elmer Optima 3200 RL) was used for the elemental analysis of the MQDs and compared with the data obtained from EDS analysis. WinLab32TM ICP software was used for plotting the data. The read delay was set at 15 s, and the optical wavelengths used to analyze the elements were 228.8 nm, 214.3 nm and 238.2 nm for Cd, Te and Fe respectively. ICP sample preparation was done by drying a dispersion of 250 μl of the MQDs overnight at room temperature, followed by dissolving them in 2-3 ml aqua regia and diluting the resulting solution to a volume of 10 ml using DI water.
XRD
The powder diffraction patterns for the MQDs were recorded using a Philips X-ray diffractometer APD 3720 (Philips Scientific, Mahwah, NJ) at 40 kV and 20 mA using Cu Kα radiation (λ = 1.54056 Å) and scanned at a rate of 0.04 deg/s over a range of 20° < 2θ < 130°.
XPS
The XPS characterizations of the MQDs were obtained using Perking Elmer 5100 XPS system using Mg Kα x-ray ~1253.6 eV. Samples were prepared by dropping MQD suspensions on 1 mm × 1 mm silicon wafers at room temperature and allowing the samples to dry in oven for a few minutes. The MQD samples were sputtered using Ar beam at 4 KeV.
SQUID
The magnetic hysteresis properties of the samples were obtained using a Quantum Design (MPMS-5S) SQUID at 10 K and 300 K respectively. Non-magnetic filter paper was soaked with 15 μL liquid sample and placed inside non-magnetic empty gelatin capsules. These gelatin capsules were further mounted inside a non-magnetic measuring straw for insertion into the SQUID. Two types of measurements were made: in the first magnetization loops, M(H) were obtained by cyclically sweeping the field (H) from negative to positive values at fixed temperatures (T) and in the second temperature-dependent magnetization, M(T) was determined in both field-cooled (FC) and zero-field-cooled (ZFC) conditions. The external field could be varied to values as high as 50 kOe.
MRI
MRI experiments for Fe doped MQDs in water and in cells incubated with MQDs were performed using a 12 mm solenoid RF coil for signal transition and reception on an Agilent 4.7 T system at room temperature. MRI phantoms using glass tubes were prepared from Fe doped MQDs having concentrations of 9.7, 4.9, 2.4, 1.2, 0.6, 0.3 mM Fe and DI water as blank. T2 weighted MR images of the samples were acquired using a multi-slice, multi-echo spin-echo (TR and TE) sequence with the following parameters: repetition time TR 11000 ms, echo time TE 10 ms with echo spacing of 10 ms for a total of 66 echoes, a matrix 128 × 64, FOV 15 × 10 mm2 and slice thickness of 1.0 mm. Decay of signal intensity as a function of TE was utilized to calculate the T2 values by single exponential fitting of the echo train from regions of interest (ROI). 1/T2 values were plotted against increasing Fe concentrations and transverse relaxivity (r2) of the MQDs was determined from the slope of the plot.
Optical imaging
The glass tubes containing MQDs having concentrations 9.7, 4.9, 2.4, 1.2, 0.6, 0.3 mM Fe and DI water as blank were imaged using Xenogen IVIS® Spectrum Biophotonic Imager with 675 nm excitation and 740 nm emission filters. The 9.7 mM Fe containing solution had a particle concentration of 13.8 mg ml-1. The glass capillary containing 9.7 mM Fe was further imaged inside a mouse phantom, XFM-2 Fluorescent Phantom (PN 121365), using a 675 nm excitation and 740 nm emission filter at 7.2 mm and 18.2 mm dorsal depths. The imaging software used was Living Image® 4.1.
MQD uptake by J774 cells
Mouse macrophage/monocytic J774 cells were grown using standard Dulbecco's modified eagle's medium (DMEM), supplemented with 10% fetal bovine serum, glutamax and penicillin/streptomycin. Prior to labeling, 1 × 10⁶ cells/ml DMEM were seeded into 4-well chamber slides and allowed to attach before subsequent incubation at 37 °C with 200 μg/ml each of MQD738 and Feridex® I. V. NPs in water for 6 hours.
3. Results and discussion
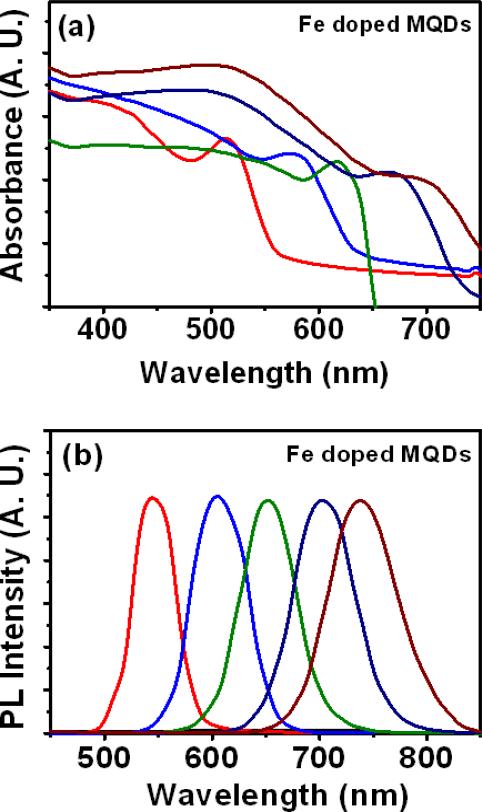
The synthesis of vis-NIR emitting, magnetic and water dispersible Fe doped MQDs using hydrothermal route is outlined in Figure 1. The synthesis of magnetically doped MQDs is typically carried out in oil3, 31, 35-38, 42 with the aid of surface coordinating agents and surfactants. Although the as prepared organometallic MQDs usually have high photoluminescence and quantum yields (QYs), further surface treatments to make them water dispersible leads to significant QY reduction. In comparison, hydrothermal route possesses two main advantages over conventional methods of MQD synthesis. First, this method allows the synthesis of magnetic NIR QDs without using the toxic precursors and reagents commonly used in the organometallic route42. Secondly, the as prepared MQDs are highly water dispersible, they do not require further surface treatments to modify dispersion. Moreover, the capping of these MQDs with a non-toxic N-Acetyl-Cysteine (NAC) stabilizes aqueous dispersion and also allows bioconjugation43. NAC can protect cells from MQD induced cytotoxicity and oxidation because of its known antioxidant44 property. Hydrothermal synthesis allows high temperature synthesis of the MQDs in aqueous media, thus significantly accelerating nanocrytal growth rates and improving the efficiency of the synthesis technique. Fe doped CdTeS MQDs emitting at 530-738 nm were prepared by reacting CdCl2 with NaHTe and NAC at a constant temperature of 180 °C in teflon-lined autoclaves maintaining the Cd:Te:NAC molar ratio at 2:1:2.5. The Cd:Fe molar ratio was kept constant at 8.5:1. Addition of excess Fe led to complete fluorescent quenching of the MQDs. The pH of the precursor solution was maintained within the range of 8.1 to 8.4, throughout the synthesis. For the Fe doped MQDs, the absorption and emission peaks gradually red shifted (Figure 2) with increase in heating time accompanied with changing full width at half maximum (FWHM). Change in reaction time from 70 to 99 minutes produced first absorption peak shift from 600 to 676 nm, while the PL emission peak shifted from 625 to 738 nm. These results illustrate that the size of the MQDs and their corresponding emission wavelengths can be tuned by simply varying the heating time of the precursor solution. Detailed information about the optical properties of the Fe doped MQDs at different reaction times viz. first absorption peak, PL emission peak, Stokes Shift, FWHM and QY are listed in Table 1.
Figure 1.
Flowchart for the synthesis of magnetic Fe doped CdTeS MQDs using hydrothermal technique.
Figure 2.
(a) Absorbance and (b) PL spectra for Fe doped CdTeS MQDs when excited at 300 nm, where the Cd:NAC and Cd:Fe molar ratios were set to 1:2.5 and 8.5:1 respectively ([Cd2+]=30 mM).
Table 1.
First absorption peak (λAb), PL emission peak (λEm), Stokes shift, full width at half maximum (FWHM), quantum yield (QY) of Fe doped MQDs at different reaction times from 70 to 99 minutes.
| Reaction Time (min) | λAb (nm) | λEm (nm) | Stoke Shift (nm) | FWHM (nm) | QY(%) |
|---|---|---|---|---|---|
| 70 | 600 | 625 | 25 | 49 | 67.5 |
| 88 | 650 | 679 | 29 | 67 | 33.3 |
| 93 | 668 | 698 | 30 | 67 | 26.7 |
| 94 | 671 | 711 | 40 | 69 | 27.2 |
| 97 | 673 | 730 | 57 | 65 | 22.5 |
| 99 | 676 | 738 | 62 | 76 | 10.0 |
It is noted that the Stoke shift, defined as the difference in wavelength between first absorption peak and the emission peak, increased for NIR emitting MQDs. Higher stoke shift is desirable for bioimaging applications, since it minimizes excitation-emission wavelength overlap. Also, the MQD emission spectra obtained are narrow and symmetric for visible emitting MQDs and become broader for those that emit in the NIR. The FWHM for the MQDs varied within 49 nm to 76 nm, similar to those observed in case of thiol capped CdTe/CdS QDs40. The QY for the Fe doped CdTeS MQDs emitting in the 530-738 nm (samples were labeled as MQD530-MQD738) region varied within 10-67.5%. It has been observed, that by the hydrothermal method, Fe doped NIR MQDs can be synthesized much faster compared to some of the reported techniques adopted for NIR emitting MQD synthesis in aqueous solutions that required several hours to even days for the reaction to be completed45. Heating the MQDs for more than 99 minutes produced agglomeration and subsequent quenching of the MQD fluorescence. This phenomenon may be attributed to hydrolysis and subsequent decomposition of the thiols, resulting in the depletion of ligands required to stabilize the MQDs at the later stage of the reaction40, 45.
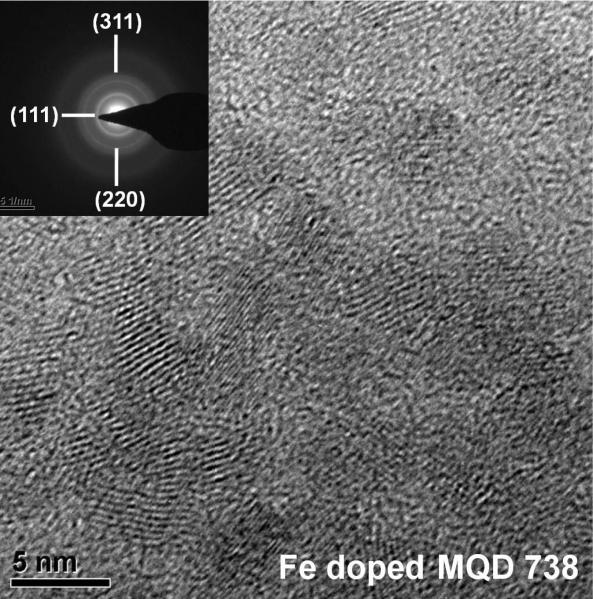
The MQDs were characterized using XRD, TEM, EDX and Xenogen IVIS® Spectrum Biophotonic Imager to investigate their size, structure and chemical composition. From the TEM images, sizes of the MQDs were found to lie between 3-6 nm. The measured size of Fe doped MQD738 is 4.9 (±0.7) nm. The crystalline nature of the MQDs is demonstrated by the presence of well-resolved lattice fringes in the TEM image (Figure 3). DLS characterizations were performed to investigate the MQD particle sizes and size distributions. MQD537 and MQD642 were determined to have hydrodynamic diameters of 2.8 nm and 12.2 nm respectively (Figure S1) and have narrow size distributions. The hydrodynamic diameter is usually larger than the actual diameter measured using TEM, the difference attributed to the thickness of the capping agent, NAC, surrounding the MQDs.
Figure 3.
TEM image of Fe doped CdTeS MQDs emitting at 738 nm. Inset shows SAD pattern.
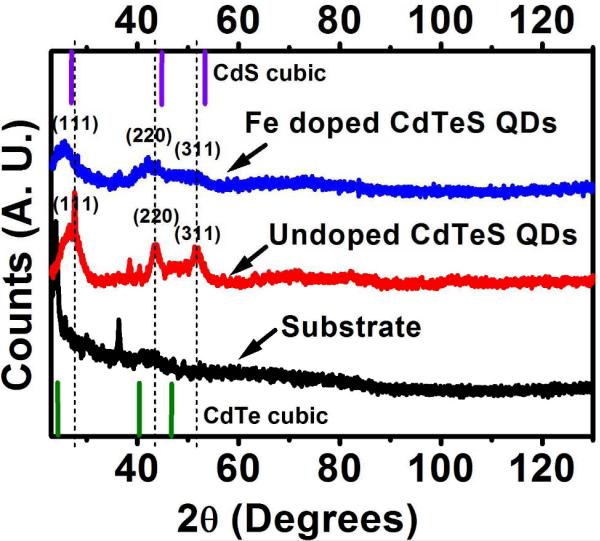
The MQDs emitting above 720 nm, however, exhibited relatively broader particle size distributions and larger hydrodynamic diameters compared to those emitting at lower wavelengths. This indicates the possibility of MQD agglomeration, as discussed earlier, due to thiol hydrolysis and subsequent degradation of the stabilizing NAC, when heated for longer times. The XRD pattern (Figure 4) exhibits three main peaks which correspond to the (111), (220) and (311) planes indicating zinc blende structure.
Figure 4.
XRD of Fe doped and undoped CdTeS MQDs. The line spectra show the cubic CdS and CdTe reflections with their relative intensities.
The nanocrystalline nature of the MQD samples was evident from the broad nature of the XRD peaks. XRD on both undoped QDs and Fe doped MQDs was performed and a small shift of the diffraction peaks for Fe doped MQDs was observed towards lower 2θ when compared to undoped MQDs. The XRD peaks of the Fe doped MQDs are relatively less sharp than those of the undoped MQDs. The d value for (111) in undoped MQDs was found to be 3.59 Å, whereas for Fe doped MQDs it is 4.71 Å. All of these observations, viz. change in lattice parameter along with XRD peak shift toward lower 2θ and decrease in peak sharpness indicate structural modification of the MQDs with Fe doping. No diffraction peak related to Fe precipitates or iron impurity phase was detected, demonstrating the formation of Fe:CdTeS solid solution and doping of Fe into the crystal lattice of CdTeS. The crystallite size of the Fe doped MQDs was calculated using the Scherrer formula:
| (1) |
where, D is the grain size, λ is the wavelength of x-ray radiation (0.1541 nm), K is the constant usually taken as 0.89, and β is the peak width at half maximum height. From equation (1) the grain size of Fe doped MQD738 was estimated to be 5.2 (±0.1) nm which is in agreement with the diameter obtained from the TEM image.
Sizes obtained from TEM and XRD for another sample, MQD730 were also compared. For MQD730, sizes measured from TEM and XRD were found to be 4.4 ± 0.3 and 4.4 ± 0.1 nm, respectively. As in the case of MQD738, for this sample too the TEM and XRD sizes are in close agreement.
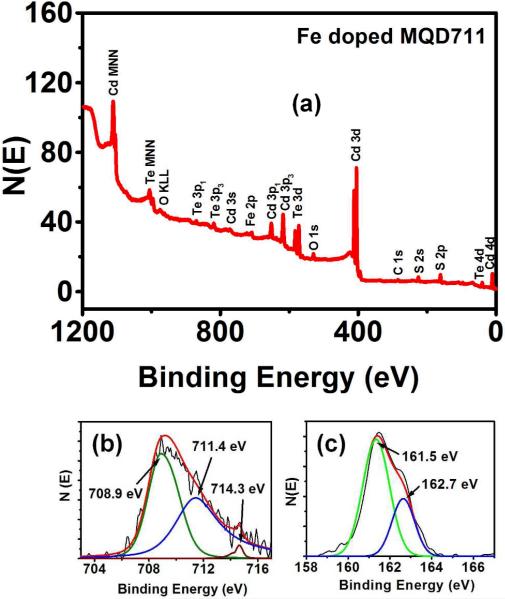
The elemental composition of Fe doped MQDs 738 as determined by EDS (Figure S2) and ICP are given in Table S1. The amount of Fe present in MQD738 is 5.6 atomic% as determined by ICP, which is close to the value obtained using EDS. ICP measurements (Table S2) for MQD730 showed Fe content of 3.1 atomic%. EDS could not detect the presence of Fe in MQD730, probably due to the small amount present. A close quantitative agreement for the Cd, Te, and S values was observed for the two different methods. ICP analysis of the undoped samples illustrates (Table S2) alloyed QD compositions, indicating S incorporation into the QDs during nanoparticle growth obtained from the hydrolysed thiols. The addition of thiols primarily served to stabilize the nanoparticles and in passivating the surface trapping states, that originate from the dangling bonds, thus improving the QY of the QDs46. Following this reasoning, although, thiol hydrolysis seems to be detrimental to the QY of the QDs, the substitution of some of the Te atoms with S atoms favoured not only the improvement of the QY but also in achieving higher emission wavelengths46. Further characterization of the surface structure with XPS provided information regarding the type and nature of the elements constituting the MQDs. The XPS results are illustrated in Figure 5. The typical peaks of the elements Cd, Te, Fe and S are distinguishable. Cd and Te peaks with the following binding energies Cd 3d5/2 (404.9 eV), Cd 3d3/2 (411.8 eV), Te 3d5/2 (572.2 eV) Te 3d3/2 (582.6 eV) were obtained (Figure S3).The Fe 2p3/2 peaks were identified at 708.9 eV, 711.4 eV and 714.3 eV (Figure 5b) along with the S 2p peaks at 161.5 and 162.7 eV (Figure 5c). From the NIST database the 708.9 nm and 711.4 nm peaks are attributed to the presence of Fe4+ and Fe2+ ions respectively in the MQDs while S 2p3/2 peaks at 161.5 eV and 162.7 eV are due to the presence of S2- and S4- respectively, indicating the presence of Fe-S2 and Fe-S type units in the MQDs.
Figure. 5.
(a) XPS spectra for the Fe doped MQDs emitting at 711 nm (b) Fe2p3/2 peaks and (c) S2p peaks after Argon sputtering for 10 min.
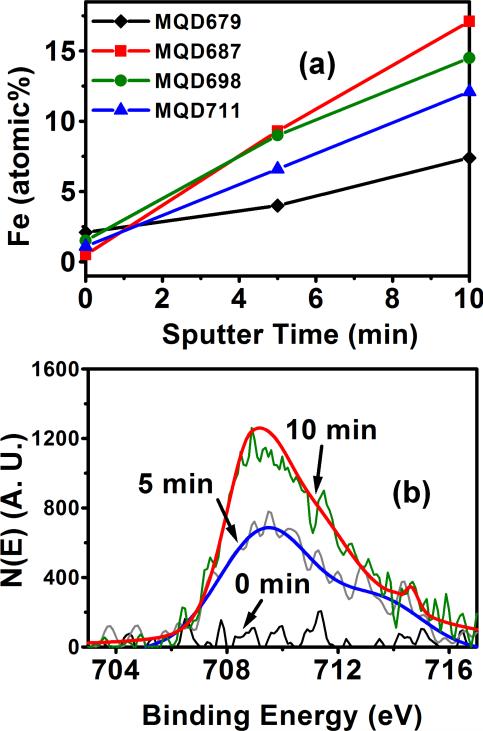
To further characterize the Fe doped MQDs depth profile experiments with XPS were conducted. MQD679, MQD687, MQD698 and MQD711 were analyzed with XPS after sputtering with Ar for 0, 5 and 10 minutes. With increase in sputtering time (Figure 6a) the Fe atomic% increases, demonstrating that the MQDs have Fe rich core and the Fe content diminishes toward the periphery of the MQDs. The XPS spectra of Fe2p3/2 peak after sputtering MQD711 with Ar for 0, 5 and 10 minutes is illustrated in Figure 6b. From the figure, it is evident that there is substantial amount of Fe present toward the centre of MQD711. Xie et al47 have reported similar observations for Fe doped ZnSe MQDs, where more Fe was present in the interior of the MQDs than on the surface.
Figure. 6.
(a) Fe atomic% versus sputter time for Fe doped MQDs emitting at 679, 687, 698 and 711 nm. (b) XPS spectra of Fe2p3/2 peak after sputtering MQD711 with Ar for 0, 5 and 10 minutes.
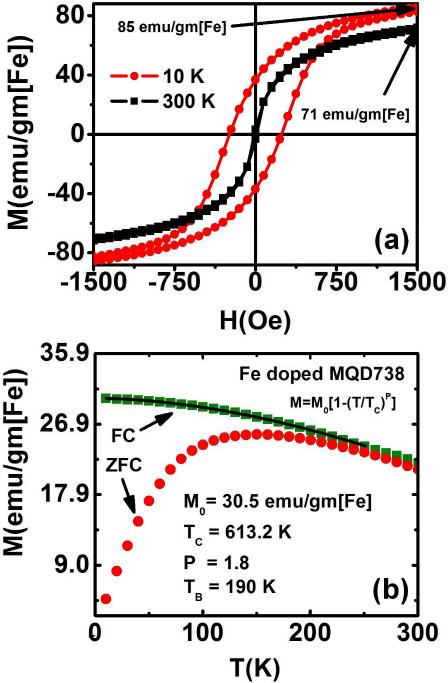
Magnetization loop measurements of the MQDs using a superconducting quantum interference device (SQUID) show presence of ferromagnetism at low temperature indicated by the hysteresis loop observed during M vs H measurement (Figure 7). The magnetizations are normalized to total Fe content of the MQDs. Saturation magnetization measurements (Ms) were carried out for MQDs emitting at various wavelengths in the 530-738 nm range at temperatures 10 K and 300 K. MQDs emitting between 650-738 nm exhibited significant magnetization when subjected to a varying external magnetic field over the range −50 to 50 kOe at constant temperature.
Figure 7.
(a) Magnetometry measurements using SQUID at 10K and 300K of 738 nm emitting Fe doped CdTeS per unit iron and (b) Temperature dependent magnetization of 738 nm emitting Fe doped CdTeS MQDs measured at a constant magnetic field of 80 Oe. (FC – field cooled, ZFC – zero field cooled)
The saturation magnetization values of the Fe doped MQDs with respect to the Fe content are depicted in Figure 7 and the Ms values for MQD738 (3.9 wt% Fe) are 85 emu/gm[Fe] (10 K) and 71 emu/gm[Fe] (300 K). For comparison, the saturation magnetization of Feridex® I.V. NPs (10.4 wt% Fe) was also measured and found to be 119 emu/gm[Fe] (10 K) and 72 emu/gm[Fe] (300 K) (Figure S4). The reported Ms value for Feridex® I.V. at room temperature is 64.4 emu/gm[Fe]48.The Ms value obtained for the Fe doped MQD738 at room temperature is comparable to that of Feridex® I.V. NPs.
In the zero-field-cooled (ZFC) measurements the MQD and Feridex® I.V. samples were cooled without any applied magnetic field to a temperature much below the anticipated blocking temperature, TB which is near the peaks in the ZFC curves. Then the relatively low fixed magnetic field of 80 Oe is applied and the temperature of the system was raised to obtain the ZFC magnetization. The field-cooled (FC) magnetization measurements were carried out by cooling the sample in the same magnetic field (80 Oe) and magnetization measured as a function of increasing temperature.
The temperature dependent magnetizations, M versus T curves for both FC and zero-field-cooled ZFC cases were plotted for MQD738 and Feridex® I.V. NPs. The blocking temperatures (TB) for the NPs were determined from the peaks of the ZFC curves. As the samples were heated the transition from ferromagnetism to super paramagnetism occurred near the blocking temperature. The free movements of the magnetic moments in the samples were ‘blocked’ at temperatures below TB by the anisotropy leading to their ferromagnetic behaviour. Above TB the NPs exhibit super paramagnetic behavior. From the curves, TB for MQD738 was determined to be 190 K (Figure 7b).
The M vs H measurements of the MQDs depicted negligible coercivity at room temperature (Figure 7a). This observation is consistent with superparamagnetic behavior shown by the MQDs. The temperature range above the blocking temperature was however insufficient to convincingly confirm superparamagnetic behaviour by demonstrating the collapse of the magnetization curves onto a single curve when plotted against the ratio H/T. However, coercivity was found to be present when their magnetic properties were measured at 10 K. The 10 K magnetization loops show hysteresis with coercive fields, Hc ~ 240 Oe for MQD738 particle (Figure 7) and Hc~ 90 Oe for Feridex® I.V. (Figure S4).
Further analysis was done by fitting the FC curve with Bloch's T 3/2 equation (Figure 7b) in the region 10 K-200 K (T << Tc):
| (2) |
where, M0 is the spontaneous magnetization at zero temperature (emu/gm), Tc the estimated Curie temperature (K) of the bulk material and P a power-law exponent. We obtain Tc ~ 613.2 K for MQD738 and Tc ~283.1 K for Feridex® I.V. (Figure S4). For MQD738, the Curie temperature, Tc is above room temperature. The values of parameter P obtained from equation (2) for MQD738 and Feridex® I.V. NPs are ~ 1.8 and 1.2 respectively. The ideal value for Bloch parameter P should be 3/2, here the P values are scattered around value 1.5. This result indicates that all these MQDs are only qualitatively consistent with Bloch's T 3/2 law. From these magnetization data we conclude that Fe doped MQDs show ferromagnetism at low temperatures, which is evident from their magnetization loops with non-zero Hc values and low field saturation. Magnetization measurements for MQD730 showed results similar to MQD738. Figure S5(a) shows the saturation magnetization values of the Fe doped MQD730 with respect to the Fe content. The Ms value obtained for MQD730 (2.2 wt% Fe) at both 10 K and 300 K is ~ 76 emu/gm[Fe]. The temperature dependent magnetizations, M versus T curves for MQD730 are illustrated in Figure S5(b).
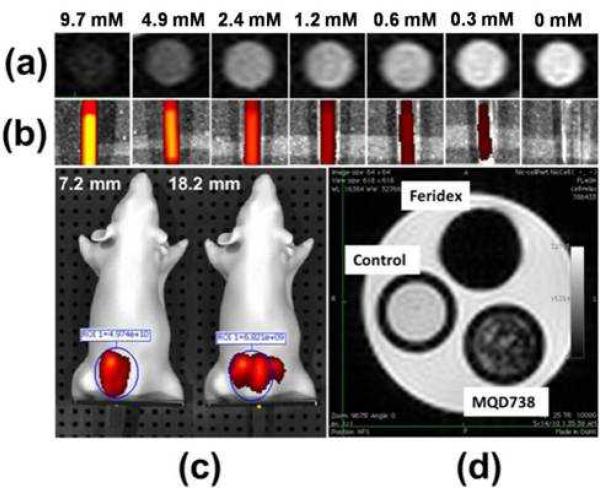
Investigations in solution, using cells in culture and in mouse phantom were performed to demonstrate the utility of the Fe doped MQDs as bio-imaging agents. One of the main advantages of hydrothermal synthesis, is that no further surface modification, post coating or ligand exchange is necessary for dispersing the MQDs during biological experiments in aqueous environment. The as prepared MQDs are highly dispersible in aqueous media. MR and optical imaging experiments were performed to establish that the Fe content was sufficient for generating contrast in MRI and that the QY was sufficient for contrast in optical images. Local perturbation in the magnetic moments of the proton (1H) in water when subjected to a strong magnetic field produces the MRI signal. In clinical contrast mechanisms differences in transverse or longitudinal proton relaxation times, T2 or T1 respectively due to tissue-specific proton density variations give rise to the MRI contrast. In the absence of significant difference in tissue relaxation times, a paramagnetic exogenous agent may be utilized to enhance contrast. They decrease the 1H relaxation times of the surrounding water and generate MRI contrast. The effectiveness of a paramagnetic material to generate contrast is measured by a parameter, relaxivity, which is defined as the relaxation-rate change per unit concentration of contrast agent40. Fe doped MQDs produced T2 contrast, due to Fe functioning as T2 contrast agent. MRI of the MQDs dispersed in water and having concentrations of 9.7, 4.9, 2.4, 1.2, 0.6, 0.3 mM Fe with water as a blank was performed. The measurement of relaxation time T2 in 4.7 T at room temperature was done using a T2 weighted spin-echo sequence. The T2-weighted images are shown in Figure 8(a).
Figure 8.
(a) T2 weighted images of Fe doped MQD738 inside glass capillaries at various Fe concentrations at 4.7 T, 200 MHz. (b) Corresponding fluorescence images from the MQDs using Xenogen IVIS® Spectrum Biophotonic Imager after exciting them at 675 nm. (c) Fluorescence image of the MQDs of concentration 9.7 mM Fe (13.8 mg/ml particle concentration) inside mouse phantom at dorsal depths of 7.2 mm (left) and 18.2 mm (right), using excitation 675 nm and emission 740 nm filters (d) T2 weighted images of J774 macrophages labeled with 200 μg/ml (0.14 mM Fe) Fe doped MQD738 and 200 μg/ml (0.37 mM Fe) Feridex® I.V. NPs imaged at 4.7 T, 200 MHz.
As expected with T2 weighting, higher Fe concentration produced larger signal intensity decrements (top row). The relaxivity, r2 for the Fe doped MQD738 was determined to be 3.6 mM-1s-1. Although the r2 value of Fe doped MQD738 is lower than that of Feridex® I. V. NPs (111.5 mM-1s-1)49, the MR images in Figure 8(a) illustrate that the amount of Fe doping in the MQDs is sufficient to produce MR contrast. Same concentration of the MQDs used for MR imaging was imaged in the Xenogen IVIS® Spectrum Biophotonic Imager using excitation of 675 nm to demonstrate that they are also brightly luminescent. As illustrated in Figure 8(b), higher concentration of Fe MQDs produced brighter luminescence. The high luminescence efficiency of the MQDs is illustrated by the high intensity of emission observed even at low concentrations of the MQDs used in this experiment. The 9.7 mM Fe (13.8 mg/ml) doped MQD738 was also imaged inside a mouse phantom. The XFM-2 Fluorescent Phantom is a mouse shaped IVIS accessory, made up of polyurethane polymer that includes particles to mimic scattering, and fluorescent dye to simulate the optical properties of live tissue. This phantom contains cavities that can accommodate thin capillaries. As depicted in Figure 8(c), bright luminescence of the MQDs (using a 740 nm emission filter) was observed inside the phantom when excited with 675 nm excitation at dorsal depths of 7.2 mm (left) and 18.2 mm (right). Fluorescent signals from both the positions were observed unmistakably with minimal interference from the tissue material. To determine the difference in the emission intensities at the two depths, same region of interest (ROI) was selected over the luminescent area. Radiant efficiency [(photons/sec/cm2/sr)/(μW/cm2)] of the ROIs was found to decrease from (4.9 × 10¹⁰) to (6.8 × 10⁹) for corresponding change in dorsal depth from 7.2 mm to 18.2 mm. In addition, the fluorescent emission from 18.2 mm depth was observed to be more diffused and scattered over a larger volume. The observed decrease in radiant efficiency and diffused scattering for MQDs placed at 18.2 mm dorsal depth relative to those at 7.2 mm are due to larger scattering of the emitted photons from greater depths. These results along with NIR emission properties of the MQDs indicate their potential for deep tissue in vivo imaging inside live animals.
To assess the utility of the bimodal MQDs for biological applications, they were applied to cells in culture. J774 macrophages were incubated with MQD738 at a concentration of 0.37 mM Fe in water for 6 hours. The cells containing the MQDs were then injected into the phantoms and subjected to MR imaging. For comparison, cells without MQDs and cells with Feridex® I. V. NPs were imaged along with cells containing Fe doped MQD738. The differences in MRI contrast generated by these cells are shown in Figure 8(d). The T2 contrast generated by cells containing the MQDs is intermediate between that generated by those containing Feridex® I. V. NPs and the blank phantom containing cells without any particles. This demonstrates the contrast generating capacity of the Fe doped MQDs. These results illustrate that the same range of applied concentrations of Fe doped MQDs can produce both optical and MR contrast and demonstrate the dual-mode imaging capability of these MQDs.
In conclusion, we report a novel aqueous based hydrothermal technique to produce vis-NIR emitting MQDs that could be used for combined optical and MR biological imaging applications. The MQDs synthesized by the hydrothermal technique are not only fluorescent and magnetic, hence useful for bimodal imaging, but are also smaller in size. Furthermore, for producing bimodal nanoparticles, one pot hydrothermal synthesis is a relatively simpler technique in comparison to the conventional methods that employ multiple steps. The technique described here permits the incorporation of Fe ions, up to a specified amount, into NIR emitting MQDs without compromising the PL QY. This represents a significant breakthrough in the design and development of bimodal NIR emitting aqueous based MQDs. The Fe content in the MQDs is variable and can easily be modified. The maximum amount of Fe that could be doped into the MQDs without compromising the fluorescent property was found to be 5.6 atomic%. Above this amount Fe produces significant quenching of the MQD fluorescence. The MQDs in the visible region have room temperature high quantum yield of 35-67.5% while those in the NIR region exhibit 10-35% QY. The superparamagnetic nature of the MQDs was established using SQUID magnetometry measurements at 10K and 300K and their superparamagnetic property was found to be similar to Feridex® I.V. NPs. The MRI results demonstrate that these magnetic MQDs can serve as effective T2 contrast agents. The applications of these MQDs might include but not limited to tracking of live cells, cancer diagnosis and therapy.
Supplementary Material
Acknowledgments
We thank Major Analytical Instrumentation Center (MAIC) at the University of Florida for assistance with XRD, XPS and TEM characterization of the MQDs. MRI data were obtained at the Advanced Magnetic Resonance Imaging and Spectroscopy (AMRIS) facility in the McKnight Brain Institute of the University of Florida. This project was supported by the National Science Foundation's “Nanotechnology Interdisciplinary Research Team (NIRT)” Grant No. 0506560, CPaSS Grant No. 0749481, Grant No. 1005301 (AFH), NHLBI – NIH P01 HL59412, National High Magnetic Field Laboratory. The authors thank Dr. Paul Holloway, Professor, Materials Science and Engineering, University of Florida for fruitful discussions.
Footnotes
Electronic Supplementary Information (ESI) available: See DOI: 10.1039/b000000x/
Notes and references
- 1.Lee DE, Koo H, Sun IC, Ryu JH, Kim K, Kwon IC. Chem Soc Rev. 2012;41:2656–2672. doi: 10.1039/c2cs15261d. [DOI] [PubMed] [Google Scholar]
- 2.Sharma P, Singh A, Brown SC, Bengtsson N, Walter GA, Grobmyer SR, Iwakuma N, Santra S, Scott EW, Moudgil BM. Methods Mol Biol. 2010;624:67–81. doi: 10.1007/978-1-60761-609-2_5. [DOI] [PubMed] [Google Scholar]
- 3.Li IF, Yeh CS. Journal of Materials Chemistry. 2010;20:2079–2081. [Google Scholar]
- 4.Liu Z, Liu X, Yuan QH, Dong K, Jiang LY, Li ZQ, Ren JS, Qu XG. Journal of Materials Chemistry. 2012;22:14982–14990. [Google Scholar]
- 5.Louie AY. Chemical Reviews. 2010;110:3146–3195. doi: 10.1021/cr9003538. [DOI] [PMC free article] [PubMed] [Google Scholar]
- 6.Hu D, Chen M, Gao Y, Li FY, Wu LM. Journal of Materials Chemistry. 2011;21:11276–11282. [Google Scholar]
- 7.Ma ZY, Dosev D, Nichkova M, Gee SJ, Hammock BD, Kennedy IM. J Mater Chem. 2009;19:4695–4700. doi: 10.1039/b901427f. [DOI] [PMC free article] [PubMed] [Google Scholar]
- 8.Koole R, van Schooneveld MM, Hilhorst J, Castermans K, Cormode DP, Strijkers GJ, Donega CD, Vanmaekelbergh D, Griffioen AW, Nicolay K, Fayad ZA, Meijerink A, Mulder WJM. Bioconjugate Chemistry. 2008;19:2471–2479. doi: 10.1021/bc800368x. [DOI] [PMC free article] [PubMed] [Google Scholar]
- 9.Zhou LJ, Gu ZJ, Liu XX, Yin WY, Tian G, Yan L, Jin S, Ren WL, Xing GM, Li W, Chang XL, Hu ZB, Zhao YL. Journal of Materials Chemistry. 2012;22:966–974. [Google Scholar]
- 10.Mattoussi H, Palui G, Na HB. Advanced Drug Delivery Reviews. 2012;64:138–166. doi: 10.1016/j.addr.2011.09.011. [DOI] [PubMed] [Google Scholar]
- 11.Koole R, Mulder WJM, van Schooneveld MM, Strijkers GJ, Meijerink A, Nicolay K. Wiley Interdisciplinary Reviews-Nanomedicine and Nanobiotechnology. 2009;1:475–491. doi: 10.1002/wnan.14. [DOI] [PubMed] [Google Scholar]
- 12.Alivisatos AP, Gu WW, Larabell C. Annual Review of Biomedical Engineering. 2005;7:55–76. doi: 10.1146/annurev.bioeng.7.060804.100432. [DOI] [PubMed] [Google Scholar]
- 13.Bruchez M, Moronne M, Gin P, Weiss S, Alivisatos AP. Science. 1998;281:2013–2016. doi: 10.1126/science.281.5385.2013. [DOI] [PubMed] [Google Scholar]
- 14.Gu YP, Cui R, Zhang ZL, Xie ZX, Pang DW. J Am Chem Soc. 2012;134:79–82. doi: 10.1021/ja2089553. [DOI] [PubMed] [Google Scholar]
- 15.He Y, Zhong YL, Su YY, Lu YM, Jiang ZY, Peng F, Xu TT, Su S, Huang Q, Fan CH, Lee ST. Angewandte Chemie-International Edition. 2011;50:5694–5697. [Google Scholar]
- 16.Smith AM, Nie S. J Am Chem Soc. 2011;133:24–26. doi: 10.1021/ja108482a. [DOI] [PMC free article] [PubMed] [Google Scholar]
- 17.Won N, Jeong S, Kim K, Kwag J, Park J, Kim SG, Kim S. Mol Imaging. 2012;11:338–352. [PubMed] [Google Scholar]
- 18.Rosenblum LT, Kosaka N, Mitsunaga M, Choyke PL, Kobayashi H. Contrast Media & Molecular Imaging. 2011;6:148–152. doi: 10.1002/cmmi.409. [DOI] [PMC free article] [PubMed] [Google Scholar]
- 19.Gu HW, Zheng RK, Zhang XX, Xu B. Journal of the American Chemical Society. 2004;126:5664–5665. doi: 10.1021/ja0496423. [DOI] [PubMed] [Google Scholar]
- 20.Selvan ST, Patra PK, Ang CY, Ying JY. Angewandte Chemie-International Edition. 2007;46:2448–2452. doi: 10.1002/anie.200604245. [DOI] [PubMed] [Google Scholar]
- 21.Kim H, Achermann M, Balet LP, Hollingsworth JA, Klimov VI. Journal of the American Chemical Society. 2005;127:544–546. doi: 10.1021/ja047107x. [DOI] [PubMed] [Google Scholar]
- 22.Xie HY, Zuo C, Liu Y, Zhang ZL, Pang DW, Li XL, Gong JP, Dickinson C, Zhou WZ. Small. 2005;1:506–509. doi: 10.1002/smll.200400136. [DOI] [PubMed] [Google Scholar]
- 23.Hong X, Li J, Wang MJ, Xu JJ, Guo W, Li JH, Bai YB, Li TJ. Chemistry of Materials. 2004;16:4022–4027. [Google Scholar]
- 24.Yi DK, Selvan ST, Lee SS, Papaefthymiou GC, Kundaliya D, Ying JY. J Am Chem Soc. 2005;127:4990–4991. doi: 10.1021/ja0428863. [DOI] [PubMed] [Google Scholar]
- 25.Kim J, Lee JE, Lee J, Yu JH, Kim BC, An K, Hwang Y, Shin CH, Park JG, Kim J, Hyeon T. Journal of the American Chemical Society. 2006;128:688–689. doi: 10.1021/ja0565875. [DOI] [PubMed] [Google Scholar]
- 26.V S-M, Correa-Duarte MA, Spasova M, Liz-Marzan LM, Farle M. Advanced Functional Materials. 2006;16:509–514. [Google Scholar]
- 27.Mulder WJM, Koole R, Brandwijk RJ, Storm G, Chin PTK, Strijkers GJ, Donega CD, Nicolay K, Griffioen AW. Nano Letters. 2006;6:1–6. doi: 10.1021/nl051935m. [DOI] [PubMed] [Google Scholar]
- 28.Yang HS, Santra S, Walter GA, Holloway PH. Advanced Materials. 2006;18:2890. [Google Scholar]
- 29.Gerion D, Herberg J, Bok R, Gjersing E, Ramon E, Maxwell R, Kurhanewicz J, Budinger TF, Gray JW, Shuman MA, Chen FF. Journal of Physical Chemistry C. 2007;111:12542–12551. [Google Scholar]
- 30.Fernandez B, Galvez N, Cuesta R, Hungria AB, Calvino JJ, Dominguez-Vera JM. Advanced Functional Materials. 2008;18:3931–3935. [Google Scholar]
- 31.Archer PI, Santangelo SA, Gamelin DR. Nano Letters. 2007;7:1037–1043. doi: 10.1021/nl0702362. [DOI] [PubMed] [Google Scholar]
- 32.Zheng WW, Kumar P, Washington A, Wang ZX, Dalal NS, Strouse GF, Singh K. Journal of the American Chemical Society. 2012;134:2172–2179. doi: 10.1021/ja2088426. [DOI] [PubMed] [Google Scholar]
- 33.Zheng WW, Strouse GF. Journal of the American Chemical Society. 2011;133:7482–7489. doi: 10.1021/ja200508e. [DOI] [PubMed] [Google Scholar]
- 34.Santra S, Yang HS, Holloway PH, Stanley JT, Mericle RA. Journal of the American Chemical Society. 2005;127:1656–1657. doi: 10.1021/ja0464140. [DOI] [PubMed] [Google Scholar]
- 35.Wang S, Jarrett BR, Kauzlarich SM, Louie AY. Journal of the American Chemical Society. 2007;129:3848–3856. doi: 10.1021/ja065996d. [DOI] [PMC free article] [PubMed] [Google Scholar]
- 36.Poddar P, Sahoo Y, Srikanth H, Prasad PN. Applied Physics Letters. 2005:062506-1–062506-3. [Google Scholar]
- 37.Sahoo Y, Poddar P, Srikanth H, Lucey DW, Prasad PN. Journal of Physical Chemistry B. 2005;109:15221–15225. doi: 10.1021/jp050202n. [DOI] [PubMed] [Google Scholar]
- 38.Singh N, Charan S, Sanjiv K, Huang SH, Hsiao YC, Kuo CW, Chien FC, Lee TC, Chen PL. Bioconjugate Chemistry. 2012;23:421–430. doi: 10.1021/bc200435e. [DOI] [PubMed] [Google Scholar]
- 39.Yong KT. Nanotechnology. 2009;20:015102. doi: 10.1088/0957-4484/20/1/015102. [DOI] [PubMed] [Google Scholar]
- 40.Zhao D, He ZK, Chan WH, Choi MMF. Journal of Physical Chemistry C. 2009;113:1293–1300. [Google Scholar]
- 41.Bera D, Qian L, Tseng TK, Holloway PH. Materials. 2010;3:2260–2345. [Google Scholar]
- 42.Qu LH, Peng ZA, Peng XG. Nano Letters. 2001;1:333–337. [Google Scholar]
- 43.Xue B, Deng DW, Cao J, Liu F, Li X, Akers W, Achilefu S, Gu YQ. Dalton Transactions. 2012;41:4935–4947. doi: 10.1039/c2dt12436j. [DOI] [PubMed] [Google Scholar]
- 44.Xue CB, Liu W, Wu JH, Yang XL, Xu HB. Toxicology in Vitro. 2011;25:110–116. doi: 10.1016/j.tiv.2010.09.014. [DOI] [PubMed] [Google Scholar]
- 45.Mao WY, Guo J, Yang WL, Wang CC, He J, Chen JY. Nanotechnology. 2007:485611-1–485611-7. [Google Scholar]
- 46.Borchert H, Talapin DV, Gaponik N, McGinley C, Adam S, Lobo A, Moller T, Weller H. Journal of Physical Chemistry B. 2003;107:9662–9668. [Google Scholar]
- 47.Xie RS, Li YL, Liu LY, Yang L, Xiao DQ, Zhu JG. Materials Characterization. 2011;62:582–587. [Google Scholar]
- 48.Lee N, Kim H, Choi SH, Park M, Kim D, Kim HC, Choi Y, Lin S, Kim BH, Jung HS, Kim H, Park KS, Moon WK, Hyeon T. Proceedings of the National Academy of Sciences of the United States of America. 2011;108:2662–2667. doi: 10.1073/pnas.1016409108. [DOI] [PMC free article] [PubMed] [Google Scholar]
- 49.Yang XQ, Hong H, Grailer JJ, Rowland IJ, Javadi A, Hurley SA, Xiao YL, Yang YA, Zhang Y, Nickles R, Cai WB, Steeber DA, Gong SQ. Biomaterials. 2011;32:4151–4160. doi: 10.1016/j.biomaterials.2011.02.006. [DOI] [PMC free article] [PubMed] [Google Scholar]
Associated Data
This section collects any data citations, data availability statements, or supplementary materials included in this article.


