Abstract
An 8-channel planar phased array was proposed based on the common-mode differential-mode (CMDM) structure for ultrahigh field MRI. The parallel imaging performance of the 8-channel CMDM planar array was numerically investigated based on electromagnetic simulations and Cartesian sensitivity encoding (SENSE) reconstruction. The signal-to-noise ratio (SNR) of multichannel images combined using root-sum-of-squares (rSoS) and covariance weighted root-sum-of-squares (Cov-rSoS) at various reduction factors were compared between 8-channel CMDM array and 4-channel CM and DM array. The results of the study indicated the 8-channel CMDM array excelled the 4-channel CM and DM in SNR. The g-factor maps and artifact power were calculated to evaluate parallel imaging performance of the proposed 8-channel CMDM array. The artifact power of 8-channel CMDM array was reduced dramatically compared with the 4-channel CM and DM arrays demonstrating the parallel imaging feasibility of the CMDM array.
Keywords: Magnetic resonance image (MRI), parallel MRI, multichannel phased array, common-mode differential-mode (CMDM), signal-to-noise ratio (SNR)
Introduction
Parallel imaging techniques (1-4) using array coils and multichannel receivers (5) in the past decade provide an effective approach to reduce scan time of magnetic resonance imaging (MRI). In parallel imaging, the acquisition time can be dramatically reduced by exploiting the variations in the sensitivity patterns of different elements in an array coil in order to replace some of the spatial encoding normally accomplished by using magnetic field gradients. Numerous data acquisition and image reconstruction strategies have been proposed and adopted for clinical applications in high field MRI such as real time cardiovascular imaging, functional MRI, and contrast-enhanced MR studies (6-9).
In order to perform the parallel imaging techniques, independent multichannel receivers with different sensitivity distribution are demanded to acquire signals simultaneously. The conventional MRI phased arrays with loop structured resonant elements were developed and investigated in previous studies (10-14). Some other types of multichannel receivers were also proposed, such as saddle structure (15) and volume strip arrays (16). It has been demonstrated that high and ultrahigh magnetic fields are fundamentally advantageous in in vivo MR applications due to their inherently high signal-to-noise ratio (SNR), and thus high spatial and spectral resolution (17-20). At high and ultrahigh fields, the interactions between the EM fields and biological samples become distinct. This results in tissue-specific perturbations of EM field patterns, requiring appropriate RF coil designs to improve image quality and to avoid adverse effects in patients. RF coil and coil array designs using microstrip transmission lines were proposed to address the high field RF challenges and electromagnetic coupling issues. Based on the microstrip transmission line theory, the microstrip surface coils were developed at the ultrahigh field of 7T (21,22), which provides the capability of developing a variety of coils such as volume coils (23,24) and phased array coils (25-28). Subsequently, common-mode differential-mode (CMDM) coils implemented by using microstrip transmission line for double-tuned volume coils at 7T were developed (29), showing the capability of intrinsical decoupling between common mode and differential mode resulting from their orthogonal field distribution. Recently, the non-array planar transceiver coil using CMDM method proposed and tested for 7T MR imaging (30), demonstrating high quality factors, high frequency operation capability and high efficiency. The study also suggested that the planar CMDM coil could be a good candidate for design blocks in multichannel RF coil arrays.
In this work, an 8-channel phased array was based on the planar CMDM coil for ultrahigh field MRI. Numerical simulation was performed to investigate electromagnetic field distribution of the CMDM planar phased array. The image of each channel was calculated based on the simulation results. The combined image of the 8-channel CMDM array was obtained by using root-sum-of-squares (rSoS) and covariance weighted root-sum-of-squares (Cov-rSoS) (31). The Cartesian SENSE was employed to investigate imaging acceleration capability. SNR maps, g-factor maps and artifact power at various reduction factors were calculated to evaluate the parallel imaging performance of the proposed array.
Materials and methods
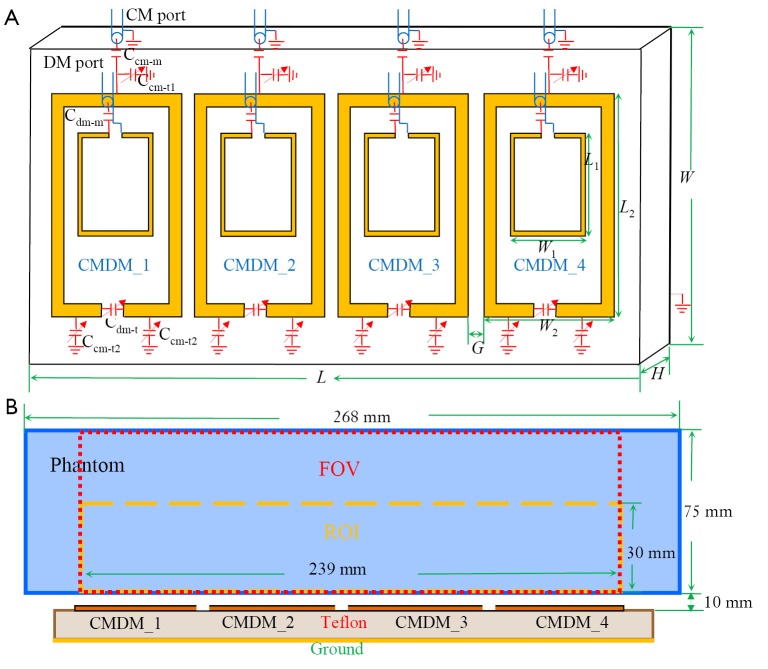
The proposed 8-channel CMDM array consisted of four CMDM blocks as shown in Figure 1. For each CMDM block, the width and length of the block were W2 =43 mm and L2 =94 mm respectively. The width and length of the DM driving loop were W1 =26 mm and L1 =39 mm. The thickness H, width W and length L of the substrate were 12.7, 120 and 223.05 mm respectively. The gap G between adjacent CMDM blocks was 6.35 mm. The width of the copper strips of the driving loops and CMDM blocks were 1.6 and 6.35 mm, respectively. The cubic phantom with 75×75×268 mm3 at 10 mm distance from the top of the substrate was filled with water (εr =78, μr =0.99, σ =1.59 S/m).
Figure 1.
Schematic and design layout of the 8-channel CMDM transceiver array and the feeding system. (A) Configuration of the 8-channel CMDM array; (B) The numerical model. The blue box indicates the phantom. The box with red dotted line indicates the FOV. The box with yellow dotted line indicates the ROI. CMDM, common-mode differential-mode; FOV, field of view; ROI, region of interesting.
Numerical method for full-wave 3D electromagnetic analysis was used to simulate the electromagnetic field distribution of the 8-channel CMDM array. The infinite space was truncated by the perfect matched layers (PML). The distance between the PML and the model was set to 100 mm in all directions. Four layers of PML were exploited to mimic infinite space. Total mesh number of the model was 858,000 with adaptive mesh discretization. The 8-channel CMDM array was tuned to 298 MHz by capacitor Ccm-t1 =91 pF for four CMDM blocks, which corresponds to the proton Larmor frequency at 7T. The value of the capacitor Ccm-t2 was 2.2 pF for CMDM_1 and CMDM_4, and 2.5 pF for CMDM_2 and CMDM_3. The value of tune capacitor Cdm-t for four CMDM blocks was in turn from left to right 1.1, 1.2, 1.2 and 1.0 pF as shown in Figure 1. Eight ports of the array were excited separately by the same RF pulse with equal amplitude and phase. The excitation was set to be current source with input power of 1 W. The electromagnetic field distribution of each channel was acquired for array performance investigation.
Neglecting the effects of the relaxation and susceptibility, the receiving signal intensity S of the gradient echo (GRE) sequence can be written as (32-34):
 |
[1] |
where W is the water content in the voxel, γ and ι are the magnetogyric ratio and the duration, respectively.  and
and  are the left-handed rotating field and right-handed rotating field, which correspond to transmit field and receive field of RF coil, respectively. The V is a variable and proportional to coil driving voltage in a given experiment, and thus proportional to flip angle. Assuming that the excitation field was homogenous, the
  is used to approach the image intensity according to Eq. [1]. For 8-channel CMDM array, the image intensity of each channel is calculated separately based on the
  distribution of each channel.
Two reconstruction methods, rSoS and Cov-rSoS, were employed to generate combined image of the 8-channel CMDM array. Let C and S denote the coil sensitivity vector and aliased image vector respectively. The general expressions of rSoS and Cov-rSoS were described as (31):
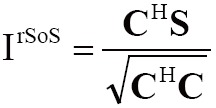 |
[2] |
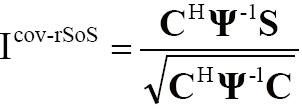 |
[3] |
where Ψ denoted the noise covariance matrix, which was calculated by the electric field in phantom as (5):
 |
[4] |
where σ(r) was the conductivity, Ei(r) was the electric field excited by the i-th excitation port, the superscript H indicated conjugate (Hermitian) transpose. If C equaled to S, then
 |
[5] |
 |
[6] |
For the above combination methods, the image SNR was given by:
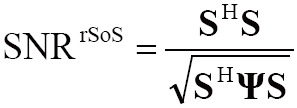 |
[7] |
 |
[8] |
In order to evaluate parallel imaging performance of the 8-channel CMDM array, SENSE method was utilized for imaging acceleration. The image intensity of each channel was transformed into k-space as full k-space data. Then, full k-space data were under-sampled by different reduction factors. A non-aliased full-FOV image can be obtained through eight aliased images by implementing the SENSE method [PULSAR toolbox (35)].
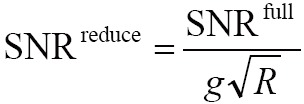
When the reduction factor R was 1, the image reconstructed in SENSE was degenerated into Cov-rSoS image, which was an accurate reconstruction image and considered as a reference image in reconstruction error estimation. The SNR for SENSE reconstruction was calculated by:
 |
[9] |
where R and g were reduction factor and g-factor map, respectively. And SNRfull denoted the SNR of full k-space image. SNRfull was replaced by SNRrSoS and SNRCov-rSoS in this study.
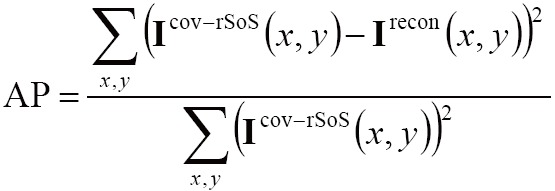
The artifact power was used to evaluate the reconstruction error of different reduction factors R. The image of Cov-rSoS reconstruction was considered as reference image. The construction error was evaluated by L2-norm in simulations. The artifact power (AP) was defined as:
 |
[10] |
Results
The simulated distribution  excited by each channel separately in transverse plane of the 8-channel CMDM array was shown in Figure 2. The SENSE reconstruction images for 8-channel CMDM array at various reduction factor R were displayed in Figure 3. When reduction factor R =1, the SENSE reconstruction degenerated into Cov-rSoS. For comparisons, the SENSE reconstruction images and corresponding error for 4-channel CM and DM were also given in Figures 4,5, respectively. The SENSE reconstruction images with reduction factor R =2 were almost the same as Cov-rSoS image. The images of 8-channel CMDM array provided better penetration and coverage than the 4-channel CM array and DM array.
Figure 2.
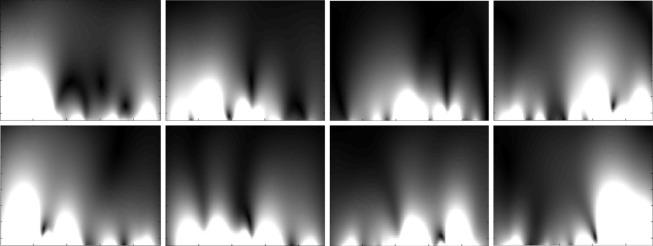
The maps of the  field excited by each port in the 8-channel CMDM array. Rows 1-2 illustrate the
  field distributions of four different CMDM elements in the 8-channel array, which correspond to four different CM channels (upper row) and four different DM channels (lower row). CMDM, common-mode differential-mode.
Figure 3.
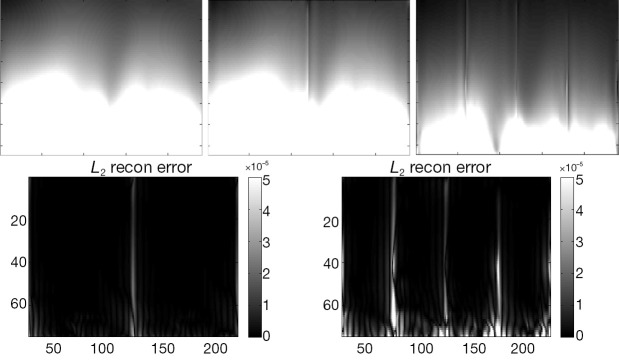
The image and reconstruction error of SENSE at various reduction factor for 8-channel CMDM array. The top row demonstrated the image corresponding to reduction factor R =1, 2, 4. The bottom row displayed the L2 norm error between SENSE reconstruction images and Cov-rSoS images for reduction factor R =2, 4. SENSE, sensitivity encoding; CMDM, common-mode differential-mode.
Figure 4.
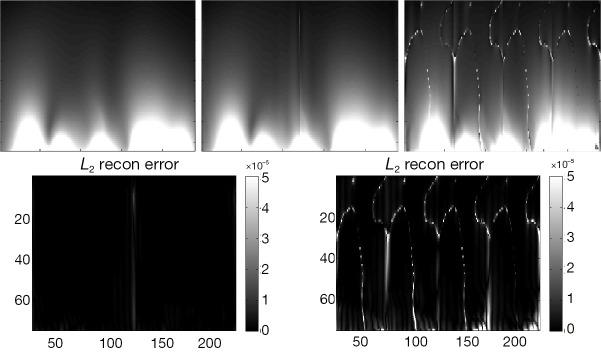
The image and reconstruction error of SENSE at various reduction factor for 4-channel CM array. The top row demonstrates the image corresponding to reduction factor R =1, 2, 4. The bottom row displays the L2 error between reconstruction images and Cov-rSoS images for reduction factor R =2, 4. CM, common-mode; SENSE, sensitivity encoding; Cov-rSoS, covariance weighted root-sum-of-squares.
Figure 5.
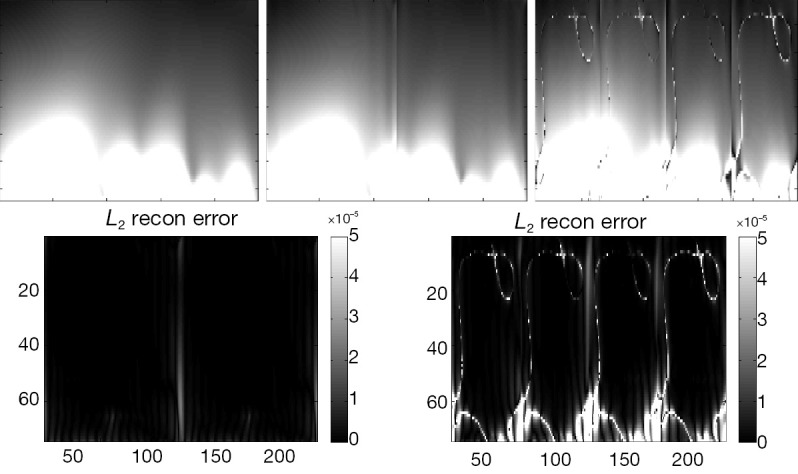
The image and reconstruction error of SENSE at various reduction factor for 4-channel DM array. The top row demonstrates the image corresponding to reduction factor R =1, 2, 4. The bottom row displays the L2 error between reconstruction images and covariance weighted root-sum-of-squares for reduction factor R =2, 4. SENSE, sensitivity encoding; DM, differential-mode.
The SNR maps for SENSE reconstruction at various reduction factors were demonstrated in Figures 6-8. Figure 6 showed that SNR of 8-channel CMDM array for rSoS and Cov-rSoS reconstruction with R =1, 2, 4. Similarly, the Figures 7,8 displayed that SNR maps of 4-channel CM and DM with R =1, 2, 4. The results demonstrated that 8-channel CMDM array for Cov-rSoS reconstruction with R =1 provided the highest SNR than others. The SNR performance of the 8-channel CMDM array with different reduction factors was better than the 4-channel CM and DM array.
Figure 6.
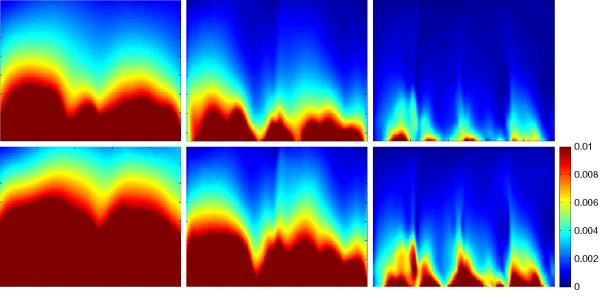
The SNR maps of SENSE reconstruction for 8-channel CMDM array. The top row demonstrates the SNR maps with SNRrSoS as SNRfull corresponding to reduction factor R =1, 2, 4. The bottom row demonstrates the SNR maps with SNRCov-rSoS as SNRfull corresponding to reduction factor R =1, 2, 4. SNR, signal-to-noise ratio; SENSE, sensitivity encoding; CMDM, common-mode differential-mode.
Figure 8.
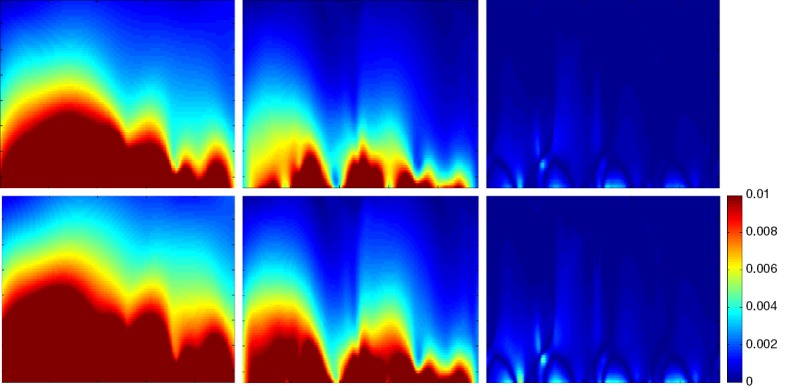
The SNR maps of SENSE reconstruction for 4-channel CM array. The top row demonstrates the SNR maps with SNRrSoS as SNRfull corresponding to reduction factor R =1, 2, 4. The bottom row demonstrates the SNR maps with SNRCov-rSoS as SNRfull corresponding to reduction factor R =1, 2, 4. SNR, signal-to-noise ratio; SENSE, sensitivity encoding; CM, common-mode.
Figure 7.
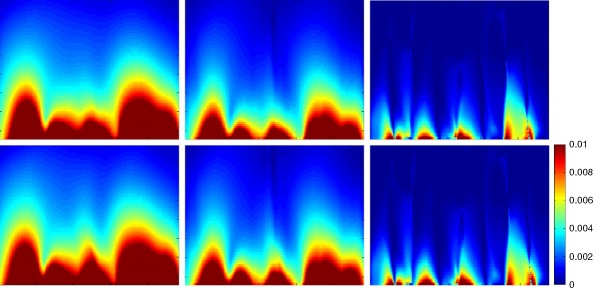
The SNR maps of SENSE reconstruction for 4-channel DM array. The top row demonstrates the SNR maps with SNRrSoS as SNRfull corresponding to reduction factor R =1, 2, 4. The bottom row demonstrates the SNR maps with SNRCov-rSoS as SNRfull corresponding to reduction factor R =1, 2, 4. SNR, signal-to-noise ratio; SENSE, sensitivity encoding; DM, differential-mode.
The g-factor for SENSE reconstruction was calculated. The means of g-factor in ROI corresponding to reduction factor R =2, 4 were 1.4355 and 3.3757, respectively. While the maximum of g-factor in ROI corresponding to reduction factor R =2, 4 were 2.408 and 11.6621, respectively. The 1/g-factor maps for SENSE reconstruction at various reduction factors for 8-channel CMDM array were shown in Figure 9. The ROI was selected as shown in Figure 1B.
Figure 9.
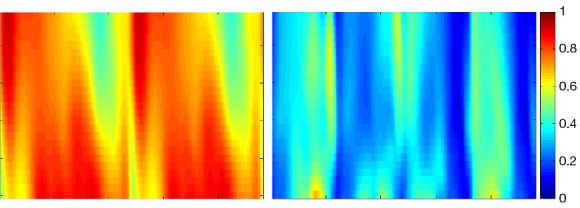
The 1/g-factor maps of SENSE reconstruction corresponding to reduction factor R =2, 4 for 8-channel CMDM array in ROI as shown in Figure 1B. CMDM, common-mode differential-mode; ROI, region of interesting; SENSE, sensitivity encoding.
Finally, the artifact power of SENSE reconstruction for the 8-channel was considered according to Eq. [10]. In Table 1, the artifact power was given for 8-channel CMDM, 4-channel CM, 4-channel DM with various reduction factors. The artifact power of 4-channel CM array was approximately equal to the 4-channel DM array. The artifact power of 8-channel CMDM array was reduced compared with 4-channel CM and DM array.
Table 1. The artifact power for CMDM array (no Gaussian white noise added).
| Reduction factor | 2 | 4 |
|---|---|---|
| 4-ch CM | 3.5736×10⁻⁴ | 8.552×10⁻¹ |
| 4-ch DM | 2.4009×10⁻⁴ | 8.674×10⁻¹ |
| 8-ch CMDM | 9.1262×10⁻⁵ | 7.652×10⁻³ |
CM, common-mode; DM, differential-mode; CMDM, common-mode differential-mode.
Discussion and conclusions
In this study, rSoS and Cov-rSoS are employed to combine the images of 8-channel CMDM array. According to the SNR of combined images in the simulation, Cov-rSoS is superior to rSoS, taking into account the correlated noise among channels.
The reconstructed images acquired using 8-channel CMDM array is compared with that acquired from 4-channel CM and DM array. The SNR of 8-channel CMDM array at various reduction factors is better than the 4-channel CM and DM array. In addition, parallel imaging performance of 8-channel CMDM array based on simulation has been evaluated. The artifact power of 8-channel CMDM array is less than the 4-channel CM and DM array. These indicate the parallel imaging feasibility and better performance of the 8-channel CMDM array.
Practically, the excitation field is not homogeneous at 7T. RF shimming can be employed to eliminate or decrease inhomogeneity of excitation field. Therefore the signal intensity is strongly related to the RF shimming strategies. In this work, in order to focus on the parallel imaging performance evaluation of the proposed array, we only used the in the simulation, which is not indicated the transmit field is homogenous. In our simulation, the transmit field of each channel of the proposed 8-channel CMDM array is shown in Figure 10. The combined transmit field is shown in Figure 11.
Figure 10.
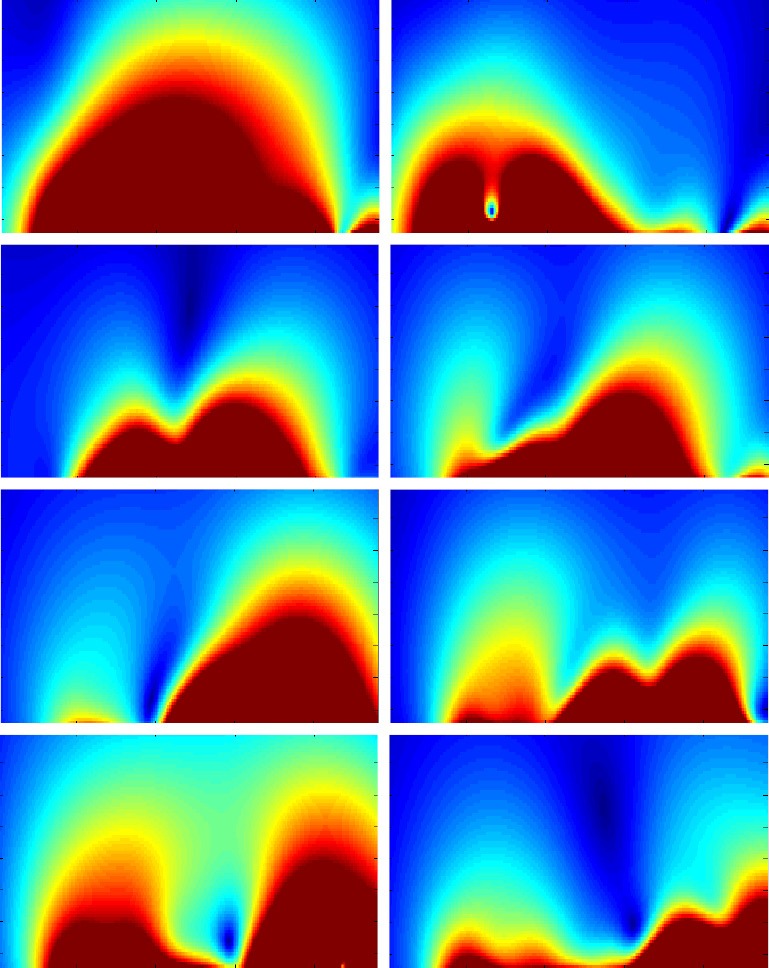
Transmit field distribution of each channel of the proposed 8-channel CMDM array. CMDM, common-mode differential-mode.
Figure 11.
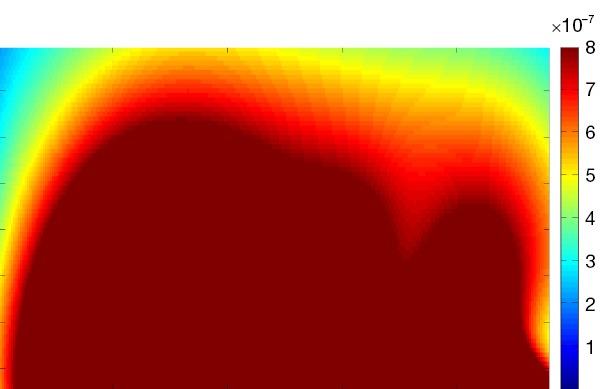
The combined transmit field distribution of the proposed 8-channel CMDM array. CMDM, common-mode differential-mode.
In the simulation experiments, there is no noise adding into each channel. The error is zero when reduction factor R is equal to 1. Since the g-factor values demonstrate the noise increase caused by the SENSE reconstruction, it is possible to achieve lower artifact power while the g-factors are high. In order to investigate the artifact power in images with noise, we add Gaussian white noise into image of each channel. The Gaussian white noise of each channel is random and independent from other channels. The signal intensity of the images of each channel is approximate to 5×10⁻⁷. We add Gaussian white noise with mean values equal to 0 and standard deviation is 5×10⁻⁸ and 1×10⁻⁸ respectively. The SNR maps of Cov-rSoS combination and AP at various reduction factors are shown in Figures 12,13 and Tables 2,3. The AP and SNR variation at different noise level could be demonstrated.
Figure 12.
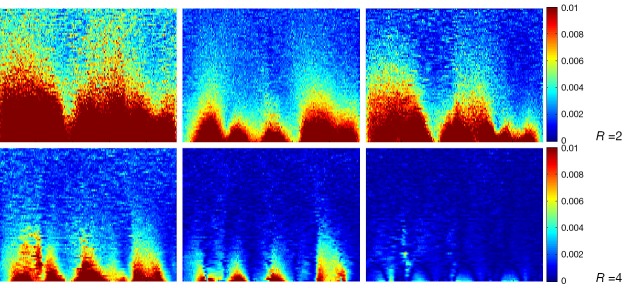
SNR maps of the arrays by Cov-rSoS reconstruction with Gaussian noise [(mean =0, std =5×10⁻⁸)]. Left, 8-ch CMDM; Middle, 4-ch DM; Right, 4-ch CM. SNR, signal-to-noise ratio; CMDM, common-mode differential-mode; Cov-rSoS, covariance weighted root-sum-of-squares.
Figure 13.
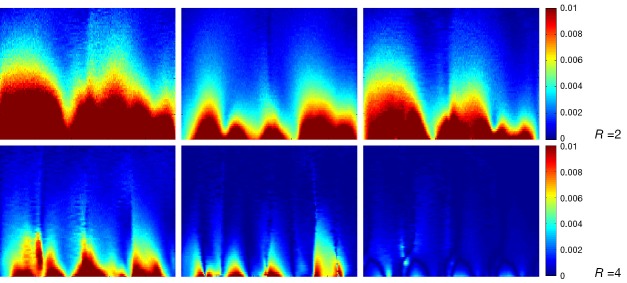
SNR maps of the arrays by Cov-rSoS reconstruction with Gaussian noise [(mean =0, std =1×10⁻⁸)]. Left, 8-ch CMDM; Middle, 4-ch DM; Right, 4-ch CM. SNR, signal-to-noise ratio; CMDM, common-mode differential-mode; Cov-rSoS, covariance weighted root-sum-of-squares.
Table 2. The artifact power for CMDM array (mean =0, std =5×10⁻⁸).
| Reduction factor | 2 | 4 |
|---|---|---|
| 4-ch CM | 4.715×10⁻² | 1.0892 |
| 4-ch DM | 3.322×10⁻² | 9.592×10⁻¹ |
| 8-ch CMDM | 3.843×10⁻³ | 5.923×10⁻³ |
CM, common-mode; DM, differential-mode; CMDM, common-mode differential-mode.
Table 3. The artifact power for CMDM array (mean =0, std =1×10⁻⁸).
| Reduction factor | 2 | 4 |
|---|---|---|
| 4-ch CM | 1.4177×10⁻⁴ | 9.507×10⁻¹ |
| 4-ch DM | 1.8005×10⁻⁴ | 9.601×10⁻¹ |
| 8-ch CMDM | 8.7970×10⁻⁵ | 7.104×10⁻³ |
CM, common-mode; DM, differential-mode; CMDM, common-mode differential-mode.
When the covariance weighted root-sum-of-squares (Cov-rSoS) were employed to combine images of the 8-channel CMDM array in simulation, coupling of each channel was partially compensated by the Cov-rSoS reconstruction method. This is agreed with the result in references (36,37). In practice, the preamplifier decoupling could also be used to further reduce the coupling between the elements. For array fabrication, several decoupling methods such as adjusting the gaps between the adjacent CMDM block, magnetic wall (or metamaterial) decoupling (38) and resonant inductive decoupling (39) might be employed to further reduce the coupling of each channel. Future work includes evaluating the parallel imaging performance of these arrays and decoupling methods with in vivo experiments.
Acknowledgements
This work was supported in part by the National Natural Science Foundation of China under Grant No. 81120108012, 51307171 and 51228702, the Major State Basic Research Development Program of China (973 Program) under Grant No. 2011CB707903, Shenzhen special funds for the development of strategic emerging industries under Contract No. SY294261001 and innovation fund for outstanding youth in Shenzhen Institutes of Advanced Technology of Chinese Academy of Sciences under Grant No. Y3G016.
Disclosure: The authors declare no conflict of interest.
References
- 1.Sodickson DK, Manning WJ. Simultaneous acquisition of spatial harmonics (SMASH): fast imaging with radiofrequency coil arrays. Magn Reson Med 1997;38:591-603 [DOI] [PubMed] [Google Scholar]
- 2.Pruessmann KP, Weiger M, Scheidegger MB, et al. SENSE: sensitivity encoding for fast MRI. Magn Reson Med 1999;42:952-62 [PubMed] [Google Scholar]
- 3.Griswold MA, Jakob PM, Nittka M, et al. Partially parallel imaging with localized sensitivities (PILS). Magn Reson Med 2000;44:602-9 [DOI] [PubMed] [Google Scholar]
- 4.Griswold MA, Jakob PM, Heidemann RM, et al. Generalized autocalibrating partially parallel acquisitions (GRAPPA). Magn Reson Med 2002;47:1202-10 [DOI] [PubMed] [Google Scholar]
- 5.Roemer PB, Edelstein WA, Hayes CE, et al. The NMR phased array. Magn Reson Med 1990;16:192-225 [DOI] [PubMed] [Google Scholar]
- 6.Weiger M, Pruessmann KP, Boesiger P. Cardiac real-time imaging using SENSE. SENSitivity Encoding scheme. Magn Reson Med 2000;43:177-84 [DOI] [PubMed] [Google Scholar]
- 7.Huber ME, Kozerke S, Pruessmann KP, et al. Sensitivity-encoded coronary MRA at 3T. Magn Reson Med 2004;52:221-7 [DOI] [PubMed] [Google Scholar]
- 8.van den Brink JS, Watanabe Y, Kuhl CK, et al. Implications of SENSE MR in routine clinical practice. Eur J Radiol 2003;46:3-27 [DOI] [PubMed] [Google Scholar]
- 9.Park J, McCarthy R, Li D.Feasibility and performance of breath-hold 3D true-FISP coronary MRA using self-calibrating parallel acquisition. Magn Reson Med 2004;52:7-13 [DOI] [PubMed] [Google Scholar]
- 10.Fayad ZA, Connick TJ, Axel L. An improved quadrature or phased-array coil for MR cardiac imaging. Magn Reson Med 1995;34:186-93 [DOI] [PubMed] [Google Scholar]
- 11.Porter JR, Wright SM, Reykowski A. A 16-element phased-array head coil. Magn Reson Med 1998;40:272-9 [DOI] [PubMed] [Google Scholar]
- 12.Zhu Y, Hardy CJ, Sodickson DK, et al. Highly parallel volumetric imaging with a 32-element RF coil array. Magn Reson Med 2004;52:869-77 [DOI] [PMC free article] [PubMed] [Google Scholar]
- 13.Balu N, Yarnykh VL, Scholnick J, et al. Improvements in carotid plaque imaging using a new eight-element phased array coil at 3T. J Magn Reson Imaging 2009;30:1209-14 [DOI] [PMC free article] [PubMed] [Google Scholar]
- 14.Li Y, Pang Y, Vigneron D, et al. Investigation of multichannel phased array performance for fetal MR imaging on 1.5T clinical MR system. Quant Imaging Med Surg 2011;1:24-30 [DOI] [PMC free article] [PubMed] [Google Scholar]
- 15.Zhang X, Webb A.Design of a capacitively decoupled transmit/receive NMR phased array for high field microscopy at 14.1T. J Magn Reson 2004;170:149-55 [DOI] [PubMed] [Google Scholar]
- 16.Lee RF, Xue R. A transmit/receive volume strip array and its mode mixing theory in MRI. Magn Reson Imaging 2007;25:1312-32 [DOI] [PubMed] [Google Scholar]
- 17.Hoult DI, Richards RE. The signal-to-noise ratio of the nuclear magnetic resonance experiment. 1976. J Magn Reson 1976;24:71-85 [DOI] [PubMed] [Google Scholar]
- 18.Hoult DI, Phil D. Sensitivity and power deposition in a high-field imaging experiment. J Magn Reson Imaging 2000;12:46-67 [DOI] [PubMed] [Google Scholar]
- 19.Vaughan JT, Garwood M, Collins CM, et al. 7T vs. 4T: RF power, homogeneity, and signal-to-noise comparison in head images. Magn Reson Med 2001;46:24-30 [DOI] [PubMed] [Google Scholar]
- 20.Adriany G, Auerbach EJ, Snyder CJ, et al. A 32-channel lattice transmission line array for parallel transmit and receive MRI at 7 tesla. Magn Reson Med 2010;63:1478-85 [DOI] [PMC free article] [PubMed] [Google Scholar]
- 21.Zhang X, Ugurbil K, Chen W.Microstrip RF surface coil design for extremely high-field MRI and spectroscopy. Magn Reson Med 2001;46:443-50 [DOI] [PubMed] [Google Scholar]
- 22.Pang Y, Wu B, Wang C, et al. Numerical Analysis of Human Sample Effect on RF Penetration and Liver MR Imaging at Ultrahigh Field. Concepts Magn Reson Part B Magn Reson Eng 2011;39B:206-16 [DOI] [PMC free article] [PubMed] [Google Scholar]
- 23.Zhang X, Zhu XH, Chen W. Higher-order harmonic transmission-line RF coil design for MR applications. Magn Reson Med 2005;53:1234-9 [DOI] [PubMed] [Google Scholar]
- 24.Zhang X, Ugurbil K, Sainati R, et al. An inverted-microstrip resonator for human head proton MR imaging at 7 tesla. IEEE Trans Biomed Eng 2005;52:495-504 [DOI] [PubMed] [Google Scholar]
- 25.Adriany G, Van de Moortele PF, Wiesinger F, et al. Transmit and receive transmission line arrays for 7 Tesla parallel imaging. Magn Reson Med 2005;53:434-45 [DOI] [PubMed] [Google Scholar]
- 26.Wu B, Wang C, Kelley DA, et al. Shielded microstrip array for 7T human MR imaging. IEEE Trans Med Imaging 2010;29:179-84 [DOI] [PMC free article] [PubMed] [Google Scholar]
- 27.Wu B, Wang C, Lu J, et al. Multi-channel microstrip transceiver arrays using harmonics for high field MR imaging in humans. IEEE Trans Med Imaging 2012;31:183-91 [DOI] [PMC free article] [PubMed] [Google Scholar]
- 28.Wu B, Zhang X, Wang C, et al. Flexible transceiver array for ultrahigh field human MR imaging. Magn Reson Med 2012;68:1332-8 [DOI] [PMC free article] [PubMed] [Google Scholar]
- 29.Pang Y, Zhang X, Xie Z, et al. Common-mode differential-mode (CMDM) method for double-nuclear MR signal excitation and reception at ultrahigh fields. IEEE Trans Med Imaging 2011;30:1965-73 [DOI] [PMC free article] [PubMed] [Google Scholar]
- 30.Li Y, Yu B, Pang Y, et al. Planar quadrature RF transceiver design using common-mode differential-mode (CMDM) transmission line method for 7T MR imaging. PLoS One 2013;8:e80428. [DOI] [PMC free article] [PubMed] [Google Scholar]
- 31.Keil B, Wald LL. Massively parallel MRI detector arrays. J Magn Reson 2013;229:75-89 [DOI] [PMC free article] [PubMed] [Google Scholar]
- 32.Hoult DI, Phil D. Sensitivity and power deposition in a high-field imaging experiment. J Magn Reson Imaging 2000;12:46-67 [DOI] [PubMed] [Google Scholar]
- 33.Hoult DI. The principle of reciprocity in signal strength calculations—A mathematical guide. Concepts in Magnetic Resonance 2000;14:173-87 [Google Scholar]
- 34.Collins CM, Yang QX, Wang JH, et al. Different excitation and reception distributions with a single-loop transmit-receive surface coil near a head-sized spherical phantom at 300 MHz. Magn Reson Med 2002;47:1026-8 [DOI] [PubMed] [Google Scholar]
- 35.Ji JX, Son JB, Rane SD. PULSAR: A Matlab toolbox for parallel magnetic resonance imaging using array coils and multiple channel receivers. Concepts in Magnetic Resonance Part B: Magnetic Resonance Engineering 2000;37B:24-36 [Google Scholar]
- 36.Nordmeyer-Massner JA, De Zanche N, Pruessmann KP. Mechanically adjustable coil array for wrist MRI. Magn Reson Med 2009;61:429-38 [DOI] [PubMed] [Google Scholar]
- 37.Ohliger MA, Ledden P, McKenzie CA, et al. Effects of inductive coupling on parallel MR image reconstructions. Magn Reson Med 2004;52:628-39 [DOI] [PubMed] [Google Scholar]
- 38.Li Y, Xie Z, Pang Y, et al. ICE decoupling technique for RF coil array designs. Med Phys 2011;38:4086-93 [DOI] [PMC free article] [PubMed] [Google Scholar]
- 39.Avdievich NI, Pan JW, Hetherington HP. Resonant inductive decoupling (RID) for transceiver arrays to compensate for both reactive and resistive components of the mutual impedance. NMR Biomed 2013;26:1547-54 [DOI] [PMC free article] [PubMed] [Google Scholar]


