

Abstract
Background: Phthalates are ubiquitous environmental contaminants. Because of potential adverse effects on human health, butylbenzyl phthalate [BBzP; metabolite, monobenzyl phthalate (MBzP)], di-n-butyl phthalate [DnBP; metabolite, mono-n-butyl phthalate (MnBP)], and di(2-ethylhexyl) phthalate (DEHP) are being replaced by substitutes including other phthalates; however, little is known about consequent trends in population-level exposures.
Objective: We examined temporal trends in urinary concentrations of phthalate metabolites in the general U.S. population and whether trends vary by sociodemographic characteristics.
Methods: We combined data on 11 phthalate metabolites for 11,071 participants from five cycles of the National Health and Nutrition Examination Survey (2001–2010). Percent changes and least square geometric means (LSGMs) were calculated from multivariate regression models.
Results: LSGM concentrations of monoethyl phthalate, MnBP, MBzP, and ΣDEHP metabolites decreased between 2001–2002 and 2009–2010 [percent change (95% CI): –42% (–49, –34); –17% (–23, –9); –32% (–39, –23) and –37% (–46, –26), respectively]. In contrast, LSGM concentrations of monoisobutyl phthalate, mono(3-carboxypropyl) phthalate (MCPP), monocarboxyoctyl phthalate, and monocarboxynonyl phthalate (MCNP) increased over the study period [percent change (95% CI): 206% (178, 236); 25% (8, 45); 149% (102, 207); and 15% (1, 30), respectively]. Trends varied by subpopulations for certain phthalates. For example, LSGM concentrations of ΣDEHP metabolites, MCPP, and MCNP were higher in children than adults, but the gap between groups narrowed over time (pinteraction < 0.01).
Conclusions: Exposure of the U.S. population to phthalates has changed in the last decade. Data gaps make it difficult to explain trends, but legislative activity and advocacy campaigns by nongovernmental organizations may play a role in changing trends.
Citation: Zota AZ, Calafat AM, Woodruff TJ. 2014. Temporal trends in phthalate exposures: findings from the National Health and Nutrition Examination Survey, 2001–2010. Environ Health Perspect 122:235–241; http://dx.doi.org/10.1289/ehp.1306681
Introduction
Phthalate acid esters, also known as phthalates, are the predominant type of plasticizer used around the world. Low-molecular-weight phthalates, such as diethyl phthalate (DEP), di-n-butyl phthalate (DnBP), and diisobutyl phthalate (DiBP), are used in personal care products, solvents, adhesives, and medications [Kelley et al. 2012; Koniecki et al. 2011; U.S. Environmental Protection Agency (EPA) 2012]. High-molecular-weight phthalates, such as butylbenzyl phthalate (BBzP), di(2-ethylhexyl) phthalate (DEHP), diisononyl phthalate (DiNP), and diisodecyl phthalate (DiDP), are primarily used as plasticizers in polyvinyl chloride (PVC) applications found in building materials, cables and wires, toys, and food packaging (Schecter et al. 2013; Stringer et al. 2000; U.S. EPA 2012) (Table 1).
Table 1.
Phthalates and urinary metabolites measured in the NHANES biomonitoring program.
| Phthalate | Abbrev | Level of restriction in the U.S.a | MWb | Urinary metabolites | Abbrev | Common sources |
|---|---|---|---|---|---|---|
| Dimethyl phthalate | DMP | — | 194.2 | Monomethyl phthalate | MMP | Insect repellent, plastic bottles, foodc,d |
| Diethyl phthalate | DEP | — | 222.2 | Monoethyl phthalate | MEP | Fragrance, cosmetics, medicationse,f,g |
| Di-n-butyl phthalate | DnBP | ++ | 278.4 | Mono-n-butyl phthalate | MnBP | Cosmetics, medications, food packaging, food, PVC applicationse,g,h,i,j,k |
| Diisobutyl phthalate | DiBP | — | 278.3 | Monoisobutyl phthalate | MiBP | Cosmetics, food, food packaginge,f,h,i |
| Butylbenzyl phthalate | BBzP | ++ | 312.4 | Monobenzyl phthalate Monobutyl phthalate (minor) | MBzP | PVC flooring, food, food packagingh,l |
| Dicyclohexyl phthalate | DCHP | — | 330.4 | Monocyclohexyl phthalate | MCHP | Food, food packagingh |
| Di(2-ethylhexyl) phthalate | DEHP | ++ | 390.6 | Mono(2-ethylhexyl) phthalate | MEHP | PVC applications, toys, cosmetics, food, food packaginge,f,h,i,j,k,m |
| Mono(2-ethyl-5-hydroxyhexyl) phthalate | MEHHP | |||||
| Mono(2-ethyl-5-oxohexyl) phthalate | MEOHP | |||||
| Mono(2-ethyl-5-carboxypentyl) phthalate | MECPP | |||||
| Di-n-octyl phthalate | DnOP | + | 390.6 | Mono(3-carboxypropyl) phthalate | MCPPn | PVC applications, food, food packagingh,i,j |
| Monooctyl phthalate | MOP | |||||
| Diisononyl phthalate | DiNP | + | 418.6 | Monoisononyl phthalate | MiNP | PVC applications, toys, flooring, wall coveringj,m,o |
| Monocarboxyoctyl phthalate | MCOP | |||||
| Diisodecyl phthalate | DiDP | + | 446.4 | Monocarboxynonyl phthalate | MCNP | PVC applications, toys, wire and cables, flooringj,m,o |
| Abbreviations: —, no use restrictions; +, moderate use restrictions; ++, most use restrictions; abbrev, abbreviation. aIndicates degree of risk management activities by federal and state governments in the United States (U.S. EPA 2012). bWe classified DMP, DEP, DnBP, and DiBP as low-molecular-weight phthalates, and BBzP, DCHP, DEHP, DnOP, DiNP, and DiDP high-molecular-weight phthalates. cKarunamoorthi and Sabesan (2010). dAl-Saleh et al. (2011). eKoniecki et al. (2011). fDodson et al. (2012). gKelley et al. (2012). hFierens et al. (2012). iSchecter et al. (2013). jKawakami et al. (2011). kCirillo et al. (2013). lKavlock et al. (2002). mStringer et al. (2000). MCPP is also a nonspecific metabolite of several high-molecular-weight phthalates. oEuropean Chemicals Agency (2012). | ||||||
Phthalates are not chemically bound to products and are therefore released into the environment where they may enter the human body via ingestion, inhalation, and dermal absorption (Meeker et al. 2009). Urinary metabolites of DEP, DnBP, BBzP, and DEHP have been widely detected in the U.S. population since 1999–2000, when phthalate metabolites were first systematically quantified in the National Health and Nutrition Examination Survey (NHANES) [Centers for Disease Control and Prevention (CDC) 2013; Silva et al. 2004; Woodruff et al. 2011]. Higher concentrations of some phthalate metabolites have been documented in certain sociodemographic subpopulations, including children (Koch et al. 2004; Wittassek et al. 2011), females (Silva et al. 2004; Trasande et al. 2013), nonwhite populations (Kobrosly et al. 2012; Trasande et al. 2013), and those of lower socioeconomic status (Kobrosly et al. 2012).
In animal studies, phthalates exhibit marked differences in toxicity depending on their chemical structure and timing of the exposure (Foster 2005; Gray et al. 2000; Howdeshell et al. 2008; National Research Council 2008; Parks et al. 2000). In utero exposure to certain phthalates, including BBzP, DnBP, and DEHP but not others (e.g., DEP), during the sexual differentiation period of rat development leads to reproductive tract malformations in androgen- and insulin-like 3 (INSL3)–dependent tissues (Barlow and Foster 2003; McKinnell et al. 2005; Wilson et al. 2004). Human epidemiologic studies have reported associations between exposure to DnBP, BBzP, and some other phthalates and adverse male reproductive outcomes, including reduced sperm quality, increased sperm DNA damage, and altered male genital development (Hauser et al. 2006, 2007; Meeker et al. 2009; Swan et al. 2005). Other studies have reported associations between gestational exposures to phthalates, including DEP, DnBP, BBzP, and DEHP, and outcomes suggesting impaired behavioral development (Braun et al. 2013; Engel et al. 2009; Swan et al. 2010; Whyatt et al. 2012).
Given the scientific community and public’s concern over phthalate toxicity, the European Union (EU) has banned the use of certain phthalates in toys, food-containing materials, and cosmetics (EU 2004, 2005, 2007). The U.S. federal government enacted legislation in 2008 that bans the use of DnBP, BBzP, and DEHP in any amount > 0.1% in child care articles including toys and placed an interim restriction on DiNP, DiDP, and di-n-octyl phthalate (DnOP) in toys that can be put in a child’s mouth [Consumer Product Safety Improvement Act (CPSIA) 2008; U.S. EPA 2012]. Although phthalate content in other products is not subject to legislative oversight in the United States, environmental and public health organizations have sought to reduce phthalate exposure by advocating for the removal of phthalates from personal care products and educating the public about how to find potentially safer alternatives (Campaign for Safe Cosmetics 2011).
Data on ingredient composition of consumer products are difficult to obtain because reporting is not required by law, but there is some evidence that the plasticizer market is changing. DEHP, which has historically been the most common phthalate plasticizer, is increasingly being substituted with DiNP and DiDP, and these two phthalates combined account for 30–60% of the current plasticizer market in the United States and the European Union (European Chemicals Agency 2012). Changes in reformulation and legislation may have important implications for phthalates exposures, and subsequent health risks, but until now, data were not available to assess temporal trends in phthalate exposures. Therefore, our study objective was to assess temporal trends in exposure to phthalates by analyzing changes in mean urinary concentrations of phthalate metabolites in the U.S. population between 2001 and 2010. In addition, we sought to assess whether temporal trends in urinary concentrations of phthalate metabolites differ by age, sex, race/ethnicity, or household income because these attributes have previously been correlated with phthalate exposures.
Methods
Study population. We used data from the 2001–2002, 2003–2004, 2005–2006, 2007–2008, and 2009–2010 cycles of NHANES, a nationally representative survey and physical examination of the civilian, noninstitutionalized U.S. population conducted by the CDC. There were 13,288 participants with urinary measurements of phthalate metabolites and creatinine. We excluded participants who did not self-identify as non-Hispanic white, non-Hispanic black, or Mexican American (n = 1,460) and/or were missing information on household income (n = 902), resulting in a final sample size of 11,071 study participants.
Phthalate metabolite measurements. Phthalate metabolites are measured in approximately one-third of NHANES participants. Spot urine samples were collected in the Mobile Examination Center and stored at –20°C until shipped to the CDC’s National Center for Environmental Health (Atlanta, GA) for analysis. Concentrations of phthalate metabolites were quantified using solid phase extraction–high performance liquid chromatography–isotope dilution–tandem mass spectrometry (CDC 2013). Laboratory files were downloaded from the NHANES website in October 2012 and included the needed corrections for impurities in some of the previously used analytical standards (Langlois et al. 2012).
Fifteen phthalate metabolites have been measured in NHANES, but not all metabolites were measured in all cycles. The limit of detection (LOD) for a given metabolite often varied by cycle. To facilitate analysis across cycles, we assumed the maximal LOD for each metabolite in our analysis, and substituted values below the LOD with LOD divided by the square root of 2 because this method is used by the CDC (2013) and it produces reasonably nonbiased means and SDs (Hornung and Reed 1990). This report includes the 11 metabolites detected in more than 50% of the population in each cycle (LODs and detection frequencies are available in the Supplemental Material, Tables S1 and S2).
We calculated a summary metric for DEHP metabolites (ΣDEHP metabolites) equal to the molar sum of mono(2-ethylhexyl) phthalate (MEHP), mono(2-ethyl-5-hydroxyhexyl) phthalate (MEHHP), and mono(2-ethyl-5-oxohexyl) phthalate (MEOHP). [We omitted mono(2-ethyl-5-carboxypentyl) phthalate (MECPP) because it was not measured in 2001–2002.] We divided the concentrations of each metabolite by its molecular weight (MW) to obtain the molar equivalent (micromoles per liter) and then summed the concentrations in micromoles per liter to get total micromoles per liter of metabolites. To facilitate comparison with other analytes (Frederiksen et al. 2012; Wolff et al. 2010), we multiplied total micromoles per liter of metabolites by the average MW of the DEHP metabolites (MW = 288 μg/μmol) resulting in ΣDEHP metabolites concentrations expressed in nanograms per liter.
Statistical analysis. Analyses were conducted in SUDAAN, version 10.0 (Research Triangle Institute, Cary, NC). Because we combined five survey cycles, we calculated new sample weights for each participant according to the NHANES analytical guidelines (National Center for Health Statistics 2006) equal to one-fifth of the 2-year sample weights provided in the NHANES laboratory files. The degrees of freedom for our study sample equaled 77 and was calculated by subtracting the number of clusters in the first level of sampling (strata) from the number of clusters (PSUs, or primary sampling units) in the second level of sampling (National Center for Health Statistics 2006). Based on our degrees of freedom, we used a critical value of ±1.99 from the t distribution for the calculation of all confidence intervals. All analyses were adjusted for the nonrandom sampling design and the sample population weights.
We used multivariable regression models to assess the relationship between each phthalate metabolite concentration and time. For this analysis, we modeled NHANES sampling cycles using four indicator terms, with participants sampled in 2001–2002 as the reference group. Next, we constructed our “core” multivariable regression models where the outcome was phthalate metabolite concentrations and the independent variables were NHANES sampling cycle and urinary creatinine concentrations (to account for urinary dilution) (Barr et al. 2005). We natural log–transformed phthalate metabolite and creatinine data before regression analysis to account for their non-normal distributions. We examined residual diagnostics after transformation to assess these assumptions and tried various transformations of the data to assess the sensitivity of the conclusions to the assumptions of normality and equal variances.
From these regression models, we estimated a) percent changes in phthalate metabolite concentrations by NHANES cycle as [exp(β) – 1] × 100% with 95% CIs estimated as [exp(β ± 1.99 × SE) – 1] where β and SE are the estimated regression coefficient and standard error, respectively; and b) least squares geometric means (LSGMs) of phthalate metabolites concentrations by NHANES cycle as exp(least squares means) with 95% CIs as exp(least squares mean ± 1.99 × SE) where the least squares means is the cycle-specific mean of phthalate metabolite concentrations after adjusting for covariates. Next, we examined whether associations between NHANES sampling cycle and phthalate metabolites concentrations varied by age, sex, race/ethnicity, or household income. We first added the four demographic covariates to the “core” regression model described above. We then modeled multiplicative interactions between NHANES cycle and each demographic variable one at a time by adding product terms to the model for the interaction being evaluated, in addition to lower-order terms and covariates. LSGMs for subgroups presented in the main text were calculated from the multivariable models with the multiplicative interaction terms. Demographic variables were categorized as follows: age [children (6–11 years; n = 1,568), adolescents (12–19 years; n = 2,524), and adults (≥ 20 years; n = 6,979)]; sex [male (n = 5,524) and female (n = 5,547)]; race/ethnicity [non-Hispanic white (n = 5,305), non-Hispanic black (n = 2,951), and Mexican American (n = 2,815)]; and poverty–income ratio (PIR; the ratio of household income to poverty threshold adjusted to family size and inflation) [< 1 (i.e., beneath the poverty threshold; n = 2,604), 1–3 (n = 4,639), and > 3 (n = 3,828)]. This is a descriptive analysis, thus results for individual phthalates are not corrected for multiple comparisons. A (two-sided) p-value < 0.05 was considered statistically significant.
Results
Concentrations of monobenzyl phthalate (MBzP), mono-n-butyl phthalate (MnBP), and monoethyl phthalate (MEP), metabolites of BBzP, DnBP, and DEP, respectively, were detected in at least 98% of participants in each cycle. The detection frequency of monoisobutyl phthalate (MiBP), a metabolite of DiBP, increased monotonically from 72% in 2001–2002 to 96% in 2009–2010. Concentrations of MEOHP, mono(3-carboxypropyl) phthalate (MCPP), monocarboxyoctyl phthalate (MCOP), monocarboxynonyl phthalate (MCNP), oxidative metabolites of DEHP, DnOP, DiNP, and DiDP, respectively, were detected in more than 89% of participants. (see Supplemental Material, Table S2; comparisons made using maximal LODs).
Concentrations of MEP, MnBP, MBzP, and the DEHP metabolites were significantly lower in 2009–2010 than in 2001–2002 (Figure 1; see also Supplemental Material, Table S3). LSGM concentrations of MEP declined monotonically between 2005 and 2010; compared with 2001–2002, LSGM concentrations were 20% (95% CI: –30, –9%) and 42% (95% CI: –49, –34%) lower in 2007–2008 and 2009–2010, respectively. LSGM concentrations of MBzP also steadily declined over time with the largest percent change [–32% (95% CI: –39, –23%)] observed between 2001–2002 and 2009–2010. There were no significant differences in LSGM concentrations of MnBP between 2001 and 2008, but 2009–2010 LSGMs were 17% lower (95% CI: –23, –9%) than those in 2001–2002. The temporal trend for ΣDEHP metabolites was nonmonotonic; LSGM concentrations of ΣDEHP metabolites increased from 39.3 ng/mL (95% CI: 36.3, 42.5) in 2001–2002 to 45.4 ng/mL (95% CI: 41.4, 49.7) in 2005–2006 and then decreased to 24.8 ng/mL (95% CI: 21.5, 28.5) in 2009–2010.
Figure 1.
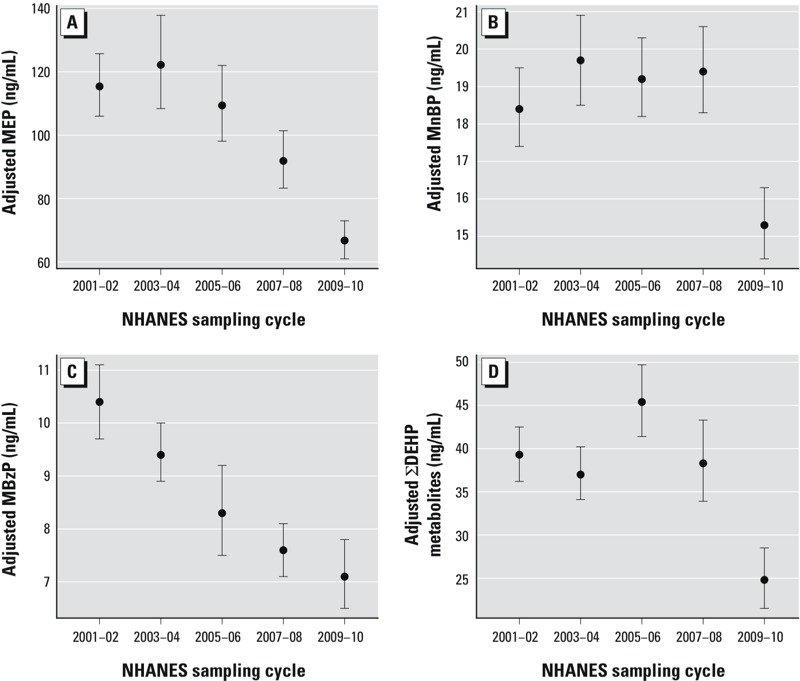
Association between phthalate metabolites and NHANES sampling cycle in the general U.S. population for (A) MEP (n = 11,071; parent phthalate = DEP) (p < 0.0001); (B) MnBP (n = 11,071; parent phthalate, DnBP; p < 0.0001); (C) MBzP (n = 11,071; parent phthalate, BBzP; p < 0.0001); and (D) ∑DEHP metabolites (n = 11,071; parent phthalate, DEHP; p < 0.0001). Models are adjusted for urinary creatinine. Data points represent LSGM and error bars represent 95% CIs. Corresponding numeric data are provided in Supplemental Material, Table S3. p-Value for the overall comparison between groups assessed by the Wald Test.
Concentrations of MiBP, MCPP, MCOP, and MCNP were highest in 2009–2010 compared with earlier study cycles (Figure 2; see also Supplemental Material, Table S3). LSGM concentrations of MiBP monotonically increased over time and were 206% higher (95% CI: 178, 236%) in 2009–2010 compared with 2001–2002. LSGM concentrations of MCOP also monotonically increased over time and were 149% higher (95% CI: 102, 207%) in 2009–2010 compared with 2005–2006 (earliest cycle). For MCNP, LSGM concentrations were 15% higher (95% CI: 1, 30%) in 2009–2010 compared with 2005–2006 (earliest cycle) although LSGM concentrations in 2005–2006 and 2007–2008 were statistically similar. The trend in LSGM concentrations of MCPP was nonmonotonic with the lowest LSGM occurring in 2005–2006.
Figure 2.
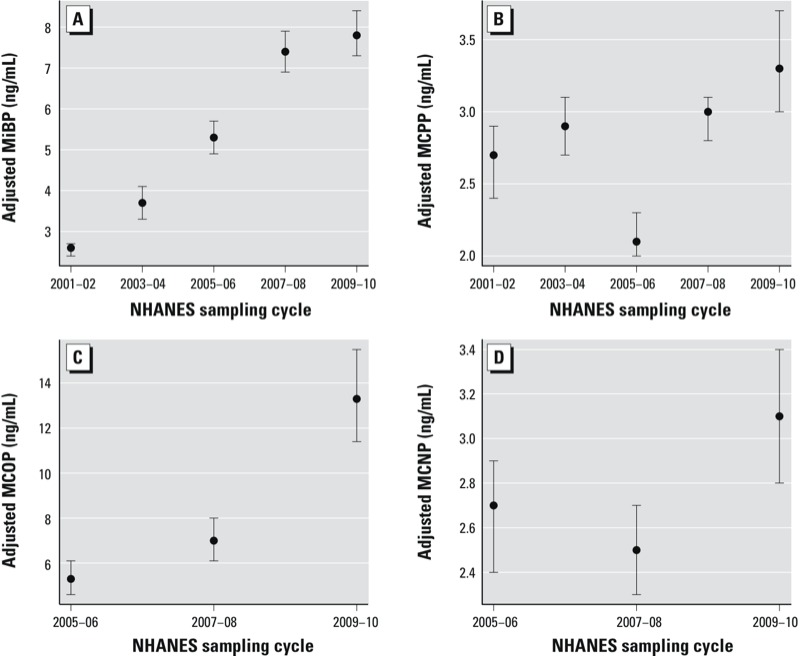
Association between phthalate metabolites and NHANES sampling cycle in the general U.S. population for (A) MiBP (n = 11,071; parent phthalate, DiBP; p < 0.0001); (B) MCPP (n = 11,071; parent phthalates, DnOP and a nonspecific metabolite of high-molecular-weight phthalates; p < 0.0001); (C) MCOP (n = 6,375; parent phthalate, DiNP; p < 0.0001); and (D) MCNP (n = 6,375; parent phthalate, DiDP; p = 0.004). Models are adjusted for urinary creatinine. Data points represent LSGM and error bars represent 95% CIs. Corresponding numeric data are provided in Supplemental Material, Table S3. p-Value for the overall comparison between groups assessed by the Wald Test.
Temporal trends varied by age for MEP, ΣDEHP metabolites, MCPP, and MCNP (Figure 3; see also Supplemental Material, Table S4). For MEP and ΣDEHP metabolites, all three age groups had significantly lower concentrations in 2009–2010 compared with 2001–2002 but children had some notable differences compared with that of adolescents and adults (pinteraction = 0.04 and 0.002 for MEP and ΣDEHP metabolites, respectively). Children had the lowest LSGM concentrations of MEP in all cycles with relatively stable exposures between 2001 and 2008; whereas LSGM concentrations of MEP in both adolescents and adults steadily declined after 2005–2006. For ΣDEHP metabolites, children had higher LSGM concentrations than adolescents and adults in all cycles but the differences between age groups narrowed over time. In addition, the temporal trend for ΣDEHP metabolites in adults and adolescents was nonmonotonic with highest LSGM concentrations in 2005–2006. For MCPP, the trend was non-monotonic for all three age groups, but among adults only, there was a statistically significant increase in LSGM concentrations between 2001–2002 and 2009–2010 (pinteraction = 0.0004). Similarly, LSGM concentrations of MCNP in 2009–2010 were higher than those in 2005–2006 (earliest cycle); whereas in children and adolescents, these metabolite concentrations were statistically similar over the study period (pinteraction = 0.009).
Figure 3.
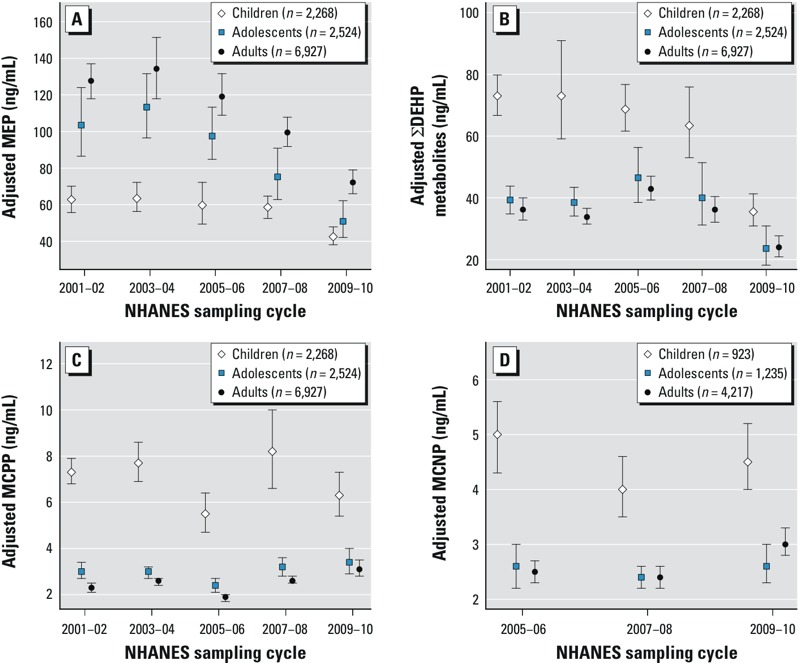
Association between phthalate metabolites and NHANES sampling cycle in the general U.S. population by age for (A) MEP (pinteraction = 0.04), (B) ∑DEHP metabolites (pinteraction = 0.002), (C) MCPP (pinteraction = 0.0004), and (D) MCNP (pinteraction = 0.009). Estimates are from linear regression models of interactions between NHANES sampling cycles and age adjusted for urinary creatinine, sex, race/ethnicity, and PIR. Data points represent LSGM and error bars represent 95% CIs. Corresponding numeric data are provided in Supplemental Material, Table S4.
For MnBP and ΣDEHP metabolites, both sexes had significantly lower LSGMs in 2009–2010 compared with 2001–2002, but the percent decrease was greater in females than males (pinteraction = 0.03 and 0.0001, respectively) (Figure 4; see also Supplemental Material, Table S5). Trends also varied by race/ethnicity and PIR for ΣDEHP metabolites (pinteraction = 0.006 and 0.01, respectively) and by PIR for MCPP (pinteraction < 0.0001) (Figure 5). For example, the association between PIR and MCPP concentrations varied by cycle. In 2001–2002, participants with the lowest income (PIR < 1) had the highest LSGM concentrations of MCPP. However, in 2009–2010, income was inversely associated with MCPP concentrations and those with the highest income (PIR > 3) had a significantly higher LSGM of MCPP than those with the lowest income.
Figure 4.
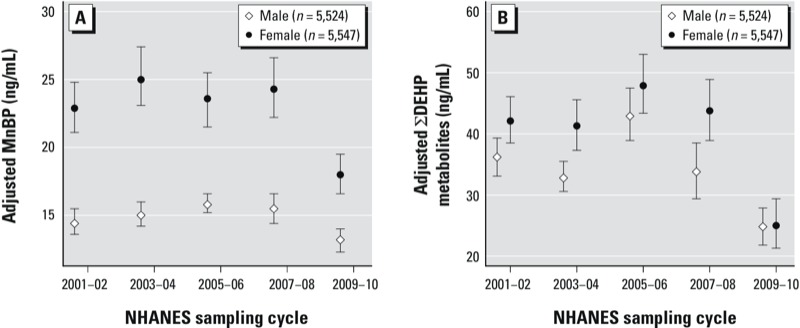
Association between phthalate metabolites and NHANES sampling cycle in the general U.S. population by sex for (A) MnBP (pinteraction = 0.03) and (B) ∑DEHP metabolites (pinteraction = 0.0001). Estimates are from linear regression models of interactions between NHANES sampling cycles and sex, adjusted for urinary creatinine, age (continuous), race/ethnicity, and PIR. Data points represent LSGM and error bars represent 95% CIs. Corresponding numeric data are provided in Supplemental Material, Table S5.
Figure 5.
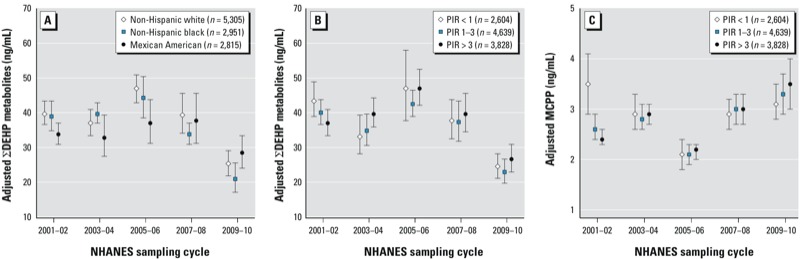
Association between phthalate metabolites and NHANES sampling cycle in the general U.S. population by race/ethnicity for ∑DEHP metabolites (A; pinteraction = 0.006) and by PIR for ∑DEHP metabolites (B; pinteraction = 0.01) and MCPP (C; pinteraction < 0.0001). Estimates in (A) are from linear regression models of interactions between NHANES sampling cycles and race/ethnicity adjusted for urinary creatinine, age (continuous), sex, and PIR. Estimates in (B) and (C) are from linear regression models of interactions between NHANES sampling cycles and PIR adjusted for urinary creatinine, age (continuous), sex, and race/ethnicity. Data points represent LSGM and error bars represent 95% CIs.
Discussion
We observed pronounced changes in urinary concentrations of phthalate metabolites among the U.S. population between 2001 and 2010; urinary metabolite concentrations of DEP, DnBP, BBzP, and DEHP declined approximately 20–50%, whereas urinary metabolite concentrations of DiBP and DiNP increased by > 100%. To our knowledge, this is the first examination to date of temporal trends in phthalates exposures among a large, nationally representative sample of the U.S. population. Our findings are consistent with those from a German biomonitoring study that examined temporal trends over two decades in a convenience sample of predominately university students (age range, 20–29 years) (Wittassek et al. 2007).
Significant data gaps make it difficult to identify the underlying reasons for the observed trends in phthalate exposure with certainty. Although biomonitoring studies are useful for documenting population exposures to environmental chemicals, they are limited in their ability to identify the contribution of specific sources to personal exposure. Another data source that could provide insight on our findings is chemical production data available from the U.S. EPA (Chemical Data Reporting; http://epa.gov/cdr/). The data available for our study period suggest relatively stable trends in production for most phthalates (see Supplemental Material, Table S6). However, it is difficult to assess temporal trends in U.S. phthalate production with this data because chemical production by year is reported as a range (e.g., 100–500 million pounds/year) and not available on an annual basis but instead in 4- to 6-year intervals. In Germany, where more precise data is readily available, researchers report that a decline in production was accompanied by a decline in exposure to DnBP and DEHP (Wittassek et al. 2011).
As expected, we observed declines in metabolites of those phthalates that have been the focus of legislative activities, including bans on DnBP, BBzP, and DEHP in children’s products. However, legislative activity does not entirely explain the observed trends. For example, among the phthalates in the present study, we found the largest reductions in metabolite concentrations of DEP, a phthalate used in fragrances that is neither regulated in the United States or the European Union. In addition, metabolites of DnBP, BBzP, and DEHP were still detected in nearly all participants and the decline in DnBP metabolite concentrations was modest.
The success of advocacy efforts by public health and environmental organizations such as the Campaign for Safe Cosmetics (2014) may partly explain some of our findings. This campaign began in 2002 with a landmark report that documented widespread detection of DEP, DnBP, BBzP, and DEHP in the majority of beauty products tested (Houlihan et al. 2002). Over the last decade, it has used a multiprong strategy to reduce phthalate exposures from cosmetics by increasing consumer awareness of phthalate toxicity, creating a market for phthalate-free products, and pressuring the cosmetics industry to disclose chemical ingredients in their products (Campaign for Safe Cosmetics 2011). Although there are few data available on the extent of product reformulation in the United States, there is some evidence to suggest that the campaign’s activities have been influential in changing industry practices. For example, there has been an increased consumer demand for alternative products making it the fastest growing sector of the cosmetics market (Campaign for Safe Cosmetics 2011). Since 2004, more than 1,000 companies have pledged to remove chemicals of concern from personal care products and increase transparency of chemical ingredients in their products (Campaign for Safe Cosmetics 2011). In 2008, the coalition tested a subset of products originally examined in 2002 and found less frequent detection and lower concentrations of phthalates in most products (Campaign for Safe Cosmetics 2008). Our data suggest that reductions in DEP exposures have been the most pronounced, possibly because of changes in the formulation or use of personal care products, which are an important source of exposure to DEP (Duty et al. 2005; Just et al. 2010; Koch et al. 2013; Wormuth et al. 2006). Consistent with this hypothesis, metabolites of DnBP and DEHP declined less than DEP in NHANES over the study period. Diet is considered to be a principle route of DEHP exposure (Fromme et al. 2007; Koch et al. 2013; Wormuth et al. 2006), and DnBP exposures are not readily explained by either personal care product use or food-related sources (Duty et al. 2005; Fromme et al. 2007; Just et al. 2010; Koch et al. 2013). Future studies should examine how concentrations of individual phthalates in common exposure sources (such as building materials, cosmetics, and food) are changing over time. Moreover, future intervention efforts should consider aggregate sources of exposure if the goal is to reduce overall risk.
The rise in metabolite concentrations of DiBP and some high-molecular-weight phthalates suggest that manufacturers may be using them as substitutes for other phthalates even though the U.S. EPA has expressed concern about their use (U.S. EPA 2012), and there is an interim restriction on DnOP, DiNP, and DiDP in certain children’s toys (CPSIA 2008). DiBP is structurally similar to DnBP and may be a substitute for DnBP (Wittassek et al. 2007). DiNP and DiDP are replacing DEHP as a plasticizer in the global market (European Chemicals Agency 2012), including in the green or “safer alternatives” market (Dodson et al. 2012). For example, Dodson et al. (2012) measured chemical ingredients in conventional and alternative consumer products purchased in 2007 and detected DiNP in alternative products only. Similarly, they detected DiBP but not DnBP in nail polish samples. Toxicological studies suggest that DiBP and DiNP may disrupt androgen signaling and act cumulatively with other phthalates to affect male reproductive end points (National Research Council 2008). Although epidemiologic evidence of these replacement phthalates is limited, a recent cross-sectional study of 623 Norwegian children (Bertelsen et al. 2013) reported associations between current asthma and urinary metabolites of DiNP and DiDP, but not with any of the other phthalate metabolites. Given the likely increase in human exposure to replacement phthalates, further study on their adverse health effects in epidemiologic studies is warranted.
Our findings also suggest that temporal trends in phthalates exposure are not uniform across the population and that subpopulations with the highest initial phthalates exposures often experienced the greatest decline over the study period. For example, we observed a more rapid decline in DEP metabolite concentrations in adults and adolescents compared with children, possibly reflecting differences in personal care product use. We also found a greater decline in concentrations of DnBP and DEHP metabolites among females than males, potentially reflecting differences in exposure sources or behavior. For example, a Swiss study of 1,215 participants found that women have a higher risk perception of chemicals and a stronger preference for natural food than men (Dickson-Spillmann et al. 2011). For high-molecular-weight phthalates such as DEHP and DiDP, metabolite concentrations were higher in children than adults, but the gap between groups narrowed over time. These phthalates are commonly used in PVC applications including toys, and the larger reductions among children may reflect the legislative emphasis on limiting phthalates in children’s toys.
There are several key strengths to our study. NHANES provides an unparalleled opportunity to document changes in environmental chemicals exposures because each survey captures a large, nationally representative sample of the general U.S. population that is diverse with respect to geography, age, race/ethnicity, and income. The large and diverse sample allows for statistically reliable assessment of trends in demographic subgroups.
Our main study limitation is the cross-sectional design of NHANES that inhibits examination of longitudinal changes in phthalates metabolite concentrations in the same participants. Also, NHANES does not measure phthalate metabolites in children < 6 years of age. Our findings may not be generalizable to young children, who may experience different exposures to some phthalates than older children as a result of their higher food consumption related to body weight, higher dust ingestion from their playing habits, and distinct mouthing behavior (Becker et al. 2009; Wittassek et al. 2011); children also possess different behaviors and physiology than adults (U.S. EPA 2008). Additional biomonitoring studies in young children may be warranted because of their potentially higher susceptibility to the adverse effects of environmental stressors and because young children are likely to be most impacted by regulations limiting phthalate content in toys. There may be false positives due to the large number of models evaluated. However, all of our main findings (presented in Figures 1 and 2) and half of the interaction models would pass Bonferroni correction for multiple testing. Last, although the CDC conducted all phthalate metabolite measurements, modifications were made to the analytical methods between cycles that may affect the frequency of detection of the measured metabolites. To account for some of these differences, we applied the same LOD to each cycle.
Conclusions
Our analysis of biomonitoring data from a nationally representative sample suggests that U.S. population exposure to phthalates has changed in the last decade. Although exposures to DnBP, BBzP, and DEHP have declined, exposures to replacement phthalates such as DiNP and DiBP have increased. The observed temporal trends are difficult to explain because of significant data gaps, but may at least partly reflect the effects of legislative activity and the advocacy efforts of nongovernmental organizations on consumer behavior and the use of phthalates in consumer products.
Supplemental Material
Acknowledgments
We acknowledge the Centers for Disease Control and Prevention (CDC) staff who contributed to the collection and analysis of the samples. We thank C. McCulloch from the University of California San Francisco (UCSF) Department of Epidemiology and Biostatistics for his statistical advice.
Footnotes
The bulk of the work for this study was completed during A.R.Z.’s postdoctoral fellowship at UCSF. Funding was provided by Pew Charitable Trusts, the Passport Science Innovation Fund, and the National Institute of Environmental Health Sciences/National Institutes of Health (grant K99ES019881).
The findings and conclusions in this report are those of the authors and do not necessarily represent the official position of the CDC.
The authors declare they have no actual or potential competing financial interests.
References
- Al-Saleh I, Shinwari N, Alsabbaheen A. Phthalates residues in plastic bottled waters. J Toxicol Sci. 2011;36:469–478. doi: 10.2131/jts.36.469. [DOI] [PubMed] [Google Scholar]
- Barlow NJ, Foster PM. Pathogenesis of male reproductive tract lesions from gestation through adulthood following in utero exposure to di (n-butyl) phthalate. Toxicol Pathol. 2003;31:397–410. doi: 10.1080/01926230390202335. [DOI] [PubMed] [Google Scholar]
- Barr DB, Wilder LC, Caudill SP, Gonzalez AJ, Needham LL, Pirkle JL.2005Urinary creatinine concentrations in the U.S. population: implications for urinary biologic monitoring measurements. Environ Health Perspect 113192–200.; 10.1289/ehp.7337 [DOI] [PMC free article] [PubMed] [Google Scholar]
- Becker K, Güen T, Seiwert M, Conrad A, Pick-Fuß H, Müller J, et al. GerES IV: phthalate metabolites and bisphenol A in urine of German children. Int J Hyg Envir Heal. 2009;212:685–692. doi: 10.1016/j.ijheh.2009.08.002. [DOI] [PubMed] [Google Scholar]
- Bertelsen RJ, Carlsen KCL, Calafat AM, Hoppin JA, Håland G, Mowinckel P, et al. Urinary biomarkers for phthalates associated with asthma in Norwegian children. Environ Health Perspect. 2013;121:251–256. doi: 10.1289/ehp.1205256. [DOI] [PMC free article] [PubMed] [Google Scholar]
- Braun JM, Sathyanarayana S, Hauser R. Phthalate exposure and children’s health. Curr Opin Pediatr. 2013;25:247–254. doi: 10.1097/MOP.0b013e32835e1eb6. [DOI] [PMC free article] [PubMed] [Google Scholar]
- Campaign for Safe Cosmetics. A Little Prettier. 2008. Available: http://www.safecosmetics.org/downloads/A-Little-Prettier_Dec08.pdf [accessed 23 January 2014]
- Campaign for Safe Cosmetics. Market Shift: The Story of the Compact for Safe Cosmetics and the Growth in Demand for Safe Cosmetics. 2011. Available: http://www.safecosmetics.org/downloads/MarketShift_CSC_Dec2011.pdf [accessed 23 January 2014]
- Campaign for Safe Cosmetics. The Campaign for Safe Cosmetics Homepage. 2014. Available: http://www.safecosmetics.org [accessed 22 January 2014]
- CDC (Centers for Disease Control and Prevention). Fourth National Report on Human Exposure to Environmental Chemicals: Updated Tables. Atlanta, GA. 2013. Available: http://www.cdc.gov/exposurereport/ [accessed 23 January 2014]
- Cirillo T, Fasano E, Esposito F, Del Prete E, Cocchieri RA. Study on the influence of temperature, storage time and packaging type on di-n-butylphthalate and di(2-ethylhexyl)phthalate release into packed meals. Food Addit Contam Part A Chem Anal Control Expo Risk Assess. 2013;30:403–411. doi: 10.1080/19440049.2012.745198. [DOI] [PubMed] [Google Scholar]
- CPSIA (Consumer Product Safety Improvement Act). Public Law. 2008:110–314. [Google Scholar]
- Dickson-Spillmann M, Siegrist M, Keller C. Attitudes toward chemicals are associated with preference for natural food. Food Qual Prefer. 2011;22:149–156. [Google Scholar]
- Dodson RE, Nishioka M, Standley LJ, Perovich LJ, Brody JG, Rudel RA.2012Endocrine disruptors and asthma-associated chemicals in consumer products. Environ Health Perspect 120935–943.; 10.1289/ehp.1104052 [DOI] [PMC free article] [PubMed] [Google Scholar]
- Duty SM, Ackerman RM, Calafat AM, Hauser R.2005Personal care product use predicts urinary concentrations of some phthalate monoesters. Environ Health Perspect 1131530; 10.1289/ehp.8083 [DOI] [PMC free article] [PubMed] [Google Scholar]
- Engel SM, Zhu C, Berkowitz GS, Calafat AM, Silva MJ, Miodovnik A, et al. Prenatal phthalate exposure and performance on the Neonatal Behavioral Assessment Scale in a multiethnic birth cohort. Neurotoxicology. 2009;30:522–528. doi: 10.1016/j.neuro.2009.04.001. [DOI] [PMC free article] [PubMed] [Google Scholar]
- EU (European Union). Commission Directive 2004/93/EC of 21 September 2004 Amending Council Directive 76/768/EEC for the Purpose of Adapting Its Annexes II and III to Technical Progress. Off J Eur Union L 300:25.9.2004, 13–41. 2004. Available: http://eur-lex.europa.eu/LexUriServ/LexUriServ.do?uri=OJ:L:2004:300:0013:0041:EN:PDF [accessed 23 January 2014]
- EU (European Union). Directive 2005/84/EC of the European Parliament and of the Council 14 December 2005 Amending for the 22nd time Council Directive 76/769/EEC on the Approximation of the Laws, Regulations and Administrative Provisions of the Member States Relating to Restrictions on the Marketing and Use of Certain Dangerous Substances and Preparations (Phthalates in Toys and Childcare Articles). Off J Eur Union L 344:27.12.2005, 40–43. 2005. Available: http://eur-lex.europa.eu/LexUriServ/LexUriServ.do?uri=OJ:L:2005:344:0040:0043:EN:PDF [accessed 23 January 2014]
- EU (European Union). Commission Directive 2007/19/EC of 30 March 2007 Amending Directive 2002/72/EC Relating to Plastic Materials and Articles Intended to Come into Contact with Food and Council Directive 85/572/EEC Laying Down the List of Simulants to Be Used for Testing Migration of Constituents of Plastic Materials and Articles Intended to Come into Contact with Foodstuffs. Off J Eur Union L 91:31.3.2007, 17–36. 2007. Available: http://eur-lex.europa.eu/LexUriServ/LexUriServ.do?uri=OJ:L:2007:091:0017:0036:EN:PDF [accessed 23 January 2014]
- European Chemicals Agency. Evaluation of New Scientific Evidence Concerning DINP and DIDP in Relation to Entry 52 of Annex XVII to Regulation (EC) No 1907/2006 (REACH). 2012.
- Fierens T, Servaes K, Van Holderbeke M, Geerts L, De Henauw S, Sioen I, et al. Analysis of phthalates in food products and packaging materials sold on the Belgian market. Food Chem Toxicol. 2012;50:2575–2583. doi: 10.1016/j.fct.2012.04.029. [DOI] [PubMed] [Google Scholar]
- Foster P. Disruption of reproductive development in male rat offspring following in utero exposure to phthalate esters. Int J Androl. 2005;29:140–147. doi: 10.1111/j.1365-2605.2005.00563.x. [DOI] [PubMed] [Google Scholar]
- Frederiksen H, Sorensen K, Mouritsen A, Aksglaede L, Hagen C, Petersen J, et al. High urinary phthalate concentration associated with delayed pubarche in girls. Int J Androl. 2012;35:216–226. doi: 10.1111/j.1365-2605.2012.01260.x. [DOI] [PubMed] [Google Scholar]
- Fromme H, Gruber L, Schlummer M, Wolz G, Böhmer S, Angerer J, et al. Intake of phthalates and di (2-ethylhexyl) adipate: results of the Integrated Exposure Assessment Survey based on duplicate diet samples and biomonitoring data. Environ Int. 2007;33:1012–1020. doi: 10.1016/j.envint.2007.05.006. [DOI] [PubMed] [Google Scholar]
- Gray LE, Jr, Ostby J, Furr J, Price M, Veeramachaneni DN, Parks L. Perinatal exposure to the phthalates DEHP, BBP, and DINP, but not DEP, DMP, or DOTP, alters sexual differentiation of the male rat. Toxicol Sci. 2000;58:350–365. doi: 10.1093/toxsci/58.2.350. [DOI] [PubMed] [Google Scholar]
- Hauser R, Meeker JD, Duty S, Silva MJ, Calafat AM. Altered semen quality in relation to urinary concentrations of phthalate monoester and oxidative metabolites. Epidemiology. 2006;17:682–691. doi: 10.1097/01.ede.0000235996.89953.d7. [DOI] [PubMed] [Google Scholar]
- Hauser R, Meeker J, Singh N, Silva M, Ryan L, Duty S, et al. DNA damage in human sperm is related to urinary levels of phthalate monoester and oxidative metabolites. Hum Reprod. 2007;22:688–695. doi: 10.1093/humrep/del428. [DOI] [PubMed] [Google Scholar]
- Hornung RW, Reed LD. Estimation of average concentration in the presence of nondetectable values. Appl Occup Environ Hyg. 1990;5:46–51. [Google Scholar]
- Houlihan J, Brody C, Schwan B. Not Too Pretty: Phthalates, Beauty Products, and the FDA. Washington, DC:Environmental Working Group. 2002. Available: http://www.safecosmetics.org/downloads/NotTooPretty_report.pdf [accessed 23 January 2014]
- Howdeshell KL, Wilson VS, Furr J, Lambright CR, Rider CV, Blystone CR, et al. A mixture of five phthalate esters inhibits fetal testicular testosterone production in the Sprague-Dawley rat in a cumulative, dose-additive manner. Toxicol Sci. 2008;105:153–165. doi: 10.1093/toxsci/kfn077. [DOI] [PubMed] [Google Scholar]
- Just AC, Adibi JJ, Rundle AG, Calafat AM, Camann DE, Hauser R, et al. Urinary and air phthalate concentrations and self-reported use of personal care products among minority pregnant women in New York City. J Expo Sci Environ Epidemiol. 2010;20:625–633. doi: 10.1038/jes.2010.13. [DOI] [PMC free article] [PubMed] [Google Scholar]
- Karunamoorthi K, Sabesan S. Laboratory evaluation of dimethyl phthalate treated wristbands against three predominant mosquito (Diptera: Culicidae) vectors of disease. Eur Rev Med Pharmacol Sci. 2010;14:443–448. [PubMed] [Google Scholar]
- Kavlock R, Boekelheide K, Chapin R, Cunningham M, Faustman E, Foster P, et al. NTP Center for the Evaluation of Risks to Human Reproduction: phthalates expert panel report on the reproductive and developmental toxicity of butyl benzyl phthalate. Reprod Toxicol. 2002;16:453–487. doi: 10.1016/s0890-6238(02)00029-1. [DOI] [PubMed] [Google Scholar]
- Kawakami T, Isama K, Matsuoka A. Analysis of phthalic acid diesters, monoester, and other plasticizers in polyvinyl chloride household products in Japan. J Environ Sci Health A Tox Hazard Subst Environ Eng. 2011;46:855–864. doi: 10.1080/10934529.2011.579870. [DOI] [PubMed] [Google Scholar]
- Kelley KE, Hernandez-Diaz S, Chaplin EL, Hauser R, Mitchell AA.2012Identification of phthalates in medications and dietary supplement formulations in the United States and Canada. Environ Health Perspect 120379–384.; 10.1289/ehp.1103998 [DOI] [PMC free article] [PubMed] [Google Scholar]
- Kobrosly RW, Parlett LE, Stahlhut RW, Barrett ES, Swan SH. Socioeconomic factors and phthalate metabolite concentrations among United States women of reproductive age. Environ Res. 2012;115:11–17. doi: 10.1016/j.envres.2012.03.008. [DOI] [PubMed] [Google Scholar]
- Koch HM, Drexler H, Angerer J. Internal exposure of nursery-school children and their parents and teachers to di(2-ethylhexyl)phthalate (DEHP). Int J Hyg Environ Health. 2004;207:15–22. doi: 10.1078/1438-4639-00270. [DOI] [PubMed] [Google Scholar]
- Koch HM, Lorber M, Christensen KLY, Pälmke C, Koslitz S, Brüning T. Identifying sources of phthalate exposure with human biomonitoring: Results of a 48 h fasting study with urine collection and personal activity patterns. Int J Hyg Environ Health. 2013;216:672–681. doi: 10.1016/j.ijheh.2012.12.002. [DOI] [PubMed] [Google Scholar]
- Koniecki D, Wang R, Moody RP, Zhu J. Phthalates in cosmetic and personal care products: concentrations and possible dermal exposure. Environ Res. 2011;111:329–336. doi: 10.1016/j.envres.2011.01.013. [DOI] [PubMed] [Google Scholar]
- Langlois É, LeBlanc A, Simard Y, Thellen C. Accuracy investigation of phthalate metabolite standards. J Anal Toxicol. 2012;36:270–279. doi: 10.1093/jat/bks016. [DOI] [PubMed] [Google Scholar]
- McKinnell C, Sharpe RM, Mahood K, Hallmark N, Scott H, Ivell R, et al. Expression of insulin-like factor 3 protein in the rat testis during fetal and postnatal development and in relation to cryptorchidism induced by in utero exposure to di (n-butyl) phthalate. Endocrinology. 2005;146:4536–4544. doi: 10.1210/en.2005-0676. [DOI] [PubMed] [Google Scholar]
- Meeker JD, Sathyanarayana S, Swan SH. Phthalates and other additives in plastics: human exposure and associated health outcomes. Philos Trans R Soc Lond B Biol Sci. 2009;364:2097–2113. doi: 10.1098/rstb.2008.0268. [DOI] [PMC free article] [PubMed] [Google Scholar]
- National Center for Health Statistics. Hyattsville, MD: National Center for Health Statistics; 2006. Analytical and Reporting Guidelines: The National Health and Nutritional Examination Survey (NHANES) [Google Scholar]
- National Research Council. Washington, DC: National Academies Press; 2008. Phthalates and Cumulative Risk Assessment: The Tasks Ahead. [PubMed] [Google Scholar]
- Parks LG, Ostby JS, Lambright CR, Abbott BD, Klinefelter GR, Barlow NJ, et al. The plasticizer diethylhexyl phthalate induces malformations by decreasing fetal testosterone synthesis during sexual differentiation in the male rat. Toxicol Sci. 2000;58:339–349. doi: 10.1093/toxsci/58.2.339. [DOI] [PubMed] [Google Scholar]
- Schecter A, Lorber M, Guo Y, Wu Q, Yun SH, Kannan K, et al. 2013Phthalate concentrations and dietary exposure from food purchased in New York State. Environ Health Perspect 121473–494.; 10.1289/ehp.1206367 [DOI] [PMC free article] [PubMed] [Google Scholar]
- Silva MJ, Barr DB, Reidy JA, Malek NA, Hodge CC, Caudill SP, et al. 2004Urinary levels of seven phthalate metabolites in the U.S. population from the National Health and Nutrition Examination Survey (NHANES) 1999–2000. Environ Health Perspect 112331–338.; 10.1289/ehp.6723 [DOI] [PMC free article] [PubMed] [Google Scholar]
- Stringer R, Labunska I, Santillo D, Johnston P, Siddorn J, Stephenson A. Concentrations of phthalate esters and identification of other additives in PVC children’s toys. Environ Sci Pollut Res Int. 2000;7:27–36. doi: 10.1065/espr199910.007. [DOI] [PubMed] [Google Scholar]
- Swan SH, Liu F, Hines M, Kruse RL, Wang C, Redmon JB, et al. Prenatal phthalate exposure and reduced masculine play in boys. Int J Androl. 2010;33:259–269. doi: 10.1111/j.1365-2605.2009.01019.x. [DOI] [PMC free article] [PubMed] [Google Scholar]
- Swan SH, Main KM, Liu F, Stewart SL, Kruse RL, Calafat AM, et al. 2005Decrease in anogenital distance among male infants with prenatal phthalate exposure. Environ Health Perspect 1131056–1061.; 10.1289/ehp.8100 [DOI] [PMC free article] [PubMed] [Google Scholar]
- Trasande L, Attina TM, Sathyanarayana S, Spanier AJ, Blustein J.2013Race/ethnicity-specific associations of urinary phthalates with childhood body mass in a nationally representative sample. Environ Health Perspect 121501–506.; 10.1289/ehp.1205526 [DOI] [PMC free article] [PubMed] [Google Scholar]
- U.S. EPA (U.S. Environmental Protection Agency). Child-Specific Exposure Factors Handbook. 2008. Available: http://cfpub.epa.gov/ncea/risk/recordisplay.cfm?deid=199243 [accessed 23 January 2014]
- U.S. EPA (U.S. Environmental Protection Agency). Phthalates Action Plan (Revised). 2012. Available: http://www.epa.gov/oppt/existingchemicals/pubs/actionplans/phthalates_actionplan_revised_2012-03-14.pdf [accessed 24 January 2014]
- Whyatt RM, Liu X, Rauh VA, Calafat AM, Just AC, Hoepner L, et al. 2012Maternal prenatal urinary phthalate metabolite concentrations and child mental, psychomotor, and behavioral development at 3 years of age. Environ Health Perspect 120290–295.; 10.1289/ehp.1103705 [DOI] [PMC free article] [PubMed] [Google Scholar]
- Wilson VS, Lambright C, Furr J, Ostby J, Wood C, Held G, et al. Phthalate ester-induced gubernacular lesions are associated with reduced insl3 gene expression in the fetal rat testis. Toxicol Lett. 2004;146:207–215. doi: 10.1016/j.toxlet.2003.09.012. [DOI] [PubMed] [Google Scholar]
- Wittassek M, Koch HM, Angerer J, Brüning T. Assessing exposure to phthalates—the human biomonitoring approach. Mol Nutr Food Res. 2011;55:7–31. doi: 10.1002/mnfr.201000121. [DOI] [PubMed] [Google Scholar]
- Wittassek M, Wiesmüller GA, Koch HM, Eckard R, Dobler L, Müller J, et al. Internal phthalate exposure over the last two decades—a retrospective human biomonitoring study. Int J Hyg Environ Health. 2007;210:319. doi: 10.1016/j.ijheh.2007.01.037. [DOI] [PubMed] [Google Scholar]
- Wolff MS, Teitelbaum SL, Pinney SM, Windham G, Liao L, Biro F, et al. 2010Investigation of relationships between urinary biomarkers of phytoestrogens, phthalates, and phenols and pubertal stages in girls. Environ Health Perspect 1181039–1046.; 10.1289/ehp.0901690 [DOI] [PMC free article] [PubMed] [Google Scholar]
- Woodruff TJ, Zota AR, Schwartz JM.2011Environmental chemicals in pregnant women in the United States: NHANES 2003–2004. Environ Health Perspect 119878–885.; 10.1289/ehp.1002727 [DOI] [PMC free article] [PubMed] [Google Scholar]
- Wormuth M, Scheringer M, Vollenweider M, Hungerbühler K. What are the sources of exposure to eight frequently used phthalic acid esters in Europeans? Risk Anal. 2006;26:803–824. doi: 10.1111/j.1539-6924.2006.00770.x. [DOI] [PubMed] [Google Scholar]
Associated Data
This section collects any data citations, data availability statements, or supplementary materials included in this article.