Abstract
Chronic hypertension induces cerebrovascular remodeling, changing the inner diameter and elasticity of arterial vessels. To examine cerebrovascular morphologic changes and vasodilatory impairment in early-stage hypertension, we measured baseline (normocapnic) cerebral arterial blood volume (CBVa) and cerebral blood flow (CBF) as well as hypercapnia-induced dynamic vascular responses in animal models. All experiments were performed with young (3 to 4 month old) spontaneously hypertensive rats (SHR) and control Wistar–Kyoto rats (WKY) under ∼1% isoflurane anesthesia at 9.4 Tesla. Baseline regional CBF values were similar in both animal groups, whereas SHR had significantly lower CBVa values, especially in the hippocampus area. As CBF is maintained by adjusting arterial diameters within the autoregulatory blood pressure range, CBVa is likely more sensitive than CBF for detecting hypertensive-mediated alterations. Unexpectedly, hypercapnia-induced CBF and blood-oxygenation-level-dependent (BOLD) response were significantly higher in SHR as compared with WKY, and the CBF reactivity was highly correlated with the BOLD reactivity in both groups. The higher reactivity in early-stage hypertensive animals indicates no significant vascular remodeling occurred. At later stages of hypertension, the reduced vascular reactivity is expected. Thus, CBF and CBVa mapping may provide novel insights into regional cerebrovascular impairment in hypertension and its progression as hypertension advances.
Keywords: arterial CBV, BOLD, CBF, cerebrovascular reactivity, hippocampus, hypertension
Introduction
The adaptive response of arterial vessels to chronic hypertension includes a narrowing of the lumen and an increase in wall thickness.1, 2 Consequently, cerebral arterial blood volume (CBVa) and arterial vessel elasticity decrease, which may in turn alter arterial vascular reactivity to various stimuli. These cerebrovascular alterations could eventually lead to a regional reduction in cerebral blood flow (CBF) and tissue oxygenation,3, 4, 5 thereby increasing the risk of stroke, vascular dementia, and cognitive decline.6, 7, 8 However, early-stage alterations in the cerebrovasculature are easily modified. As the cerebral regulation of blood pressure differs from the systemic regulation, treatment aimed at reducing peripheral blood pressure may not provide the necessary therapy to prevent impairments of the brain vasculature. Therefore, the ability to detect the progression of hypertension and cerebrovascular remodeling by in vivo imaging is vital.
Hypertension-induced alterations in CBF have been assessed by magnetic resonance imaging (MRI), single-photon emission computed tomography and positron emission tomography, which reported a slight reduction in baseline (normocapnic) CBF in some,8, 9, 10 but not in all hypertensive subjects.1, 11, 12, 13, 14 In addition, studies showed that, as compared with normotensive subjects, hypertensive subjects have a blunted CBF response to neural tasks11 and CO2 stimulus.15 In general, the brain maintains adequate CBF within a certain autoregulatory range independent of changes in systemic arterial pressure by adjusting vessel diameters of arteries and arterioles. In early-stage hypertension, CBF may maintain constant despite a decrease in CBVa, before the compensation eventually fails. Thus, CBVa may be a more sensitive index than CBF for identifying and assessing cerebrovascular risk factors in early-stage hypertension, and its reduction may be an early predictor of altered CBF.
In this study, we measured quantitative CBF and CBVa, as well as cerebrovascular reactivity in a well-established hypertensive animal model (spontaneously hypertensive rats (SHR)) and a control model (Wistar–Kyoto rats (WKY)) to detect regional hypertensive cerebrovascular changes. Quantitative CBF was measured with arterial spin labeling (ASL) MRI, and quantitative CBVa was obtained using magnetization transfer (MT)-varied MRI.16, 17, 18 Varying the MT effect allowed us to separate MT-sensitive tissue from the MT-insensitive arterial blood signal.16, 17, 18 Dynamic cerebrovascular reactivity as a response to hypercapnic manipulation was measured by blood-oxygenation-level-dependent (BOLD) functional magnetic resonance imaging in addition to CBF and CBVa MRI. As BOLD functional magnetic resonance imaging is a vascular measure complementary to CBF and CBVa, combining all three measures may provide important indices of vascular reserve and vessel viability.
Materials and Methods
Animal Preparation and Hypercapnia Stimulation
All animal protocols were approved by the University of Pittsburgh Institutional Animal Care and Use Committee, in accordance with the National Institutes of Health Guide for the Care and Use of Laboratory Animals. A total of twenty four male rats were studied (Charles River Laboratories, Wilmington, MA, USA); twelve animals each for the SHR and WKY groups. All animals were used for baseline measurements, while ten SHR and eight WKY rats were used for hypercapnic challenge.
The animals were initially anesthetized with 5% isoflurane and intubated. Subsequently, the isoflurane level was reduced to 2% for surgery; the femoral artery and vein were catheterized to monitor arterial blood pressure and to administrate supplemental fluid, respectively. The isoflurane level was then reduced to ∼1% with air supplemented with O2 to attain a total O2 level of ∼30% throughout experiment, which assists maintaining a normal PaO2 level under anesthesia. The head of the animal was carefully secured in a home-built restrainer before placement in the magnet. During experiments, mean arterial blood pressure (MABP), end-tidal CO2 (EtCO2), O2, and isoflurane level were continuously monitored and recorded with Acqknowledge software (MP150, BIOPAC Systems, Goleta, CA, USA). Blood gases were measured (Stat profile pHOx, Nova Biomedical, Waltham, MA, USA) and ventilation rate and volume were adjusted accordingly. Body temperature was monitored by a rectal probe and maintained at 37 to 37.5°C with a feedback hot water circulator.
Thirty-second CO2 stimulation was performed by switching ventilation gas mixtures of air with 30% oxygen without and with ∼4% CO2 using an electronically controlled pneumatic valve. An inter-hypercapnia interval was >15 minutes. It should be noted that as longer stimulation and higher CO2 level require a longer inter-stimulus delay for returning to the baseline physiologic condition, the relatively short stimulus duration and mild hypercapnia were used for repeating experiments rapidly.
Magnetic Resonance Acquisitions
All studies were performed at a magnetic field strength of 9.4T with 310 mm diameter of bore size, interfaced to a Unity INOVA console (Varian, Palo Alto, CA, USA). The actively shielded gradient coil had an inner diameter of 120 mm with a gradient strength of 4 G/mm and a rise time of 130 microseconds (Magnex, Abingdon, UK). Two actively detunable radiofrequency (RF) coils were used: a butterfly-shaped surface coil positioned in the neck region for continuous ASL, and a surface coil of 23 mm diameter positioned on top of the head for tissue saturation via MT effects and for image acquisition. A three-dimensional anatomic image was acquired using a magnetization prepared rapid acquisition gradient echo sequence with TR=10 milliseconds, TE=5 milliseconds, TI=1.4 seconds, and a voxel resolution of 117 × 117 × 117 μm3. From the three-dimensional image, five 2-mm thick coronal slices were selected for cerebrovascular imaging. To compare with cerebrovascular images, T2-weighted 2-D images were then acquired in the same slices with TR=2 seconds, 8 echoes with 11-millisecond spacing, and an in-plane resolution of 58 × 58 μm2.
All physiologic images were acquired using the single-shot spin-echo echo planar imaging (EPI) technique with an in-plane resolution of 469 × 469 μm2, TE=18 milliseconds, and TR=3 seconds. A 2.75-second magnetization preparation period was used for applying ASL and MT-inducing RF pulses as described previously.19 Each experimental set included four ASL runs to obtain CBF and CBVa with improved temporal resolution; two runs each with two different MT saturation levels. In each ASL run, arterial spin labeled (lab) and control unlabeled (unlab) images were acquired repeatedly in an interleaved manner. The acquisition order of labeled (lab) and unlabeled (unlab) images was changed in alternate runs to increase the temporal resolution of the ASL data. The targeted MT saturation level was obtained by adjusting the power level of MT-inducing radiofrequency pulses with +8500 Hz off-resonance frequency; MT ratios (MTR) were (1−Ssat/S0)=0 and 0.5, where Ssat and S0 are the equilibrium signal in the presence and absence of MT saturation. Each CO2 challenge run consisted of 150-second pre-stimulation (25 lab and unlab images), 30-second hypercapnic stimulation (5 pair images), and 450-second post stimulation (75 pair images). Four to six experimental sets (16 to 24 runs) were obtained in each animal. For animal studies without CO2 challenge, a similar number of images were also acquired.
Data Processing
Data analysis was performed with STIMULATE (CMRR, http://www.cmrr.umn.edu/stimulate, Minneapolis, MN, USA), ImageJ (NIH, http://rsb.info.nih.gov/ij, Bethesda, MD, USA), and in-house Matlab routines (Mathworks, Natick, MA, USA). For each study, all runs with identical experimental conditions were averaged to generate group data. As two different orders of ASL and control image acquisition with 6-second temporal resolution were used, the practical temporal resolution was 3 seconds.19
Cerebral blood flow and CBVa maps were obtained, and regional baseline values and evoked responses were determined in a region-by-region basis. To select regions of interest (ROIs), 2-D anatomic images were generated from the three-dimensional anatomic image to match five-slice cerebrovascular maps. Then, five ROIs corresponding to the sensory cortex, motor cortex, caudate putamen, thalamus, and hippocampus were carefully and conservatively delineated on each of the five-slice anatomic images in both hemispheres, based on a rat atlas.20 Pixels with anatomic variations within the slice, such as those coinciding with the hippocampal and ventricle boundaries, were easily visualized with the high-resolution three-dimensional data, and not included. All pixels within each ROI were averaged for each subject's ROI analysis. Individual subject results were averaged and group data are reported as mean±s.d. A two-sample equal variance t-test was performed for statistical significance for the difference between both animal groups.
Baseline cerebral blood flow and cerebral arterial blood volume
For baseline CBF and CBVa measurements, all repeated ASL data were averaged during the pre-CO2 challenge period, or an all period in case of no CO2 challenge, resulting in one labeled and one unlabeled control image for MTR=0 (no MT effect), and MTR=0.5. Details of data processing were described previously.16, 17 Briefly, the ASL signals (ΔSASL,MT) were obtained from the difference between control and labeled images for each MTR level. The CBVa signal was separated from ΔSASL,MT using the different MT effects in tissue versus arterial blood. This is possible because tissue signals are selectively reduced by MT, while the arterial blood pool experiences only a minimal MT effect owing to the fast and continuous inflow of fresh blood spins from outside the region of the MT-inducing radiofrequency coil's coverage. Normalized ΔSASL,MT signals (ΔSASL,MT/S0) were linearly fitted against normalized control signals (SMT/S0), where S0 is the signal intensity from the control image with MTR=0. Cerebral blood flow (in units of mL/g per second) without any arterial blood volume contribution was determined from the slope of the linear fitting as
 |
where λ is the tissue–blood partition coefficient of 0.9 mL/g;21 T1 is the T1 value of tissue without MT and in the absence of CBF contributions; αc is the labeling efficiency of arterial spins at the capillary exchange site within the imaging slice, calculated as α0·exp(−τc/T1a), where α0 is the labeling efficiency at carotid artery=0.525 and τc is the blood transit time from carotid artery to exchange site=0.6 seconds;22 and ζ is the correction factor to the steady state, which is (1-exp(−Tlab/T1app)), where Tlab is the time span for the spin-preparation period=2.75 seconds and T1app (apparent T1)=1.9 seconds.23
Quantitative CBVa (in units of mL/g) was obtained from the intercept and slope of the linear fitting as
where αa is the labeling efficiency of spins entering the imaging slice, calculated as α0 × exp(−τa/T1a), where τa is the blood transit time from carotid artery to imaging slice=0.3 seconds22 and T1a is T1 value of arterial blood=2.3 seconds at 9.4 T.17
Dynamic changes in blood-oxygenation-level-dependent, cerebral blood flow, and cerebral arterial blood volume to hypercapnia
Hypercapnia-induced relative BOLD and CBF changes were obtained from control and ASL images, respectively, in the run without MT effect (MTR=0). To obtain dynamic CBVa changes induced by CO2 stimulation, values should be determined for each time point. However, only 4 to 6 runs were averaged, so this data did not have sufficient sensitivity to reliably quantify CBVa using the MT-varied ASL method. Instead, hypercapnia-induced CBVa changes were calculated with the MT-varied BOLD method.16, 18, 24 The CO2 stimulus-induced signal change normalized by S0 (ΔSBOLD,MT/S0) was linearly fitted against the normalized baseline signal, SMT/S0. The absolute change of CBVa (in units of mL/g) was obtained from the intercept, as ΔCBVa=λ × intercept.
Hypercapnia-induced hemodynamic responses did not reach the steady state (i.e. plateau) because of the 30-second stimulation; mean reactivity values for each animal were determined by averaging the hypercapnic period, which was defined from corresponding hemodynamic response as a time period between 6 seconds before the peak and 24 seconds after the peak, which is agreeing with ∼90% and ∼80% of the peak of BOLD response, respectively, for every measurements.
Results
During the experiments, all animals were maintained within normal physiologic ranges. Throughout the study, physiologic conditions were similar between WKY and SHR; pH=7.48±0.05 and 7.50±0.03, PaCO2=34.9±3.54 mm Hg and 31.3±3.47 mm Hg, PaO2=116±13 mm Hg and 133±24 mm Hg, EtCO2 before hypercapnic challenge=3.23±0.31% and 3.53±0.33%, SO2=97.8±1.6% and 98.7±0.6%, Hct=36.8±2.39% and 37.8±2.33%, body weight=325±39 g and 321±45 g, and age=16.7±3.2 and 14.7±2.6 weeks, respectively. However, the two groups had a significantly different MABP=98±11 mm Hg in WKY versus 148±18 mm Hg in SHR (P<0.0001). These MABP levels did not change during CO2 stimulation.
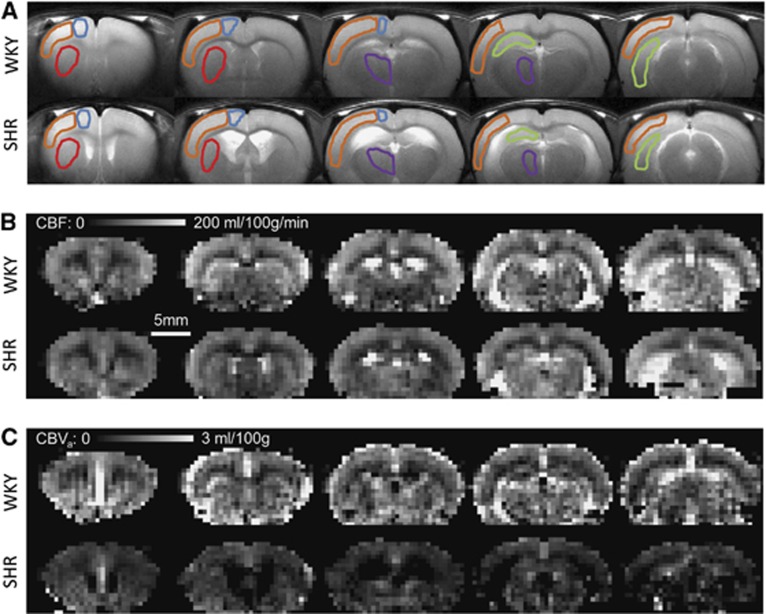
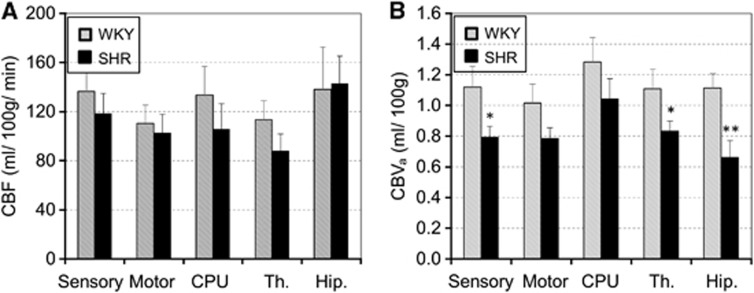
We evaluated the CBF and CBVa in the hypertensive and normotensive groups. Figure 1 shows T2-weighted anatomic images and quantitative maps of CBF and CBVa from one WKY and one SHR under the baseline condition (without CO2 stimulation). In T2-weighted images, ventricle areas indicating hyperintensity were enlarged in SHR, which is consistent with previous findings.25, 26, 27 Interestingly, CBF maps were similar for both groups, but SHR had much smaller CBVa values as compared with WKY. To determine similarities and differences between WKY and SHR, we conservatively chose five ROIs (see Figure 1A), and calculated their CBF and CBVa values (Figure 2). As expected from the CBF maps (Figure 1B), CBF values between the two groups were not significantly different (Figure 2A), despite a small difference in baseline PaCO2. However, CBVa values from SHR were lower than those from WKY in all five regions. The largest reduction of CBVa responding to hypertension was observed in the hippocampus, indicating that region-dependent cerebrovascular changes indeed occur.
Figure 1.
Anatomic T2-weighted images (A) and quantified cerebral blood flow (CBF) (B) and cerebral arterial blood volume (CBVa) (C) maps from Wistar–Kyoto rats (WKY) and spontaneously hypertensive rats (SHR). Data from one representative animal for each group are shown. The volume of hyperintense ventricles increased in SHR. Overall, both animal models had similar CBF values, whereas SHR demonstrated smaller CBVa values than WKY. Five regions of interest were chosen in both hemispheres, but overlaid on one hemisphere in the anatomic images; sensory cortex—orange; motor cortex—blue; caudate putaman—red; thalamus—purple; hippocampus—green.
Figure 2.
Baseline cerebral blood flow (CBF) (A) and cerebral arterial blood volume (CBVa) (B) of five regions of interest (ROIs) under the normocapnic condition. All 12 animal data for each group were averaged. Spontaneously hypertensive rats (SHR) had slightly lower CBF values as compared with Wistar–Kyoto rats (WKY), whereas CBVa values were signtificantly lower in most areas, particularly in the hippocampus (*P<0.05, **P<0.01). Error bars: s.e.m. (n=12); CPU, caudate putamen; Th, thalamus; Hip, hippocampus.
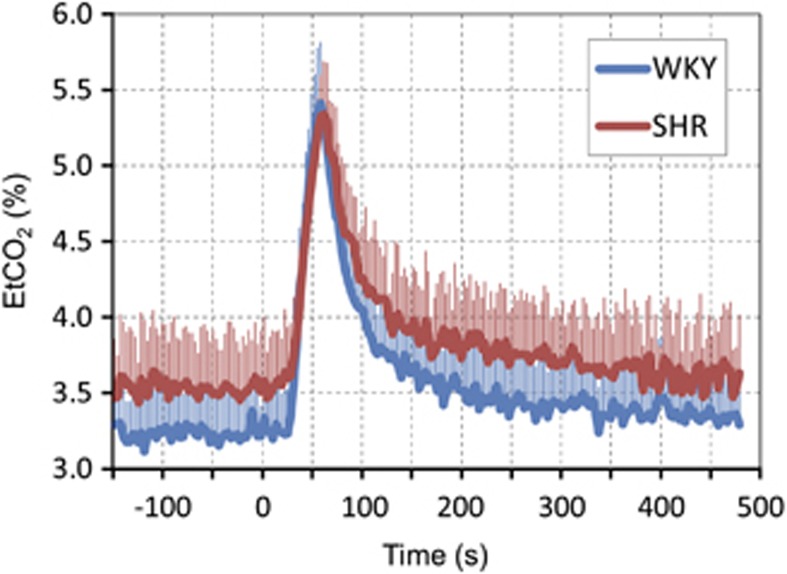
Dynamic EtCO2 responses induced by 30-second hypercapnia are plotted in Figure 3. The baseline EtCO2 level was slightly lower for WKY than for SHR. Owing to a long air delivery system, EtCO2 changed around 30 seconds after switching to a gas mixture with 4% CO2, but dynamic EtCO2 response was reproducible and consistent across all animals studied. The peak EtCO2 change was ∼1.8% to 2.1%, equivalent to ∼14 to 16 mm Hg in our anesthetized condition, which is higher than self-breathing awake human studies. The evoked EtCO2 change was slightly higher for WKY than for SHR.
Figure 3.
End-tidal CO2 (EtCO2) responses to CO2 stimulation. All animal data were averaged. Inhalation of ∼4% CO2 in a gas mixture of air with 30% oxygen began at time 0 and continued for 30 seconds; however, there was a delay owing to a long gas delivery system to the animal inside the magnet. In all animals, dynamic end-tidal CO2 responses were quite similar. Error bars: s.e.m. SHR, spontaneously hypertensive rats; WKY, Wistar–Kyoto rats.
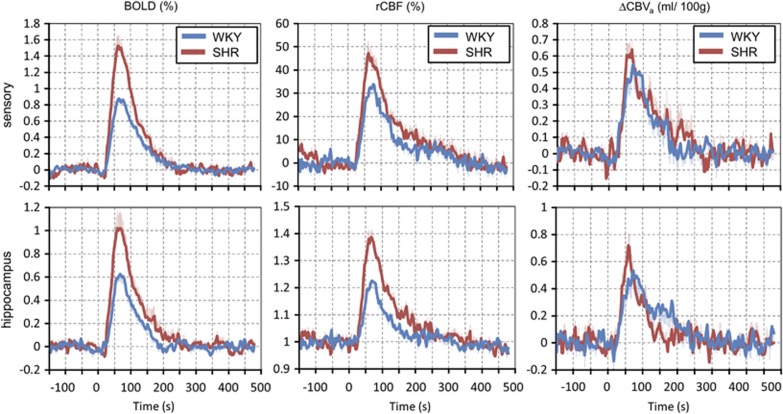
Hypercapnic challenge activated most pixels (75% to 95% of pixels for P<0.05) in all ROIs (data not shown). However, to minimize pixel selection bias for the comparison between SHR and WKY, all pixel values within each ROI were averaged for each animal. Group-averaged time courses of BOLD, rCBF, and ΔCBVa responses to hypercapnia are plotted in Figure 4. All regions had similar temporal patterns, so data of the sensory cortex and hippocampus ROIs are shown as representatives. Generally, the dynamics of BOLD and CBF responses were similar between SHR and WKY. Although a temporal resolution of 3 seconds did not allow us accurate analyses of dynamic properties, the time-to-peak of ΔCBVa appeared shorter for the SHR animals.
Figure 4.
Group-averaged blood-oxygenation-level-dependent (BOLD) (left), relative cerebral blood flow (rCBF) (middle) and cerebral arterial blood volume (ΔCBVa) (right) responses of the sensory (upper) and the hippocampus area (lower) to CO2 stimulation. The dynamics of BOLD and ΔCBF were similar, but their peak response was much higher for spontaneously hypertensive rats (SHR). The ΔCBVa responses in SHR appeared to have a slightly shorter time-to-peak and faster return with similar amplitude of signal changes. Error bars: s.e.m.. WKY, Wistar–Kyoto rats.
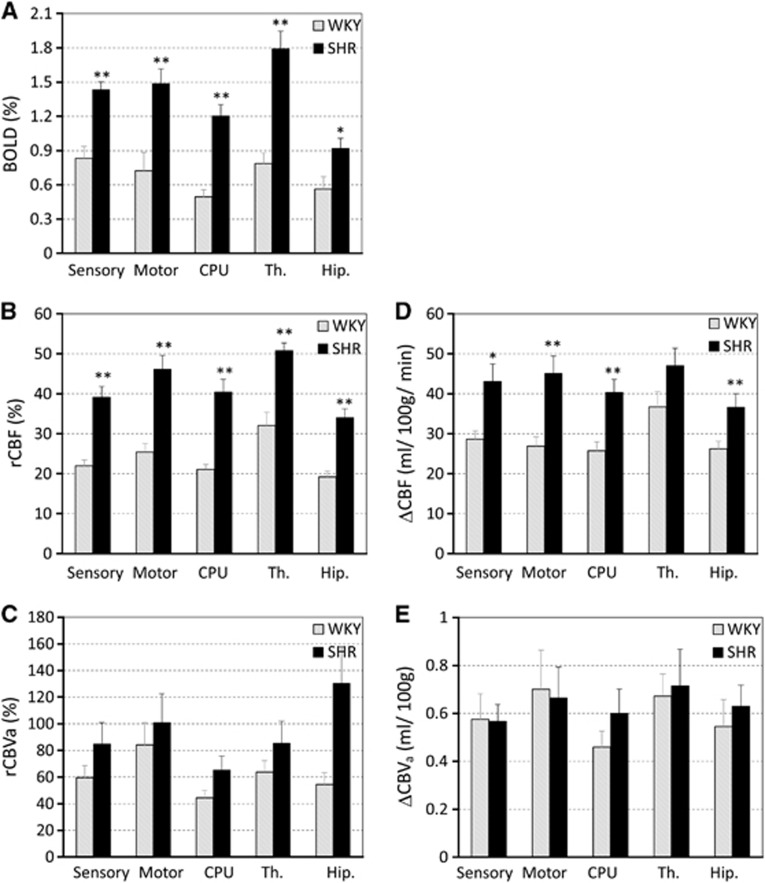
The amplitude changes of BOLD, rCBF, and ΔCBVa were obtained from hypercapnic data, and ΔCBF and relative CBVa were calculated with baseline CBF and CBVa. Group-averaged hypercapnia-induced BOLD, rCBF, relative CBVa, ΔCBF, and ΔCBVa are shown in Figure 5. Unlike higher evoked EtCO2 change for WKY versus SHR (see Figure 3) and similar baseline CBF values, SHR demonstrated a much larger BOLD and rCBF reactivity to hypercapnia than WKY in all five regions (P<0.01). However, ΔCBVa to hypercapnia did not show any difference between the two models (Figure 5E), but relative CBVa change was slightly higher for SHR than for WKY even though it was not statistically significant.
Figure 5.
Blood-oxygenation-level-dependent (BOLD) (A), relative cerebral blood flow (rCBF) change (B), relative cerebral arterial blood volume (rCBVa) change (C), ΔCBF (D) and ΔCBVa (E) during CO2 stimulation. Hypercapnia-induced BOLD and rCBF responses in spontaneously hypertensive rats (SHR) were significantly higher than those in Wistar–Kyoto (WKY) rats in all regions examined (*P<0.05). ΔCBVa responses between both groups were similar, whereas relative CBVa responses appeared higher for hypertensive animals. Error bars: s.e.m.; CPU, caudate putamen; Th, thalamus; Hip, hippocampus.
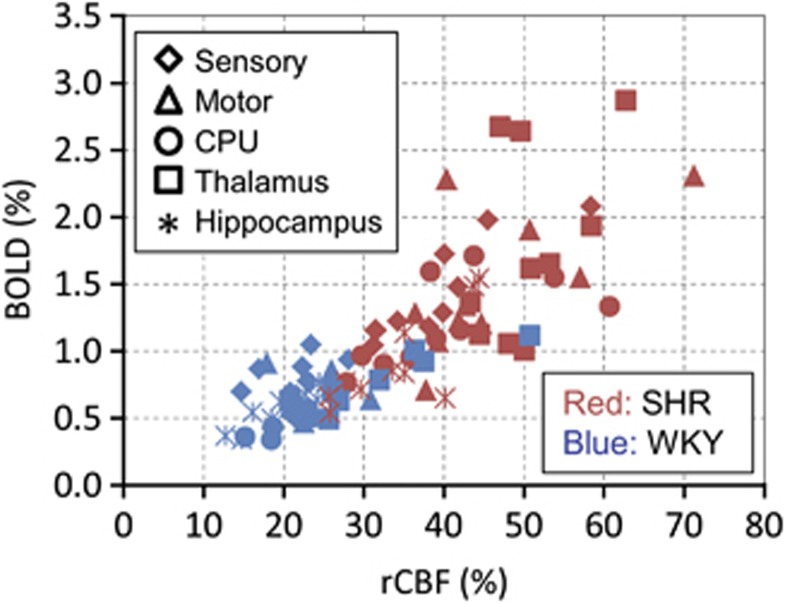
Blood-oxygenation-level-dependent and rCBF reactivity was highly correlated in both groups (Figure 6). The ratio of BOLD (%) to rCBF (%) (=BOLD/rCBF) were similar for WKY versus SHR; 0.039±0.008 versus 0.036±0.004 for sensory, 0.030±0.009 versus 0.032±0.009 for motor, and 0.029±0.003 versus 0.027±0.005 for the hippocampus, and slightly different for CPU, 0.023±0.002 versus 0.030±0.005 and for the thalamus, 0.025±0.003 versus 0.035±0.012. This indicates that the BOLD reactivity is a good index of CBF reactivity.
Figure 6.
Relationship between the hypercapnia-induced blood-oxygenation-level-dependent (BOLD) response and relative cerebral blood flow (rCBF) changes. This graph includes data from all five regions of interest (ROIs) (different symbols) in all of the animals. Blood-oxygenation-level-dependent responses were linearly correlated with rCBF changes in both spontaneously hypertensive rats (SHR) (red symbols) and Wistar–Kyoto rats (WKY) (blue symbols). This indicates that BOLD is a good index of CBF reactivity, as no oxygen consumption is expected.
Discussion
We investigated the regional cerebrovascular similarities and differences between SHR and normotensive controls using MRI techniques. These studies revealed several major findings: (1) both animal models had similar CBF values, but SHR had a smaller regional CBVa value than WKY; and (2) in response to CO2, SHR displayed greater CBF and BOLD reactivity than WKY, but both groups had a similar ΔCBVa.
Before we discuss the biologic implications of our studies, it is important to evaluate our methodologies critically. There are several concerns. (1) One concern is whether baseline CBF versus CBVa can be compared fairly owing to potentially different sensitivities. Both CBF and CBVa were obtained from exactly the same data sets using equations (1) and (2), respectively. Cerebral blood flow was calculated from the slope, whereas CBVa was determined primarily from the intercept of linear fitting, as the slope is much less than 2αa in equation (2). As only two points were used for fitting, fitting errors could not be determined. The ratio of pixel-wise SNR between (slope/T1) and intercept was 1.62, thus the error of CBVa would be higher than that of CBF. As CBF values were similar for SHR and WKY, higher errors in CBVa would induce less significant changes between the two animal models. However, the inter-animal variations of CBF and CBVa were similar (Figure 2), possibly due to a small error in ROI values. Consequently, significant baseline CBVa differences between two models cannot be explained by measurement error. (2) In our hypercapnic studies, different data sets were used; rCBF from ASL data (i.e., unlabeled—labeled) without MT, BOLD from unlabeled data without MT, and ΔCBVa from unlabeled data with and without MT. While both rCBF and BOLD responses were obtained directly by comparing values at baseline versus stimulation, ΔCBVa was from comparing intercepts of linear fitting. Further, less signal averaging was performed for dynamic studies compared with baseline measurements. Consequently, ΔCBVa is more prone to errors than BOLD and CBF responses. (3) As we used a relative short hypercapnic challenge, hemodynamic responses did not reach to a steady state. Thus, the averaged amplitudes measured during dynamic–hemodynamic changes were less than steady-state values, which were used in a major portion of the literature. However, relative reactivity values between two different animal models and between different vascular parameters were still valid.
Our results show that hypertensive animals have a reduction in CBVa as expected given the previous study that employed a microscope methodology.28 Increased MABP (hypertension) induces the constriction of arterial vessels to maintain the same CBF level. Therefore, CBVa can act as a key indicator for the detection of regional cerebrovascular changes in hypertension. Interestingly, we found that hypertension significantly altered the CBVa of the hippocampus, an area involved in learning and memory. This cerebrovascular alteration may be related to the hypoxia and neural loss in the hippocampus of SHR, leading to vascular dementia.29
We also observed a similar baseline CBF in SHR and WKY animals, consistent with some human studies1, 11, 12, 13, 14 but not others in which hypertensive subjects demonstrated a slight reduction in CBF.8, 9, 10 At the same time, in other studies using the SHR and WKY models, hypertensive animals had a much higher baseline CBF value than control animals under 2% isoflurane (104±23 versus 71±19 mL/100 g per minute30 and 150±20 versus120±20 mL/100 g per minute.31) However, the fact that we used ∼1% isoflurane while the other studies used 2% may account for this difference in results.30 The 2% isoflurane level, typical for surgical procedures, could impair cerebrovascular regulation during a long experiment. Indeed, Leoni et al30 and colleagues observed a decrease in MABP during hypercapnia in animals anesthetized with 2% isoflurane, unlike our study. As CBF is maintained within a certain autoregulatory range independent of changes in systemic arterial pressure through the adjustment of artery and arteriole diameters,3, 32 CBF may not be a sensitive marker of early hypertension.
As the evoked EtCO2 change was slightly higher for WKY than for SHR, the reactivity of WKY would be higher than that of SHR, if the magnitude of EtCO2 change is directly related to vascular reactivity. Contrary to the expectation from EtCO2 change, we found that hypercapnia induced greater CBF and BOLD responses in hypertensive animals, while both hypertensive and control rats showed a similar increase in ΔCBVa (Figure 5). The CBF change is expected to be associated with the CBVa change. Even though hypercapnia-induced ΔCBVa is similar for the both animal models, baseline CBVa is lower for SHR than WKY. Consequently, the relative CBVa change is higher for SHR than WKY, leading to much higher CBF and BOLD responses for hypertensive rats. Higher vascular reactivity under the vasoconstricted hypertensive condition is similar to the increased reactivity under the vasoconstricted hypocapnic condition in normal subjects,33 indicating that the SHR model used in our studies did not impair vascular viability.
Our observations differ from human 15O water positron emission tomography studies in which hypertensive subjects demonstrated a blunted CBF response to neural tasks as compared with normotensive age-matched 60-year-old subjects.11 This reduction in CBF response may be the result of a decrease in neural activity and/or neurovascular reactivity, possibly confounded by age-related vasodilatory deterioration. Based on blood flow velocity measurements with transcranial Doppler sonography, Meada et al.15 noted that hypertensive subjects have decreased CO2 reactivity in the middle cerebral artery. In contrast, the reactivity measured with a 133Xe carotid angiogram is similar between hypertensive and normotensive subjects, either during CO2 inhalation or during hyperventilation.34 These large vessel measurements would be expected to differ from our measurements in small cortical arteries and arterioles given that these small vessels undergo hypertrophy in chronic hypertension.35 The disparity between human and animal studies may cause differences. Anesthesia is needed to minimize head motion and stress levels during animal experiments, but anesthetics affect the vasculature and possibly the blood pressure. However, the mild isoflurane anesthesia (∼1%) used in this study produced no significant blood pressure changes in either SHR or WKY strains over the duration of the experiment. One possible scenario for discrepancy is that arterial vessels have not yet undergone significant remodeling in our hypertensive animals; thus, vascular reactivity is not compromised. Taking our current and previously reported data together, we hypothesize that the hyperreactivity at an early hypertensive stage without significant arterial remodeling is followed by the hyporeactivity at a later hypertensive stage due to arterial vessel wall thickening and remodeling. Vascular reactivity may be used to determine whether vascular remodeling is significant. Further longitudinal studies are necessary for examining our hypothesis.
As histopathological findings and morphologic damage induced by cerebrovascular alterations in the hypertensive animal brain have been shown to be very similar to those observed in the human brain,29, 36, 37, 38, 39 similar cerebrovascular morphologic and functional changes are expected in hypertensive patients. The noninvasive MRI mapping technique would be helpful to understand cerebrovascular physiology of hypertension progression and to guide intervention optimized to combat both systemic and cerebrovascular hypertensive impairments.
The authors declare no conflict of interest.
Footnotes
Source of funding: NIH: EB003375.
References
- Baumbach GL, Heistad DD. Cerebral circulation in chronic arterial hypertension. Hypertension. 1988;12:89–95. doi: 10.1161/01.hyp.12.2.89. [DOI] [PubMed] [Google Scholar]
- Laurent S, Boutouyrie P, Lacolley P. Structural and genetic bases of arterial stiffness. Hypertension. 2005;45:1050–1055. doi: 10.1161/01.HYP.0000164580.39991.3d. [DOI] [PubMed] [Google Scholar]
- Iadecola C, Davisson RL. Hypertension and cerebrovascular dysfunction. Cell Metab. 2008;7:476–484. doi: 10.1016/j.cmet.2008.03.010. [DOI] [PMC free article] [PubMed] [Google Scholar]
- Jennings JR, Zanstra Y. Is the brain the essential in hypertension. Neuroimage. 2009;47:914–921. doi: 10.1016/j.neuroimage.2009.04.072. [DOI] [PMC free article] [PubMed] [Google Scholar]
- Novak V, Hajjar I. The relationship between blood pressure and cognitive function. Nat Rev Cardiol. 2010;7:686–698. doi: 10.1038/nrcardio.2010.161. [DOI] [PMC free article] [PubMed] [Google Scholar]
- Gautier JC. Vascular Disease of the Central Nervous System. Churchill Livingstone: Edinburgh, London; 1983. Cerebral Ischemia in Hypertension. [Google Scholar]
- Hazama F, Amano S, Haebara H, Yampri Y, Okamoto K. The Cerebral Vessel Wall. Raven: New York; 1976. Pathology and pathogenesis of cerebrovascular lesions in spontaneously hypertensive rats. [Google Scholar]
- Nobili F, Rodriguez G, Marenco S, De Carli F, Gambaro M, Castello C, et al. Regional cerebral blood flow in chronic hypertension. A correlative study. Stroke. 1993;24:1148–1153. doi: 10.1161/01.str.24.8.1148. [DOI] [PubMed] [Google Scholar]
- Efimova IY, Efimova NY, Triss SV, Lishmanov YB. Brain perfusion and cognitive function changes in hypertensive patients. Hypertens Res. 2008;31:673–678. doi: 10.1291/hypres.31.673. [DOI] [PubMed] [Google Scholar]
- Fujishima M, Ibayashi S, Fujii K, Mori S. Cerebral blood flow and brain function in hypertension. Hypertens Res. 1995;18:111–117. doi: 10.1291/hypres.18.111. [DOI] [PubMed] [Google Scholar]
- Jennings JR, Muldoon MF, Ryan C, Price JC, Greer P, Sutton-Tyrrell K, et al. Reduced cerebral blood flow response and compensation among patients with untreated hypertension. Neurology. 2005;64:1358–1365. doi: 10.1212/01.WNL.0000158283.28251.3C. [DOI] [PubMed] [Google Scholar]
- Kety SS, Hafkenschiel JH, Jeffers WA, Leopold IH, Shenkin HA. The blood flow, vascular resistance, and oxygen consumption of the brain in essential hypertension. J Clin Invest. 1948;27:511–514. doi: 10.1172/JCI101998. [DOI] [PMC free article] [PubMed] [Google Scholar]
- Lassen NA. Cerebral blood flow and oxygen consumption in man. Physiol Rev. 1959;39:183–238. doi: 10.1152/physrev.1959.39.2.183. [DOI] [PubMed] [Google Scholar]
- Yamori Y, Horie R. Developmental course of hypertension and regional cerebral blood flow in stroke-prone spontaneously hypertensive rats. Stroke. 1977;8:456–461. doi: 10.1161/01.str.8.4.456. [DOI] [PubMed] [Google Scholar]
- Maeda H, Matsumoto M, Handa N, Hougaku H, Ogawa S, Itoh T, et al. Reactivity of cerebral blood flow to carbon dioxide in hypertensive patients: evaluation by the transcranial Doppler method. J Hypertens. 1994;12:191–197. [PubMed] [Google Scholar]
- Kim T, Hendrich K, Kim SG. Functional MRI with magnetization transfer effects: determination of BOLD and arterial blood volume changes. Magn Reson Med. 2008;60:1518–1523. doi: 10.1002/mrm.21766. [DOI] [PMC free article] [PubMed] [Google Scholar]
- Kim T, Kim SG. Quantification of cerebral arterial blood volume and cerebral blood flow using MRI with modulation of tissue and vessel (MOTIVE) signals. Magn Reson Medi. 2005;54:333–342. doi: 10.1002/mrm.20550. [DOI] [PubMed] [Google Scholar]
- Kim T, Kim SG. Temporal dynamics and spatial specificity of arterial and venous blood volume changes during visual stimulation: implication for BOLD quantification. J Cereb Blood Flow Metab. 2011;31:1211–1222. doi: 10.1038/jcbfm.2010.226. [DOI] [PMC free article] [PubMed] [Google Scholar]
- Kim T, Hendrich KS, Masamoto K, Kim SG. Arterial versus total blood volume changes during neural activity-induced cerebral blood flow change: implication for BOLD fMRI. J Cereb Blood Flow Metab. 2007;27:1235–1247. doi: 10.1038/sj.jcbfm.9600429. [DOI] [PubMed] [Google Scholar]
- Paxinos G, Watson C.(eds). The Rat Brain in Stereotaxic Coordinates Academic Press Incorporated: New York; 2005 [Google Scholar]
- Herscovitch P, Raichle ME. What is the correct value for the brain--blood partition coefficient for water. J Cereb Blood Flow Metab. 1985;5:65–69. doi: 10.1038/jcbfm.1985.9. [DOI] [PubMed] [Google Scholar]
- Kim T, Kim SG. Quantification of cerebral arterial blood volume using arterial spin labeling with intravoxel incoherent motion-sensitive gradients. Magn Reson Med. 2006;55:1047–1057. doi: 10.1002/mrm.20867. [DOI] [PubMed] [Google Scholar]
- Kim T, Kim SG.Dynamics of Arterial Labeled Spins Investigated by using 2-coil DASL. Proc 10th Annual Meeting ISMRM: Hawaii, USA; 2002. p1061 [Google Scholar]
- Kim T, Kim SG. Cortical layer-dependent arterial blood volume changes: improved spatial specificity relative to BOLD fMRI. Neuroimage. 2010;49:1340–1349. doi: 10.1016/j.neuroimage.2009.09.061. [DOI] [PMC free article] [PubMed] [Google Scholar]
- Bendel P, Eilam R. Quantitation of ventricular size in normal and spontaneously hypertensive rats by magnetic resonance imaging. Brain Res. 1992;574:224–228. doi: 10.1016/0006-8993(92)90820-y. [DOI] [PubMed] [Google Scholar]
- Tajima A, Hans FJ, Livingstone D, Wei L, Finnegan W, DeMaro J, et al. Smaller local brain volumes and cerebral atrophy in spontaneously hypertensive rats. Hypertension. 1993;21:105–111. doi: 10.1161/01.hyp.21.1.105. [DOI] [PubMed] [Google Scholar]
- Ritter S, Dinh TT. Progressive postnatal dilation of brain ventricles in spontaneously hypertensive rats. Brain Res. 1986;370:327–332. doi: 10.1016/0006-8993(86)90488-9. [DOI] [PubMed] [Google Scholar]
- Sabbatini M, Strocchi P, Vitaioli L, Amenta F. Microanatomical changes of intracerebral arteries in spontaneously hypertensive rats: a model of cerebrovascular disease of the elderly. Mechan Ageing Dev. 2001;122:1257–1268. doi: 10.1016/s0047-6374(01)00234-2. [DOI] [PubMed] [Google Scholar]
- Sabbatini M, Catalani A, Consoli C, Marletta N, Tomassoni D, Avola R. The hippocampus in spontaneously hypertensive rats: an animal model of vascular dementia. Mech Ageing Dev. 2002;123:547–559. doi: 10.1016/s0047-6374(01)00362-1. [DOI] [PubMed] [Google Scholar]
- Leoni RF, Paiva FF, Henning EC, Nascimento GC, Tannus A, de Araujo DB, et al. Magnetic resonance imaging quantification of regional cerebral blood flow and cerebrovascular reactivity to carbon dioxide in normotensive and hypertensive rats. Neuroimage. 2011;58:75–81. doi: 10.1016/j.neuroimage.2011.06.030. [DOI] [PMC free article] [PubMed] [Google Scholar]
- Danker JF, Duong TQ. Quantitative regional cerebral blood flow MRI of animal model of attention-deficit/hyperactivity disorder. Brain Res. 2007;1150:217–224. doi: 10.1016/j.brainres.2007.02.082. [DOI] [PMC free article] [PubMed] [Google Scholar]
- Chillon J-M, Baumbach G.Autoregulation of cerebral blood flowIn: Welch K, Caplan L, Reis D, Siesjo B, Weir B, (eds). Primer on Cerebrovascular Diseases Acadmic Press: San Diego; 199751–54. [Google Scholar]
- Cohen ER, Ugurbil K, Kim SG. Effect of basal conditions on the magnitude and dynamics of the blood oxygenation level-dependent fMRI response. J Cereb Blood FlowMetab. 2002;22:1042–1053. doi: 10.1097/00004647-200209000-00002. [DOI] [PubMed] [Google Scholar]
- Tominaga S, Strandgaard S, Uemura K, Ito K, Kutsuzawa T. Cerebrovascular CO2 reactivity in normotensive and hypertensive man. Stroke. 1976;7:507–510. doi: 10.1161/01.str.7.5.507. [DOI] [PubMed] [Google Scholar]
- Harper SL, Bohlen HG. Microvascular adaptation in the cerebral cortex of adult spontaneously hypertensive rats. Hypertension. 1984;6:408–419. doi: 10.1161/01.hyp.6.3.408. [DOI] [PubMed] [Google Scholar]
- Saito H, Togashi H, Yoshioka M, Nakamura N, Minami M, Parvez H. Animal models of vascular dementia with emphasis on stroke-prone spontaneously hypertensive rats. Clin Exp Pharmacol Physiol Suppl. 1995;22:S257–S259. doi: 10.1111/j.1440-1681.1995.tb02906.x. [DOI] [PubMed] [Google Scholar]
- Kimura S, Saito H, Minami M, Togashi H, Nakamura N, Nemoto M, et al. Pathogenesis of vascular dementia in stroke-prone spontaneously hypertensive rats. Toxicology. 2000;153:167–178. doi: 10.1016/s0300-483x(00)00312-7. [DOI] [PubMed] [Google Scholar]
- Nabika T, Cui Z, Masuda J. The stroke-prone spontaneously hypertensive rat: how good is it as a model for cerebrovascular diseases. Cell Mol Neurobiol. 2004;24:639–646. doi: 10.1023/B:CEMN.0000036402.79129.2f. [DOI] [PMC free article] [PubMed] [Google Scholar]
- Amenta F, Di Tullio MA, Tomassoni D. Arterial hypertension and brain damage—evidence from animal models (review) Clin Exp Hypertens. 2003;25:359–380. doi: 10.1081/ceh-120023545. [DOI] [PubMed] [Google Scholar]


