

Significance
The utilization of small-scale pumps is presently hampered by their limited flow rates with respect to the input power or their rather complicated fabrication process. These issues arise as many conventional pumping effects rely on moving elements. Here, we demonstrate the concept of a liquid metal enabled pump with no mechanical parts by simply incorporating droplets of Galinstan. The liquid metal enabled pump creates high flow rates (>5,000 µL/min) at exceptionally low powers (<15 mW) by electrowetting/deelectrowetting the surface upon application of electric field. The presented pump is both efficient and simple; hence, it has the potential to advance the field of actuation in small-scale systems.
Abstract
Small-scale pumps will be the heartbeat of many future micro/nanoscale platforms. However, the integration of small-scale pumps is presently hampered by limited flow rate with respect to the input power, and their rather complicated fabrication processes. These issues arise as many conventional pumping effects require intricate moving elements. Here, we demonstrate a system that we call the liquid metal enabled pump, for driving a range of liquids without mechanical moving parts, upon the application of modest electric field. This pump incorporates a droplet of liquid metal, which induces liquid flow at high flow rates, yet with exceptionally low power consumption by electrowetting/deelectrowetting at the metal surface. We present theory explaining this pumping mechanism and show that the operation is fundamentally different from other existing pumps. The presented liquid metal enabled pump is both efficient and simple, and thus has the potential to fundamentally advance the field of microfluidics.
Engines are systems that convert different kinds of energy into mechanical motion, which are used in various microscale systems, including laboratory-on-a-chip microreactors (1–3), microelectromechanical (MEMS) actuators (4), and microscale heat exchangers (5, 6), to name just a few. Some of the most important members of the engine family are liquid pumps. In the small-scale regime, such pumps can be mainly classified into mechanical and nonmechanical. For mechanical pumps, the driving force is generated by moving parts that are energized using piezoelectric (7), electrostatic (8), thermopneumatic (9), pneumatic (10), electromagnetic (11) effects, or deformation through electrowetting (12). Mechanical pumping systems have several drawbacks, which largely stem from the fact that moving parts cause energy loses due to heat generated by friction and their rather complicated fabrication processes (13, 14). In addition, the existence of moving parts increases the potential for failure, which can become acute in complex systems and which could potentially include numerous pumps. Among the varieties of mechanical pumps, only piezoelectric units can produce high flow rates as large as 20,000 μL/min at relatively low input power (>50 mW) (13, 15). However, piezoelectric units generally require operating voltages larger than 100 V (13, 15). Alternatively, nonmechanical pumps with no moving parts generate a driving force using ions energized via electrohydrodynamic (16), electroosmotic (17), or electrochemical (18, 19) effects. However, ion pumps are generally only applicable for low-conductivity liquids, produce relatively low flow rates, and need very high voltages (in the order of kilovolts) to operate (13). Therefore, a pumping system with no moving parts, high flow rate, and low power consumption is ideal for many present-day and emerging applications in microfluidic systems. An ambitious vision is that such pumps can potentially be used for moving small objects on demand, assembling them to create new structures, or could be used for fluidic cooling of microelements.
Recently, research interest in liquid metals including eutectic alloys such as eutectic GaIn (75% gallium and 25% indium) (20, 21) and Galinstan (68.5% gallium, 21.5% indium, and 10% tin) (22) has gained momentum. In general, these liquid metals offer remarkable properties including high electrical conductivity (22), high density (22), high surface tension (22), extremely low vapor pressure (22), and low toxicity in comparison with their counterparts, such as mercury (22). These properties make them attractive for various applications such as in soft electronics (20, 21), stretchable or makeshift components (20, 23), MEMS devices (24), and nanotechnology-enabled applications (25, 26).
In this paper, Galinstan liquid metal is used as the core of a liquid metal enabled pump to convert electrical energy into mechanical energy. This pump is enabled by electrowetting/deelectrowetting at the surface of the liquid metal droplet, upon the application of a dynamic electric field. We develop and validate the theory behind the operation of the proposed liquid metal–enabled pump. A proof-of-concept system is fabricated to demonstrate the viability of approach and to explore the science behind its operation.
A closed-loop open-top channel with a cross-section of 2 × 3 mm and a total length of 65 mm is fabricated by milling polymethylmethacrylate (PMMA), as shown in Fig. 1A. The channel also accommodates a cylindrical chamber with a diameter of 3 mm to hold the Galinstan droplet. For the first series of experiments, we place a Galinstan droplet with nearly the same diameter as the chamber. The channel is filled with electrolyte and a voltage is applied between the two graphite electrodes separated by 40 mm to generate an electric field across the channel. Here, we mainly present results obtained using sodium hydroxide (NaOH) solutions, as they provide the best pumping performance. We also show that the system operates with other electrolytes, including neutral sodium chloride (NaCl) and Phosphate-buffered saline (PBS) solutions. However, the system does not operate with acidic electrolytes of pH less than 6.5, as we have previously demonstrated that Galinstan droplets in acidic solutions are weakly affected by electrowetting (26).
Fig. 1.

Working mechanism of the liquid metal enabled pump. (A) Schematic of the experimental setup, the overall PMMA channel length is 65 mm and the gap between the electrodes is 40 mm. (B) Schematic of the Galinstan droplet surface charge distribution when placed in the droplet chamber filled with NaOH solution. (C) Schematic of the Galinstan droplet surface charge distribution when an electric field is applied between the graphite electrodes. (D) Sequential snapshots for the pumping effect of a Galinstan droplet with 2.7-mm diameter in the PMMA channel filled with NaOH solution (0.3 mol/L), while a square wave signal (200-Hz, 5 Vp-p, 2.5-V DC offset and 50% duty cycle) is applied between the two graphite electrodes. A droplet of dye is used to demonstrate the pumping effect.
Galinstan is mainly composed of gallium (68.5%) (22), so a slow chemical reaction can occur between gallium (the more dominant metal) and the alkali solution, producing gallates, such as [Ga(OH)4]−. These anions make the Galinstan surface negatively charged and result in an accumulation of positively charged ions in a diffuse layer of electric double layer (EDL), as shown in Fig. 1B. The EDL can be modeled as a charged capacitor. Due to the high conductivity of the liquid metal, the potential must be approximately uniform throughout the droplet. Conversely, the electrolyte has a finite conductivity and thus, if a voltage is applied, a potential gradient will be generated along the channel. Therefore, the potential difference across the EDL, along the surface of the liquid metal droplet, is altered. This induces droplet surface-charge redistribution similar to that of shown in Fig. 1C. Surface tension between the liquid metal and the electrolyte depends on this potential difference, as described by Lippman’s equation: 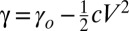 , where γ is the surface tension, c is the capacitance of EDL per unit area, V is the potential difference across the EDL, and γo is the maximum surface tension when V = 0 (4). In presence of no external potential, the EDL is initially charged by qo, and the voltage that appears due to the charge can be expressed as: Vo = qo/c (27).
The pressure difference between the electrolyte and the Galinstan liquid metal droplet p (pressure of Galinstan is higher) at each hemisphere can be obtained from Young–Laplace equation P = γ (2/r), where r is radius of the Galinstan droplet. When an external potential is applied, Fig. 1C shows that the charge, and thus the voltage drop across the EDL is less at the downstream (left) hemisphere. Therefore, a higher surface tension is generated at this hemisphere according to Lippman’s equation. The imbalance of the surface tension γ induces a pressure difference Δp between the downstream and upstream (right) hemispheres of the droplet. Based on the electrical equivalent circuit for the pump system given in SI Appendix, section 1, and assuming that the charges in the EDL are uniformly distributed in each hemisphere of the Galinstan droplet, the final expression for the pressure difference Δp is given as (detailed in SI Appendix, section 1):
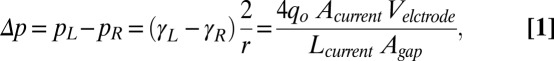 |
where pL and pR are the pressure difference between the Galinstan droplet and the surrounding liquid of the downstream and the upstream hemispheres, γL and γR are the surface tension of the downstream and the upstream hemispheres, Velectrode is the potential applied to the electrodes, Lcurrent and Acurrent are the total length and equivalent cross-sectional area of the electrical current path, and Agap is the equivalent cross-sectional area of the electrolyte between the Galinstan droplet and channel wall in the droplet seat chamber. According to Eq. 1, the pressure difference Δp is positive, indicating that the downstream hemisphere of the droplet pushes the surrounding liquid harder and produces a force to drive the droplet toward the upstream (26). However, unlike (26), in this case, when the motion of the droplet is ceased by the neck of the chamber, the pressure difference across the droplet causes the flow of the surrounding liquid along the channel and thus converts the applied electric potential directly into mechanical movement of the liquid (detailed explanation is given in SI Appendix, section 2).
Theoretically, the pressure difference exists continuously along the surface of the Galinstan droplet as long as the electric field is applied, and the principle for the resulting flow motion is called continuous electrowetting, which is an electrical analog to the Marangoni effect (4, 26, 27). This might also induce eddies within the liquid metal droplet itself. However, when an electric field is applied, gradually a thin layer of gallium oxide is electrochemically formed on the downstream hemisphere of the droplet, as evidenced by the Raman measurements given in SI Appendix, section 3. The formation of the solid oxide layer reduces the surface tension on this hemisphere (22), thus halting the pumping effect after a few seconds (SI Appendix, section 4). To achieve continuous pumping, an alternating voltage must be applied to avoid the formation of the oxide layer on the Galinstan surface. Fig. 1D shows the continuous pumping effect in response to a 200-Hz, 5 Vp-p square wave with 2.5-V DC offset (also shown in Movie S1). With the application of such a signal, charges can be alternately accumulated on and released from the droplet surface to produce a high flow rate of 1,800 µL/min. The Reynolds number based on the hydraulic diameter of the channel is ∼11 at this flow rate, indicating the laminar characteristics of the flow. High-speed images obtained for the Galinstan droplet during one voltage signal cycle (5 ms) show no obvious change of the droplet morphology (SI Appendix, section 5).
A series of control experiments are conducted to further explore the characteristics of the pump. First, in the absence of the Galinstan droplet, no pumping occurs, ruling out the electroosmosis as the driving mechanism of the pump (SI Appendix, section 6). Second, experiments with mercury droplets lead to a high flow rate similar to that observed for Galinstan droplets, confirming that the pumping of liquid is attributed to electrowetting effect (SI Appendix, section 6). Compared with the Galinstan droplet, the mercury droplet is able to operate under a DC voltage for tens of seconds. This could be explained as the electrochemical oxidation on the surface of mercury occurs much slower when a small DC voltage is applied. Third, we examine the consumption of the droplet by inductively coupled plasma mass spectrometry (ICP-MS) of the working solution. The test is performed under the same conditions described above after 100 pumping cycles (∼20 min). The results indicate that gallium and tin can be dissolved into the working electrolyte, with the concentration increasing from 0.15 to 71.34 μmol/L for gallium, and from 0.02 to 0.40 μmol/L for tin over the duration. Despite this, the pump should be able to work continuously for at least 40 d before the Galinstan droplet loses its eutectic ability (Ga < 59.6%) (28) (SI Appendix, section 7). We also conduct experiment with a closed-top channel to continuously pump the solution for 12 h and observe no obvious change of pumping performance.
A series of computational fluid dynamics (CFD) simulations together with high-speed camera imaging assessments are conducted to provide more insight into the observed pumping effect, as detailed in SI Appendix, section 8. To induce the pumping effect presented in Fig. 1D, we apply a constant shear stress τ across the surface of droplet, which can be calculated as τ = Δp/4 as explained in SI Appendix, section 8. A shear stress of zero is applied along the top free surface of the channel and a no-slip condition is applied across the other surfaces. The CFD simulations predict a maximum flow velocity along the downstream hemisphere of the droplet (Fig. 2A), which in turn induces a large vortex along the top hemisphere and two small vortices along the bottom hemisphere of the droplet (Fig. 2B). The incoming fluid follows the pattern of the vortices, moving downward to pass through the interface of the bottom and top vortices, as detailed in SI Appendix, section 8. Simulations also predict the formation of low-/high-pressure regions across the upstream/downstream hemispheres of the droplet (Fig. 2C). It is interesting to note that the narrow gap between the droplet and the pump seat leads to the formation of two pressure minima (shown in blue) across the upstream hemisphere of the droplet. The pressure difference between the downstream and upstream hemispheres of the droplet is sufficient to pump the liquid along the closed loop. To experimentally verify these simulations, polystyrene particles (diameter of 10 μm) are added into the liquid flow, and high-speed imaging is used to track their trajectories, as shown in Fig. 2D. It is interesting that the particle displacement along the surface of the liquid metal droplet follows the predicted pattern of vortices (Movie S2).
Fig. 2.

CFD simulation of the liquid metal enabled pump. (A) Flow velocity vectors (millimeters per second) along the droplet surface. (B) Formation of vortices along the droplet surface colored by velocity magnitude of the flow (millimeters per second). (C) Pressure contours along the surface of droplet (pascals) indicating the formation of low-/high-pressure regions at the upstream/downstream hemispheres of the droplet. (D) Trajectory of suspended particles along the top surface of droplet observed from the top by high speed camera.
Decreasing the distance between the electrodes provides a current path with smaller electrical resistance. This reduces resistance results in an increased current in response to the same applied voltage and consequently increases the power driving the electrowetting/deelectrowetting of the liquid metal droplet. As a result, larger flow rates are obtained. A comprehensive set of experiments are conducted to characterize the pump with different electrode gaps. Fig. 3A shows the comparison of the pumping performance for these three channels 4 s after adding a droplet of dye. By decreasing the distance between the electrodes from 40 to 20 mm (details given in SI Appendix, section 9) and eventually to 10 mm (SI Appendix, section 9), the flow rates are doubled (details given in Movie S3) and tripled (Movie S4), reaching to ∼3,600 and 5,400 μL/min, respectively. The results obtained are in line with Eq. 1, which predicts that decreasing the length of the electrical current path (Lcurrent) leads to higher pressure difference (Δp), and thus higher flow rates.
Fig. 3.

Enhancing the pumping flow rate by reducing the distance between the electrodes and characterization of their pumping performance with respect to different parameters. (A) Snapshots of the pumping effect of a Galinstan droplet with 2.7-mm diameter in three PMMA channels, with different electrode spacing, filled with NaOH solution (0.3 mol/L) 4 s after adding a droplet of dye, while a square wave signal (200-Hz, 5 Vp-p, 2.5-V DC offset and 50% duty cycle) is applied between the two graphite electrodes. The schematics of the channels are given in the Insets. (B) Current waveforms, obtained by measuring the voltage across a 1-Ω resistor in series, for the three channels with different electrode gaps under the same square wave signal (using these the powers are obtained by averaging the energy consumed in each cycle). (C) Flow rate vs. square wave frequency plots, obtained with a 2.7-mm diameter Galinstan droplet in a 0.3 mol/L NaOH solution. (D) Flow rate vs. square wave Vp-p plots, obtained with a 2.7-mm diameter Galinstan droplet in a 0.3 mol/L NaOH solution. (E) Flow rate vs. Galinstan droplet diameter plots, obtained within a 0.3 mol/L NaOH solution. Inset shows the optimum working frequency for Galinstan droplet with different sizes. (F) Flow rate vs. liquid NaOH concentration plots, obtained with a 2.7-mm diameter Galinstan droplet. A Vp-p/2 DC offset is always applied to the voltage signals, and the duty cycle of the square wave is 50%.
For simplicity, we name the channels with electrode gaps of 40, 20, and 10 mm as channels 1, 2, and 3, respectively (Fig. 3A, Insets). Fig. 3B shows the current waveform of these three channels when a 200-Hz, 5 Vp-p, and 2.5-V DC offset square wave is applied. AC currents are obtained, which is consistent with the expected current waveform for the equivalent circuit given in SI Appendix, section 10. The power consumption is 6.3, 9.3, and 13 mW for channels 1, 2, and 3, respectively. Comparing channels 1 and 3, by reducing the distance between the electrodes from 40 to 10 mm, the flow rate is tripled, and the power consumption is only doubled, thus yielding higher pumping efficiency. An experiment is also conducted with a closed-top channel and no change of pumping performance is observed (SI Appendix, section 11). Further, we fabricate a new channel (channel 4; SI Appendix, section 12) by increasing the length of the channel by 4 times, and maintaining the electrode gap at 10 mm. Applying the same signal leads to a flow rate of 5,400 µL/min, confirming that power losses mainly occur between the electrodes, as shown in Movie S5.
To understand the operation of the pump under different conditions, we investigate its performance as a function of the frequency, magnitude, and waveform of the applied voltage signals, the Galinstan droplet size, as well as solution ion concentrations. Fig. 3C shows the variations of flow rate with respect to different frequencies in three different channels. Our observations show that the highest flow rate is achieved when the frequency of the square wave is set to 200 Hz for all three channels. This phenomenon can be explained as follows: at low frequencies, the downstream hemisphere of the droplet is gradually oxidized and the pressure difference Δp reduces; conversely, at high frequencies, the ions cannot be fully redistributed within the EDL before deelectrowetting occurs to generate the maximum pressure difference. It seems that at 200 Hz, surface oxidation is suppressed and the ions in the EDL have enough time to redistribute. Using the performance curves shown in Fig. 3C, we can include a scale factor in Eq. 1 to represent the influence of applied signal frequency. In this case, the actual pressure difference produced by the pump can be obtained as: ΔP = Δpmax · k(frequency), where Δpmax is calculated by Eq. 1 and k(frequency) is obtained from Fig. 3C.
At a constant frequency, as described in Eq. 1, increasing the magnitude of the voltage signal (Velectrode) tends to enhance the pressure difference (Δp), as shown in Fig. 3D. However, undesired electrolysis of the solution is also observed with increased potential. The application of voltage signals with different waveforms and duty cycles are also investigated, as discussed in SI Appendix, section 13. Square waves with a 70% duty cycle produce the highest flow rate. The flexibility of the pump is also demonstrated, via immediate stopping and starting of the flow, by turning the voltage supply on and off, as shown in Movie S6. This experiment shows that the pumping effect can be initiated and suspended on a timescale of milliseconds, and on demand. In addition, the flow direction can also be instantly reversed by changing the voltage polarity, as shown in Movie S7.
The pumping performance can also be tuned by changing the diameter of Galinstan droplets, as shown in Fig. 3E. A larger droplet provides a higher flow rate. Again, this phenomenon is in line with Eq. 1, which predicts that a larger droplet leads to smaller Agap, thus generating higher pressure difference. In addition, our observations indicate that the optimum operating frequency decreases linearly with respect to the droplet size as shown in Fig. 3E, Inset (SI Appendix, section 14). This could be explained by the fact that it would take less time for the EDL ions to redistribute on smaller droplets.
The pumping performance is further investigated by changing the ion concentration of the solution (csolution), as shown in Fig. 3F. For NaOH solution, increasing the ion concentration leads to higher flow rates until reaching csolution = 0.4 mol/L, beyond which the flow rate is saturated. This might be due to an increase of the EDL initial charge qo with respect to ion concentration (29), which in turn increases the pressure difference, as predicted in Eq. 1. However, qo might become saturated when csolution > 0.4 mol/L.
To obtain the pump curve, we change the pressure drop along the channel by fabricating a customized gate valve. Turning the screw leads to the changing of cross-sectional area of the channel at the location of the screw seat, which in turn changes the pressure drop (SI Appendix, section 15). The performance of the system for pumping of liquids of various viscosities is also investigated by adding glycerol to the DI water. The results show that our pump is able to pump a liquid, which is up to ∼230 times more viscous than deionized (DI) water (SI Appendix, section 16, and Movie S8). The capability of the pump is also tested with other solutions including NaCl and PBS. A set of experiments are conducted to investigate the pumping performance as a function of frequency and magnitude of the applied signal, confirming that the pump is capable of pumping these solutions with high flow rates (SI Appendix, section 17). We also examine the performance of the pump by applying a microfluidic channel with dimensions of 600 × 240 μm. We show that high flow rates of 70 μL/min are achievable, corresponding to an average flow velocity of 8 mm/s, which is comparable to that of the large-scale open-top channel (15 mm/s) in response to similar operating conditions (SI Appendix, section 18).
We have demonstrated the fundamentals of the operation and some of the capabilities of our liquid metal enabled pump for pumping liquid. The pump offers unique advantages including simple fabrication process with no conventional moving parts achieving high flow rates with low power consumption. This pump is thus highly accessible, low-cost, and has a low operating voltage. It is also highly controllable and acts in both directions. This simple pump has the potential to enable highly complex, yet practical, applications in the areas of MEMS actuation, microfluidics and microcoolers, and eventually realize a number of the envisioned dynamically reconfigurable macrosystems.
Methods
Experiment Setup.
A liquid metal (Galinstan) droplet is placed in the droplet seat of an open-top PMMA channel with a depth of 3 mm, and a total length of 65 mm, which is filled with electrolyte solutions. The electric field is imposed by a signal generator (Tabor, 2572A 100-MHz Dual-Channel) between two inert graphite rods (5 mm diameter; Johnson Matthey Ultra “F” purity grade) as electrodes, which are inserted into two cylindrical slots. Experiments are repeated 3 times and the data presented as mean ±SE. For experiments conducted within microfluidics, polydimethylsiloxane (PDMS) microchannels are fabricated using standard photolithography techniques (30). The total length of the channel is 65 mm.
Materials Characterization.
Raman measurements are performed using an In-Via Raman microscope (Renishaw Plc.), a 532-nm laser is used as the excitation source. A 5× objective lens is used to focus the excitation laser beam and to collect Raman spectra in backreflection. The concentrations of dissolved gallium, indium, and tin are measured using an ICP-MS (Agilent Technologies HP4500 series 300, Shield Torch ICP-MS). The working solutions are diluted 10 times with 2% nitric acid before conducting the measurements.
CFD Simulations.
The CFD simulations are conducted using the ANSYS Fluent 6.3 software package. The simulations are conducted in 3D and steady state. The fluid is assumed to be Newtonian and the flow is considered laminar due to its low Reynolds number.
High-Speed Camera Imaging.
High speed images of the particle trajectories around the liquid metal droplet are captured using a high-speed camera (PHANTOM MIRO M-310, Vision Research, Inc.) fitted with a MACRO-NIKKOR 65-mm lens, PB-6 bellows and PK-11 extension tube. Two tungsten light heads (Dedocool Lights) are used for illumination.
Supplementary Material
Acknowledgments
The authors also thank Mr. Paul Morrison for conducting the ICP-MS measurements. K.K. acknowledges the Australian Research Council for funding under Discovery Early Career Researcher Award scheme (Project DE120101402).
Footnotes
The authors declare no conflict of interest.
This article is a PNAS Direct Submission.
This article contains supporting information online at www.pnas.org/lookup/suppl/doi:10.1073/pnas.1319878111/-/DCSupplemental.
References
- 1.Atencia J, Beebe DJ. Controlled microfluidic interfaces. Nature. 2005;437(7059):648–655. doi: 10.1038/nature04163. [DOI] [PubMed] [Google Scholar]
- 2.Wu T, et al. A photon-driven micromotor can direct nerve fibre growth. Nat Photonics. 2012;6(1):62–67. [Google Scholar]
- 3.García M, et al. Micromotor-based lab-on-chip immunoassays. Nanoscale. 2013;5(4):1325–1331. doi: 10.1039/c2nr32400h. [DOI] [PubMed] [Google Scholar]
- 4.Lee J, Kim CJ. Surface-tension-driven microactuation based on continuous electrowetting. J Microelectromech Syst. 2000;9(2):171–180. [Google Scholar]
- 5.Wang C-C, Yao Y-D, Liang K-Y, Huang C-C, Chang Y-C. Development of a miniature fan motor. J Appl Phys. 2012;111(7):07E718. [Google Scholar]
- 6.Darabi J, Ohadi MM, DeVoe D. An electrohydrodynamic polarization micropump for electronic cooling. J Microelectromech Syst. 2001;10(1):98–106. [Google Scholar]
- 7.Graf NJ, Bowser MT. A soft-polymer piezoelectric bimorph cantilever-actuated peristaltic micropump. Lab Chip. 2008;8(10):1664–1670. doi: 10.1039/b805252b. [DOI] [PMC free article] [PubMed] [Google Scholar]
- 8.Lee KS, Kim B, Shannon MA. An electrostatically driven valve-less peristaltic micropump with a stepwise chamber. Sens Actuators A Phys. 2012;187:183–189. [Google Scholar]
- 9.Song WH, Lichtenberg J. Thermo-pneumatic, single-stroke micropump. J Micromech Microeng. 2005;15(8):1425–1432. [Google Scholar]
- 10.Zeng Y, Shin MM, Wang TY. Programmable active droplet generation enabled by integrated pneumatic micropumps. Lab Chip. 2013;13(2):267–273. doi: 10.1039/c2lc40906b. [DOI] [PubMed] [Google Scholar]
- 11.Yamahata C, Lotto C, Al-Assaf E, Gijs MAM. A PMMA valveless micropump using electromagnetic actuation. Microfluid Nanofluid. 2005;1(3):197–207. [Google Scholar]
- 12.Yun KS, Cho IJ, Bu JU, Kim CJ, Yoon E. A surface-tension driven micropump for low-voltage and low-power operations. J Microelectromech Syst. 2002;11(5):454–461. [Google Scholar]
- 13.Laser DJ, Santiago JG. A review of micropumps. J Micromech Microeng. 2004;14(6):R35–R64. [Google Scholar]
- 14.Zhang C, Xing D, Li Y. Micropumps, microvalves, and micromixers within PCR microfluidic chips: Advances and trends. Biotechnol Adv. 2007;25(5):483–514. doi: 10.1016/j.biotechadv.2007.05.003. [DOI] [PubMed] [Google Scholar]
- 15.Amirouche F, Zhou Y, Johnson T. Current micropump technologies and their biomedical applications. Microsyst Technol. 2009;15(5):647–666. [Google Scholar]
- 16.Seyed-Yagoobi J. Electrohydrodynamic pumping of dielectric liquids. J Electrost. 2005;63(6-10):861–869. [Google Scholar]
- 17.Miao JY, et al. Micropumps based on the enhanced electroosmotic effect of aluminum oxide membranes. Adv Mater. 2007;19(23):4234–4237. [Google Scholar]
- 18.Choi YH, Son SU, Lee SS. A micropump operating with chemically produced oxygen gas. Sens Actuators A Phys. 2004;111(1):8–13. [Google Scholar]
- 19.Cameron CG, Freund MS. Electrolytic actuators: Alternative, high-performance, material-based devices. Proc Natl Acad Sci USA. 2002;99(12):7827–7831. doi: 10.1073/pnas.122212299. [DOI] [PMC free article] [PubMed] [Google Scholar]
- 20.Koo H-J, So J-H, Dickey MD, Velev OD. Towards all-soft matter circuits: Prototypes of quasi-liquid devices with memristor characteristics. Adv Mater. 2011;23(31):3559–3564. doi: 10.1002/adma.201101257. [DOI] [PubMed] [Google Scholar]
- 21.So JH, Koo HJ, Dickey MD, Velev OD. Ionic current rectification in soft-matter diodes with liquid-metal electrodes. Adv Funct Mater. 2012;22(3):625–631. [Google Scholar]
- 22.Liu T, Sen P, Kim C-J. Characterization of nontoxic liquid-metal alloy Galinstan for applications in microdevices. J Microelectromech Syst. 2012;21(2):443–450. [Google Scholar]
- 23.Cheng S, Wu Z. A microfluidic, reversibly stretchable, large-area wireless strain sensor. Adv Funct Mater. 2011;21(12):2282–2290. [Google Scholar]
- 24.Krupenkin T, Taylor JA. Reverse electrowetting as a new approach to high-power energy harvesting. Nat Commun. 2011;2:448. doi: 10.1038/ncomms1454. [DOI] [PMC free article] [PubMed] [Google Scholar]
- 25.Sivan V, et al. Liquid metal marbles. Adv Funct Mater. 2013;23(2):144–152. [Google Scholar]
- 26.Tang S-Y, et al. Electrochemically induced actuation of liquid metal marbles. Nanoscale. 2013;5(13):5949–5957. doi: 10.1039/c3nr00185g. [DOI] [PubMed] [Google Scholar]
- 27.Beni G, Hackwood S, Jackel JL. Continuous electrowetting effect. Appl Phys Lett. 1982;40(10):912–914. [Google Scholar]
- 28.van Ingen GN, Kapteijn J, Meijering JL. On the system gallium-indium-tin. Scr Metall. 1970;4:733–736. [Google Scholar]
- 29.Grahame DC. The electrical double layer and the theory of electrocapillarity. Chem Rev. 1947;41(3):441–501. doi: 10.1021/cr60130a002. [DOI] [PubMed] [Google Scholar]
- 30.Kalantar-zadeh K, Fry B. Nanotechnology Enabled Sensors. New York: Springer; 2007. [Google Scholar]
Associated Data
This section collects any data citations, data availability statements, or supplementary materials included in this article.