

Abstract
We identify an Arabidopsis pyridoxal-phosphate (PLP)-dependent aminotransferase, VAS1, whose loss-of-function simultaneously increases levels of the phytohormone auxin and the ethylene precursor 1-aminocyclopropane-1-carboxylate (ACC). VAS1 uses the ethylene biosynthetic intermediate Met as an amino donor and the auxin biosynthetic intermediate, indole-3-pyruvic acid (3-IPA) as an amino acceptor to produce L-Trp and 2-oxo-4-methylthiobutyric acid (KMBA). Our data indicate that VAS1 serves key roles in coordinating the levels of these two vital hormones.
In plants, hormones derived from amino acid metabolic pathways, such as auxin (L-Trp) and ethylene (L-Met), alter development and growth rates optimized for varying environmental conditions1,2. One such growth response is the rapid extension of stems and petioles of sun-loving plants when competing with nearby plants for access to light—a phenomenon termed the shade avoidance syndrome (SAS)3. Shade avoidance is an adaptive trait; however, left unchecked, SAS leads to losses of crop yield and biomass3.
Plants sense shade as a change in light quality using red and far-red absorbing photoreceptors, called phytochromes. A high red to far-red (R:FR>1) ratio of light means that the plant has an abundance of photosynthetically active light, while a R:FR <1 (shade) signals competition with neighboring plants3,4. TAA1/SAV3 is the first enzyme of the major IAA biosynthetic route from L-Trp identified using a screen for Arabidopsis shade-avoidance mutants5. TAA1/SAV3, also known as WEI86 or TIR27, is the most active of a family of 5 tryptophan aminotransferases (TAA1 and TAA1-related 1–4, known as TARs) that convert L-Trp to a redox sensitive metabolite, 3-IPA. 3-IPA converts to IAA via members of a family of 11 flavin monooxygenases, called YUCs8–10. This two-step pathway appears to be the major source of auxin in plants10,11.
To understand auxin homeostasis, we isolated sav3 suppressors—second-site mutations that allowed sav3 mutants to elongate their hypocotyls in response to shade (Supplementary Results). We then unraveled the biochemical and biological roles encoded by VAS1 (for reversal of sav3 phenotype), identified by 8 recessive alleles (vas1-1 to vas1-8).
In response to shade, vas1-1 sav3-1 or vas1-2 sav3-1 double mutant plants had longer hypocotyls and petioles than sav3-1 single mutants (Fig. 1a, 1b and Supplementary Fig. 1a). When grown in continuous white light (Wc; R/FR>1), vas1-1 or vas1-1 sav3-1 mutant seedlings displayed elongated hypocotyls and petioles, with increased leaf hyponasty, decreased leaf area (Fig. 1a, 1b and Supplementary Fig. 1a–1c), and accelerated leaf senescence (Supplementary Fig. 1d); the mutants also flowered early (Supplementary Fig. 1e), indicating that loss of VAS1 function led to a mild constitutive SAS.
Figure 1. VAS1 functions in auxin metabolism, downstream of TAA1/SAV3 but upstream of YUCs.

(a) vas1 rescued the sav3 hypocotyl elongation defect in response to shade (n=15). The plants were grown on ½ MS plates, and kept under white light (Wc) for 5 d and then remained in Wc for 4 d or transferred to shade for 4 d. (b) vas1 had longer petioles than WT plants under both Wc and shade conditions (n=30). The petiole length of the first set of true leaves shown. (c) vas1 accumulated higher levels of IAA in both Wc and shade (n=3). (d) vas1 accumulated higher levels of 3-IPA in both Wc and shade (n=3). Results are shown as means ± s.e.m., *P < 0.05, **P < 0.01, and ***P < 0.001 (two-tailed Student’s t-test). The comparison is made between WT Col plants and mutants under the same growth conditions and same treatment.
We quantified the levels of IAA and 3-IPA in WT, vas1 single mutants and vas1 sav3 double mutants. Compared to WT, both vas1-2 sav3-1 and vas1-2 accumulated more IAA and 3-IPA (Fig. 1c, d). IAA and 3-IPA were higher in other vas1 alleles as well (Supplementary Fig. 2a), indicative of the rescue of the auxin biosynthetic defect of sav3 through restoration of 3-IPA pools.
When grown in continuous white light (Wc), sav3 mutants have no observable phenotype, while sav3 tar2 double mutants accumulate low levels of auxin, are semi-dwarf, and do not set seeds5,6. vas1 fully rescued the fertility defect of sav3-1 tar2-2 double mutants (Supplementary Fig. 2b). Hypocotyls of vas1-1 sav3-1 tar2-2 triple mutants elongated like those of vas1-1 single mutants (Supplementary Fig. 2c). In sharp contrast, vas1 failed to restore the fertility defect (Supplementary Fig. 2d) and short hypocotyls of yuc1-163 yuc4 under shade (Supplementary Fig. 2e)9. Together with the 3-IPA and IAA measurements, these genetic data suggested that VAS1 functions downstream of TAA1/SAV3, but upstream of YUCs, to negatively modulate IAA biosynthesis directly by altering the 3-IPA pool.
By map-based cloning and genetic complementation of two independent vas1 alleles (Supplementary Fig. 3), we identified VAS1 as At1g80360, annotated as a PLP-dependent aspartate aminotransferase12 (Fig. 2a). A VAS1-GFP translational fusion protein localized to the cytoplasm (Supplementary Fig. 4a), as shown for TAA1/SAV3-GFP fusions5. The expression patterns of a VAS1-GUS chimeric protein driven by the VAS1 promoter overlapped with the expression of the DR5::GUS reporter (an artificial auxin responsive reporter)13 (Supplementary Fig. 4b–4d). VAS1 overexpression (35S::VAS1-YFP) reduced plant stature and seed set (Supplementary Fig. 5a–5c), and these plants accumulated less auxin than WT under shade (Supplementary Fig. 5d). These growth and metabolic differences suggest that VAS1 overexpression attenuated auxin biosynthesis.
Figure 2. VAS1 encodes a Met-specific aminotransferase and model for VAS1 metabolic regulation of auxin and ethylene biosynthesis.

(a) Diagram of VAS1 genomic DNA sequence with exons indicated by the black boxes. Mutations of each vas1 mutant allele are shown. (b) UV-based chromatograms for VAS1 in vitro reactions. L-Trp formed in the presence of 3-IPA, L-Met and PLP. Chromatographic profiles of L-Trp (1), the reaction mixture minus VAS1 (2), and the reaction mixture containing VAS1 (3) monitored at 254 nm. The two peaks for 3-IPA are the keto and enol tautomers of 3-IPA (verified by NMR spectroscopy). (c) Reaction diagram for a metabolic hub linking auxin and ethylene biosynthesis through VAS1. TAA1, tryptophan aminotransferase of Arabidopsis; SAV3, shade avoidance 3; TARs, tryptophan aminotransferase related 1–4; YUCs, YUCCA family of flavin-containing monooxygenases; L-Trp, L-tryptophan; 3-IPA, indole-3-pyruvic acid; IAA, indole-3-acetic acid. KMBA, 2-oxo-4-methylthiobutyric acid; L-Met, methionine; SAM, S-adenosyl-L-methionine; ACC, 1-aminocyclopropane-1-carboxylate; MTA, methylthioadenosine; MTR, methylthioribose; MTR-1-P, methylthioribose phosphate. ACS, ACC synthase.
We examined 9 metabolically available 3-ketoacid amino acceptors including 3-IPA to assess VAS1 biochemical activity using purified VAS1 from E. coli. VAS1 activities were measured using 19 of 20 natural amino acids as possible amino donors (the one exception L-Trp) using fixed amounts of 3-ketoacids, the PLP co-factor and VAS1 protein. VAS1 most efficiently converted 3-IPA to L-Trp (Fig. 2b and Supplementary Fig. 6a–6c). Unlike the well-characterized aspartate aminotransferases, only the hydrophobic amino acids, L-Met, L-Phe, L-Ile, L-Leu, L-Val and L-Tyr served as amino donors for the VAS1 catalyzed reaction (Supplementary Fig. 6a, 6c). The most catalytically preferred amino donor in the L-Trp forming in vitro reaction was L-Met. VAS1 specific activity with L-Phe was 21% that for L-Met and with L-Ile, L-Leu, L-Val or L-Tyr as amino donors, 1% that for L-Met (Supplementary Fig. 6a, c). VAS1 efficiently converted 3-IPA to L-Trp, in opposition to the 3-IPA forming reaction of TAA1/SAV3 (we were unable to detect the reverse VAS1 activity using an excess amount of L-Trp (50 mM), KMBA (10 mM) and PLP cofactor). These biochemical results support the epistasis studies that placed VAS1 downstream of TAA1/SAV3 and upstream of YUCs, to negatively modulate IAA biosynthesis.
The unexpected use of L-Met as the preferred amino donor in the VAS1 conversion of 3-IPA to L-Trp raised a second question pertaining to ethylene metabolism. Since L-Met is an essential precursor of ethylene, its use as the preferred substrate for VAS1 hinted at a metabolic link between auxin and ethylene biosynthesis (Fig. 2c). Moreover, L-Met and the product of L-Met de-amination, KMBA, are biosynthetic intermediates in the Yang cycle (Fig. 2c)14. The Yang cycle sustains high rates of ethylene production14–16. Therefore, we next measured ACC (the stable penultimate precursor of ethylene) in mutant plants and found that vas1-2 single and vas1-2 sav3 double mutant plants contained significantly higher amounts of ACC than either WT or sav3-1 (Fig. 3a). Increased ACC levels were also observed in vas1-1 sav3 and vas1-4 sav3 (Supplementary Fig. 7a). These measurements suggest that vas1 mutants harbored a larger pool of L-Met destined for ethylene biosynthesis. Consistent with previous results demonstrating that the Yang cycle maintains high rates of ethylene biosynthesis without influencing the steady state concentration of L-Met14–16, we did not observe a difference in the L-Met levels between vas1 mutants and WT (Supplementary Fig. 7b).
Figure 3. Increased ACC levels in vas1 mutants lead to exaggerated petiole elongation.
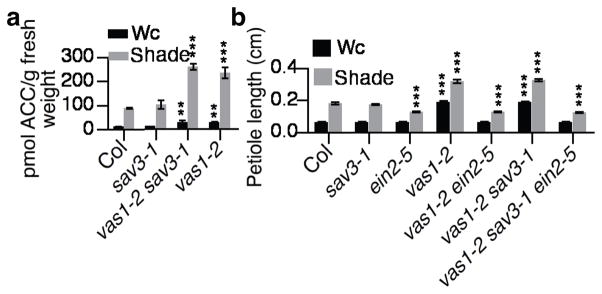
(a) vas1-2 sav3-1 and vas1-2 seedlings had increased ACC levels in both Wc and shade (n=3) compared to WT plants. (b) Ethylene signal transduction mutation ein2-5 fully suppressed the exaggerated petiole elongation of vas1-2 and vas1-2 sav3-1 (n=28).
External application of auxin upregulates the expression of ACC synthase (ACS) genes17. To rule out the possibility that high levels of ACC in vas1 resulted from enhanced transcription of ACS genes, we measured ACC concentrations of vas1-2 yuc1-163 yuc4 triple mutants. We found that ACC levels in a vas1-2 yuc1-163 yuc4 triple mutant were comparable to those of a vas1-2 single mutant (Supplementary Fig. 7c). The measurements indicated that ACC overproduction in the vas1 mutant was unlikely due to increased auxin and concomitant ACS gene transcription. Indeed, upon shade treatment, the mRNAs of five shade inducible ACS genes5, ACS 4, 5, 6, 8 and 11, rose to comparable levels in vas1-2 sav3-1 mutants and WT plants (Supplementary Fig. 8). Thus, multiple experimental observations support the hypothesis that overproduction of ACC in vas1 mutants originated in metabolism, rather than through enhanced transcription of ACS genes due to the overabundance of IAA in vas1 mutants.
A null mutation in the Arabidopsis EIN2 gene (ein2-5) renders plants insensitive to ACC or ethylene due to a defect in ethylene-induced signal transduction18. In either the vas1-2 sav3-1 double mutant or vas1-2 single mutant backgrounds, ein2-5 fully inhibited the exaggerated shade-induced elongation of petioles (Fig. 3b), but not of hypocotyls (Supplementary Fig. 9a). This suppression suggested that the excessive petiole elongation of vas1-2 sav3-1 double mutants or vas1-2 single mutants resulted from overproduction of ethylene. Moreover, petioles in the vas1-2 yuc1-163 yuc4 triple mutant and vas1-2 single mutant were comparable in length (Supplementary Fig. 9b), substantiating that increases in ethylene via ACC, and not auxin, accounted for the exaggerated petiole elongation of the vas1-2 mutant. This conclusion is concordant with ethylene’s required role during shade-induced elongation of petioles, but not hypocotyls19.
VAS1 and TAA1 catalyze opposing reactions with respect to 3-IPA formation, contributing to the fine-tuning of levels of a chemically reactive molecule, 3-IPA. Notably, 3-IPA is chemically unstable and a powerful hydroxyl radical scavenger20. In animals, 3-IPA undergoes a number of reactions during redox stress, generating a cache of bioactive indole-derived byproducts21. As such, VAS1 likely functions to modulate the concentration and lifetime of 3-IPA, mitigating formation of unintended byproducts in the absence of oxidative decarboxylation activity of YUCs.
The combination of genetics, biochemistry and targeted metabolomics described support a role for VAS1 as a metabolic rheostat that adjusts growth in response to environmental fluctuations (Supplementary Fig. 10). Concurrent reduction of the levels of auxin and ethylene by VAS1 should restrict elongation growth, thus providing an efficient metabolic mechanism to prevent plants from over-reacting to shade (Supplementary Fig. 10). Notably, VAS1 may play a more general role in plant growth and development because vas1 mutants also accumulated high levels of auxin and ACC under normal growth conditions, and vas1 mutations suppressed the fertility and growth defects of a sav3 tar2 double mutant. Given that 3-IPA-mediated auxin biosynthesis11, the Yang cycle14, and VAS1-like proteins (Supplementary Fig. 11) exist in other plants, VAS1 is likely to play a role in hormone metabolism throughout the plant kingdom.
Online methods
Procedures for screening sav3 suppressors
For screening sav3 suppressors, either sav3-1 or sav3-3 mutant seeds were mutagenized using 0.2% (v/v) EMS for approximately 16 hr with shaking. Mutagenized seeds were sown to obtain M2 seeds. The M2 seeds were surfaced sterilized with 95% ethanol for 30 minutes and plated on 1/2MS (Caisson Laboratories, North Logan, UT) plates without sucrose. Plates were kept in the dark at 4°C for 3 days, then moved to a white light (Wc) growth chamber for 5 days followed by transfer to a simulated shade growth chamber for another 4 days. Growth conditions (white light: fluorescent light, 30–50 μE.m−2.s−1; simulated white light: LED light, Red (R): 15.74μE.m−2.s−1/ Blue (B): 1.62μE.m−2.s−1; simulated shade: simulated white light pus LED Far-red (FR) light: 23.37μE.m−2.s−1; and temperature (22°C)) were similar to those described previously5. Under these conditions, sav3 grew with shorter hypocotyls compared to wild-type plants (WT). Seedlings whose hypocotyl lengths were similar to or longer than those of WT were picked as putative sav3 suppressors. After verifying the phenotype in the next generation, 70 putative sav3 suppressors were chosen for further study. Putative sav3 suppressors were screened for responses to monochromatic red, far-red or blue light to cull mutant plants previously identified to be involved in PHYB-, PHYA- or CRY1-mediated responses, respectively. This secondary screen identified 8 putative hy1/2 mutants, 10 putative phyB mutants, 8 putative phyA mutants and 25 putative cry1 mutants. We sequenced the PHYA gene from 4 putative phyA mutants finding mutations in the PHYA gene in all cases. The 19 remaining putative sav3 suppressors were outcrossed to transposon insertion mutant sav3-4 (CSHL_ET14311) in the Landsberg erecta background and mapped. Rough mapping data suggested that the mutants defined at least 3 complementation groups, with 8 alleles of a single gene called vas1 (for reversal of sav3 phenotype) described further.
Plant growth conditions and measurement of hypocotyl length and petiole length
For measuring hypocotyl and petiole length, the plants were grown on 1/2MS plates, and kept under Wc for 5 days. Some of the plants then remained in Wc for another 4 days while the others were transferred to shade for 4 days. The petiole lengths of the first set of true leaves were measured. For hypocotyl and petiole length measurement, the seedlings were scanned using an HP Scanjet 8300 Professional Image Scanner and the images were analyzed using the ImageJ software (http://rsbweb.nih.gov/ij/). To probe root elongation in response to ACC, plants were grown on 1/2MS supplemented with 1% (w/v) sucrose. Unless specifically noted, experiments conducted on MS plates, were maintained at 22°C in a growth chamber under continuous white light.
Positional cloning
vas mutants in the A. thaliana accession Columbia (Col-0) background were crossed to the sav3-4 (CSHL_ET14311) mutant in the accession Landsberg erecta (Ler) background to generate the F2 mapping population. SSLP, CAPS and dCAPS markers22 allowed us to localize the vas1-1 mutation between the At1g80190 and At1g80510 loci. The genomic DNA sequences of the 35 candidate genes between these two boundaries were sequenced.
The nature of vas1-1 to vas1-8 alleles
The phenotype of vas1-1 sav3 is caused by a single G to A mutation at the junction of the third exon and third intron of the At1g80360 gene. This mutation presumably alters intron splicing, leading to premature termination of At1g80360, which is predicted to encode an 85 amino acid unstructured polypeptide. The G to A mutation in the vas1-2 mutant results in conversion of Gly179 to Asp. The vas1-2 mutation has no effect on its RNA levels (Supplementary Fig. 3e). Structural modeling suggests that the G179D mutation likely destabilizes the VAS1 protein through significant steric and electronic clashes with the VAS1 polypeptide backbone and residues buttressing the active site. The G to A change at the conjunction of the second intron and third exon in vas1-3 portends a C-terminal truncation of the VAS1 protein, which is also the case for vas1-6 containing a G to A change at the splicing junction of the fifth intron and sixth exon. The C to T mutations in vas1-4 and vas1-5 convert Pro66 to Leu and Leu77 to Phe in the third exon, respectively. In vas1-7, a G to A change causes mutation of Cys219 to Tyr in the seventh exon. Finally, vas1-8 possesses a G to A mutation in the last exon, converting Ala269 to Thr. The 8 vas1 alleles had quantitatively similar phenotypes with regards to plant morphology and responses to shade. In this study, we used both vas1-1 and vas1-2 alleles for phenotypic analyses, and quantified the IAA and ACC levels of vas1-1, vas1-2 and vas1-4 alleles.
Mutant genotyping
To genotype the vas1-1 mutant allele, the primers vas1-1-F (5 ′-GAGTTGAGACAGGCTCTCCT-3′) and vas1-1-R (5 ′-GGATACAAGAAAGGTTGCCAGA-3′) were used to amplify a 85 bp fragment from vas1-1 mutant plants, which cannot be cut with EcoNI; however, the fragment amplified from Col wild-type plants with the same primers is cut into 22 bp and 63 bp fragments. For vas1-2 mutant allele genotyping, the 388 bp fragment was amplified from Col wild-type plants or the vas1-2 mutant plants with primers vas1-2-F (5′-AGACACTCTCTATCCTGACGCTG-3′) and vas1-2-R (5′-GTCTCCCTCAACGCAACAATGT-3′); then digested with NlaIV. The fragment from Col wild-type plants is predictably cut into 25 bp, 157 bp and 206 bp fragments; while the fragment from the vas1-2 mutant is predictably cut into 25 bp and 363 bp fragments.
Constructs generation
To generate the 35S::VAS1-YFP construct, the VAS1 cDNA was amplified from the reverse transcription products of total RNA isolated from Col-0 plants with primers CTGgagctcATGGGTTCGTTTGGGATGC (SacI site in lowercase) and CCTgtcgacCTCCACCATTCCATGGTGAAG (SalI site in lowercase), digested with SacI/SalI and cloned into the same sites of a modified pPZP212 vector containing YFP.
To generate the Pvas1::VAS1-GUS and Pvas1::VAS1-GFP construct, the genomic DNA sequence without a stop codon along with the 4050 bp upstream of the ATG start codon was amplified with primers CACCGATTGAAACCCTTTGACACG and CTCCACCATTCCATGGTGAAGC, cloned into pENTR/D-TOPO vector (Invitrogen) then introduced into pGWB203 (GUS) and pGWB204 (GFP), respectively23.
To express VAS1 recombinant protein, the VAS1 cDNA was amplified with primers CATgaaattcATGGGTTCGTTTGGGATGC (EcoRI site in lowercase) and GTCctcgagTCACTCCACCATTCCATGG (XhoI site in lowercase), digested with EcoRI/XhoI and inserted into the same sites of the pHIS8-3 vector24 to construct pHIS8-3-VAS1.
GUS staining and imaging
For checking the expression patterns of Pvas1::VAS1-GUS reporter genes in shoots, the plants were grown vertically on ½ MS plates for 7 days. The DR5-GUS reporter line was included in all analyses. Plant material was placed in a GUS staining solution [1 M NaPO4 (pH 7.0), 0.5 M Na+-EDTA (pH 7.0), 50 mM K4Fe(CN)6, 50 mM K3Fe(CN)6, 20% (v/v) Triton X-100 and 20 mM X-Gluc], and maintained for 3 hr to overnight (depending on gene expression levels) at 37°C in the dark. The resultant tissues were cleared with a chloral hydrate solution for approximately 10 hr before visualization using a Leica light microscope.
ACC and Met measurement
For measurement of ACC and Met concentrations, the roots of 7 d old seedlings were removed and only the shoots were collected. ACC and Met were extracted and quantified as previously reported25. Briefly, approximately 150 mg fresh weight tissue samples were frozen and then ground to a fine powder in liquid nitrogen. 1 mL 80% (v/v) methanol was added and the mixture maintained at −20°C overnight. 100 pmol of deuterated ACC (1-amino-[2,2,3,3-2H4]ACC) (Sigma) was added to the mixture to serve as an internal standard. After centrifugation of the mixture (24,000 g, 15 m, 4°C), the soluble portion containing ACC and Met was concentrated and further enriched and purified by combined solid-phase extraction and cation-exchange. The purified extract was dried under vacuum was and then redissolved in 60 μl acetone. 4 μl triethylamine and 10 μl pentafluorobenzyl bromide were added followed by a 15 m incubation at 60°C. The chemically modified sample was further purified by ethyl acetate-water extraction, and the ethyl acetate layer concentrated by evaporation under a stream of dry N2 gas. 4 μl of the concentrate was analyzed by GC-MS according to Smets et al., 2003. This method can only measure free ACC, but not conjugated ACC (e.g., MACC and GACC), and the limit of detection for ACC is approximately 10 fmol according to Smets et al (2003).
Quantification of IAA and IPA
For quantification of IAA and IPA, the roots of 7 day old seedlings were removed and only the shoots were collected and purified in triplicates (20 mg FW/sample). Extraction and purification of IAA was done as previously reported26 with minor modifications. Simultaneously, extraction aliquots were chemically derivatized and purified according to the previously published method for IPA determination27. Frozen samples were homogenized, extracted, and purified with the addition of the following stable isotope labeled internal standards: [indole-13C6]-IAA (10 pmol)28 and [indole-2H4]-IPA (25 pmol) (Olchemim, Olomouc, Czech Republic). All samples were analyzed by LC-MRM-MS (liquid chromatography-multiple reaction monitoring-mass spectrometry). The eluates were evaporated to dryness and dissolved in 20 μl of a mobile phase prior to mass analysis using a 1290 Infinity LC system and a 6460 Triple Quad LC/MS system (Agilent Technologies, Santa Clara, USA). 10 μl of each sample was injected onto a reversed-phase column (Kinetex C18 100A, 50 × 2.1 mm, 1.7 μm; Phenomenex, Torrance, USA) and eluted with 10 min gradient (0–10 min, 10/90–50/50% A/B; flow rate, 0.2 ml min-1; column temperature, 30°C), where A was 0.1% (v/v) acetic acid in methanol and B was 0.1% (v/v) acetic acid in water. At the end of the gradient, the column was washed and equilibrated to initial conditions for 6 m. Quantification was obtained by monitoring the precursor ([M+H]+) and the appropriate product ions. The MRM transitions 182.2>136.1 and 176.2>130.1 were used for labeled and authentic IAA, respectively. After the derivatization step, the oxime forms of IPA and 2H4-IPA were detected using MRM transitions 219.2>130.1 and 223.2>133.1, respectively. MS/MS conditions were as follows: drying/sheath gas temperature, 250/400 °C; drying/sheath gas flow, 10/12 l min−1; nebulizer pressure, 60 psig; capillary voltage, 2250 V; fragmentor, 65–85 V; collision energy, 9–22 V. The limits of detection (signal to noise ratio 1:3) were close to 1 pg for IAA, and 10 pg for IPA. The linear range was established to be 0.01/0.1–100 ng per injection with a correlation coefficient of 0.9987–0.9998. Chromatograms were analyzed using the MassHunter software (Agilent Technologies), and the compounds were quantified by standard isotope dilution analysis29.
Protein purification
pHIS8-3-VAS1 was transformed in E. coli (BL21). The cells were grown in Terrific Broth at 37°C until the OD600nm reached approximately 1.0. 0.5 mM isopropyl-β-D-thiogalactoside (IPTG) was then added to induce recombinant protein expression under control of T7 RNA polymerase induced using a modified lac promoter. Cells were grown overnight at 18°C and harvested by centrifugation. Cell pellets were resuspended in lysis buffer [50 mM Tris-HCl (pH 8.0), 500 mM NaCl, 20 mM imidazole, 1% (v/v) Tween 20, 10% (v/v) glycerol and 20 mM 2-mercaptoethanol] and lysed by sonication. The soluble lysates were passed through a Ni2+-NTA agarose column and eluted with lysis buffer supplemented with 250 mM imidazole (pH 8.0). The N-terminal His8-tag was removed by treatment with thrombin during overnight dialysis in 50 mM Tris-HCl (pH 8.0), 500 mM NaCl, 20 mM 2-mercaptoethanol. VAS1 was further purified by size-exclusion chromatography using a Superdex 200 HR16/60 column, the resultant VAS1 containing fractions combined and then dialyzed overnight in 12.5 mM Tris-HCl (pH 8.0), 50 mM NaCl and 2 mM DTT, and concentrated to 1 mg mL−1.
VAS1 enzyme assays
Comparative specific activity assays were conducted in a 200 μL volume containing 50 mM L-Met or one of 19 other amino acids (with the exception of L-Trp), 10 mM IPA, 200 μM PLP and 10 μg of purified VAS1 recombinant protein in a reaction buffer consisting of 50 mM K2HPO4/KH2PO4 (pH 8.5). Reactions were maintained at 37°C for 1 h. Reactions was terminated by rapid removal of VAS1 using ultrafiltration through Amicon filters at 4°C (10 kD cutoff membrane). 10 μl Amicon filtered samples were analyzed by LC-MS using an Agilent 1100 series LC-MSD instrument equipped with an Agilent Zorbax Eclipse XDB-C18 (4.6 mm × 150 mm, 5 μm particle size) reversed-phase column. Chromatographic separations employed a flow rate of 0.5 mL min−1 and a linear gradient with initial and final mobile phases consisting of 95% water : 4.9% : acetonitrile : 0.1% formic acid (v/v/v), and 5% water : 94.9% acetonitrile : 0.1% formic acid (v/v/v), respectively. Relative specific activities were calculated after integration of the Trp peak (based on the absorbance at 254 nm) and the activity against Met was arbitrarily set to 100%.
Steady-state kinetic assays for VAS1 were performed in 1 mL reaction volumes containing 100 mM sodium phosphate buffer (pH 8.0) with 0.4 μM recombinant VAS1, 100 μM PLP and variable amounts of Met (0.5 to 10 mM) or Phe (1 to 10 mM) and IPA (25 to 300 μM). The reactions were incubated at 23°C and the OD321nm were measured at the indicated time points to monitor the loss of IPA with time. Absorbance values were corrected to changes in IPA concentration based on an IPA standard curve. At 321 nm, absorbance from Trp was negligible. KM, kcat and Vmax were calculated by non-linear regression analysis using Graphpad Prism 5 fits to the Michaelis-Menten equation.
Real time RT-PCR analysis
RNA was extracted using the SpectrumTM Plant Total RNA Kit (Sigma), and the cDNA was synthesized using the Maxima® First Strand cDNA Synthesis Kit for RT-qPCR (Fermentas). Real time PCR was performed on the CFX384TM Real-Time System (Bio-Rad) using the SYBR green method. The following PCR procedure was used: 95 °C for 1 min, 45 cycles of 95 °C for 10 s, and 60 °C for 1 min. Expression levels for all genes were normalized to the reference gene At2g399605. The genes specific primers are: ACS4 (5′- GTTTACGAAGTGAAGCTCAAC-3′ and 5′- GTCTCATCAATCATGTTCGCG-3′); ACS5 (5′-ACGAGTCCACGTCGTTTATAGCC-3′ and 5′-TAGATCGCTCCCACACGGAAAC-3′); ACS6 (5′-ACGGCGAGAATTCCTCTTATTTCG-3′ and 5′-ACGCATCAAATCTCCACAAAGCTG-3′); ACS8 (5′-GTCCAGTTTCGGTCTAATCTC-3′ and 5′-ATAGGTGTCTCATGTCAACCC-3′); ACS11 (5′-AGGCCTCCCCGGATTTCGTGTT-3′ and 5′-TCGCGGCTGACACCACTTTCTC-3′); VAS1 (5′-TGGTAACCCAAGTGGCACCT-3′ and 5′-GCAATCCTCTTAAGCAGCGGT-3′); and the reference gene At2g39960 (5′-CCATCGACAGTGCTGATCCA-3′ and 5′-CCATTGGGTGACACTTTTGGT-3′).
Phylogenetic analysis
The sequences of VAS1 and proteins with high sequence identity (at least 44% identity) to VAS1 in other plant species were extracted from NCBI; their NCBI accession numbers are: Arabidopsis thaliana (VAS1, NP_178152, At1g80360), Arabidopsis lyrata (XP_002887833), Ricinus communis (XP_002517536), Vitis vinifera (XP_002284955), Glycine max (ACU18134), Populus trichocarpa (XP_002299622), Oryza sativa (NP_001042188), Zea mays (ACG41808), Zea mays (ACG38450), Zea mays (NP_001131906), Zea mays (ACG41318), Zea mays (NP_001151567), Vitis vinifera (XP_002284514), Physcomitrella patens (XP_001753569), Medicago truncatula (ACJ84383), Glycine max (ACU20038) and Chlamydomonas reinhardtii (XP_001690253). The neighbor-joining tree was generated using Mega4 software30.
Supplementary Material
Acknowledgments
We thank W. Chen for technical assistance and ABRC for mutant seeds. These studies were supported by National Institutes of Health (NIH) grant 5R01GM52413 to J.C., the Internal Grant Agency of Palacký University (PrF_2012_016) and the Grant Agency of the Academy of Sciences of the Czech Republic (KAN200380801) to O. N., the Swedish Governmental Agency for Innovation Systems (VINNOVA) and the Swedish Research Council (VR) (K.L.), National Institutes of Health (NIH) grant R01GM68631 to Y.Z., the National Science Foundation under Award Nos. EEC-0813570 and MCB-0645794 to J.P.N., and the Howard Hughes Medical Institute (Z.Z., J.P.N., J.C.).
Footnotes
Author contributions Z.Z. and Y.G designed research, performed research, analyzed data and wrote the paper. O.N. and K. L. performed quantitative MS analyses and analyzed data. X.D. and Y.Z. provided yuc1-163 yuc4 seeds. J.P.N. and J.C. designed research, analyzed data and wrote the paper.
Competing financial interests
The authors declare no competing financial interests.
Supplementary information is available online at http://www.nature.com/naturechemicalbiology/. Reprints and permissions information is available online at http://www.nature.com/reprints/index.html.
References
- 1.Santner A, Estelle M. Nature. 2009;459:1071–1078. doi: 10.1038/nature08122. [DOI] [PubMed] [Google Scholar]
- 2.Jaillais Y, Chory J. Nat Struct Mol Biol. 2010;17:642–645. doi: 10.1038/nsmb0610-642. [DOI] [PMC free article] [PubMed] [Google Scholar]
- 3.Franklin KA. New Phytol. 2008;179:930–944. doi: 10.1111/j.1469-8137.2008.02507.x. [DOI] [PubMed] [Google Scholar]
- 4.Lin L, et al. Genes Dev. 2012;26:785–790. doi: 10.1101/gad.187849.112. [DOI] [PMC free article] [PubMed] [Google Scholar]
- 5.Tao Y, et al. Cell. 2008;133:164–176. doi: 10.1016/j.cell.2008.01.049. [DOI] [PMC free article] [PubMed] [Google Scholar]
- 6.Stepanova AN, et al. Cell. 2008;133:177–191. doi: 10.1016/j.cell.2008.01.047. [DOI] [PubMed] [Google Scholar]
- 7.Yamada M, Greenham K, Prigge MJ, Jensen PJ, Estelle M. Plant Physiol. 2009;151:168–179. doi: 10.1104/pp.109.138859. [DOI] [PMC free article] [PubMed] [Google Scholar]
- 8.Stepanova AN, et al. Plant Cell. 2011;23:3961–3973. doi: 10.1105/tpc.111.088047. [DOI] [PMC free article] [PubMed] [Google Scholar]
- 9.Won C, et al. Proc Natl Acad Sci USA. 2011;108(45):18518–18523. doi: 10.1073/pnas.1108436108. [DOI] [PMC free article] [PubMed] [Google Scholar]
- 10.Mashiguchi K, et al. Proc Natl Acad Sci U S A. 2011;108(45):18512–18517. doi: 10.1073/pnas.1108434108. [DOI] [PMC free article] [PubMed] [Google Scholar]
- 11.Zhao YD. Mol Plant. 2012;5:334–338. doi: 10.1093/mp/ssr104. [DOI] [PMC free article] [PubMed] [Google Scholar]
- 12.Liepman AH, Olsen LI. Critical Reviews in Plant Sciences. 2004;23:73–89. [Google Scholar]
- 13.Ulmasov T, Murfett J, Hagen G, Guilfoyle TJ. Plant Cell. 1997;9:1963–1971. doi: 10.1105/tpc.9.11.1963. [DOI] [PMC free article] [PubMed] [Google Scholar]
- 14.Albers E. Iubmb Life. 2009;61:1132–1142. doi: 10.1002/iub.278. [DOI] [PubMed] [Google Scholar]
- 15.Burstenbinder K, Rzewuski G, Wirtz M, Hell R, Sauter M. Plant J. 2007;49:238–249. doi: 10.1111/j.1365-313X.2006.02942.x. [DOI] [PubMed] [Google Scholar]
- 16.Baur AH, Yang SF. Phytochemistry. 1972;11:3207–3214. [Google Scholar]
- 17.Tsuchisaka A, Theologis A. Plant Physiol. 2004;136:2982–3000. doi: 10.1104/pp.104.049999. [DOI] [PMC free article] [PubMed] [Google Scholar]
- 18.Alonso JM, Hirayama T, Roman G, Nourizadeh S, Ecker JR. Science. 1999;284:2148–2152. doi: 10.1126/science.284.5423.2148. [DOI] [PubMed] [Google Scholar]
- 19.Pierik R, Djakovic-Petrovic T, Keuskamp DH, de Wit M, Voesenek LA. Plant Physiol. 2009;149:1701–1712. doi: 10.1104/pp.108.133496. [DOI] [PMC free article] [PubMed] [Google Scholar]
- 20.Poeggeler B, et al. Brain Res. 1999;815:382–388. doi: 10.1016/s0006-8993(98)01027-0. [DOI] [PubMed] [Google Scholar]
- 21.Chowdhury G, et al. Chem Res Toxicol. 2009;22:1905–1912. doi: 10.1021/tx9000418. [DOI] [PMC free article] [PubMed] [Google Scholar]
- 22.Lukowitz W, Gillmor CS, Scheible WR. Plant Physiol. 2000;123:795–805. doi: 10.1104/pp.123.3.795. [DOI] [PMC free article] [PubMed] [Google Scholar]
- 23.Nakagawa T, et al. J Biosci Bioeng. 2007;104:34–41. doi: 10.1263/jbb.104.34. [DOI] [PubMed] [Google Scholar]
- 24.Jez JM, Ferrer JL, Bowman ME, Dixon RA, Noel JP. Biochemistry. 2000;39:890–902. doi: 10.1021/bi991489f. [DOI] [PubMed] [Google Scholar]
- 25.Smets R, Claes V, Van Onckelen HA, Prinsen E. J Chromatogr A. 2003;993:79–87. doi: 10.1016/s0021-9673(02)01817-4. [DOI] [PubMed] [Google Scholar]
- 26.Edlund A, Eklof S, Sundberg B, Moritz T, Sandberg G. Plant Physiol. 1995;108:1043–1047. doi: 10.1104/pp.108.3.1043. [DOI] [PMC free article] [PubMed] [Google Scholar]
- 27.Tam YY, Normanly J. J Chromatogr A. 1998;800:101–108. doi: 10.1016/s0021-9673(97)01051-0. [DOI] [PubMed] [Google Scholar]
- 28.Kowalczyk M, Sandberg G. Plant Physiol. 2001;127:1845–1853. [PMC free article] [PubMed] [Google Scholar]
- 29.Rittenberg D, Foster L. J Biol Chem. 1940;133:727–744. [Google Scholar]
- 30.Tamura K, Dudley J, Nei M, Kumar S. Mol Biol Evol. 2007;24:1596–1599. doi: 10.1093/molbev/msm092. [DOI] [PubMed] [Google Scholar]
Associated Data
This section collects any data citations, data availability statements, or supplementary materials included in this article.