Abstract
Understanding the dynamics of research production and collaboration may reveal better strategies for scientific careers, academic institutions, and funding agencies. Here we propose the use of a large and multidisciplinary database of scientific curricula in Brazil, namely, the Lattes Platform, to study patterns of scientific production and collaboration. Detailed information about publications and researchers is available in this database. Individual curricula are submitted by the researchers themselves so that coauthorship is unambiguous. Researchers can be evaluated by scientific productivity, geographical location and field of expertise. Our results show that the collaboration network is growing exponentially for the last three decades, with a distribution of number of collaborators per researcher that approaches a power-law as the network gets older. Moreover, both the distributions of number of collaborators and production per researcher obey power-law behaviors, regardless of the geographical location or field, suggesting that the same universal mechanism might be responsible for network growth and productivity. We also show that the collaboration network under investigation displays a typical assortative mixing behavior, where teeming researchers (i.e., with high degree) tend to collaborate with others alike.
Introduction
Nowadays, scientific collaboration is understood as extremely valuable, as it integrates skills, knowledge, apparatus and resources, allows division of labor and the study of more difficult problems, including interdisciplinary ones. It also brings recognition and visibility and increases the network of contacts of the researchers involved [1]–[3]. Scientific collaboration is strongly correlated with production measured by publication output and other indexes in Scientometrics [4]–[6], which has substantially contributed to raise the interest of the scientific community in studying itself over the last decades [2], [4], [7]–[10]. More recently, due to the fast growth and enormous development of the complex network science [11]–[22] the subject of scientific collaboration has been extensively studied under the framework of rather powerful and universal paradigms [23]–[29].
The Internet and the fact that traveling became substantially less costly have facilitated international collaborations. Still, geographical constraints affect the dynamics of research [30]–[32]. Different countries have different funding policies and this impacts the publication outcome, which is correlated to collaboration. For a country to be above the world average number of citations, it must spend more than one hundred thousand US dollars per researcher per year [32]. At the same time, scientists with more investment in their research projects collaborate more [33].
The social nature of collaboration [2], [34] might be the cause for the big disparity in production and number of collaborators [35]. Inequalities in income (Pareto distribution [36]) and movie co-appearance [37] are examples of social distributions, characterized by a power-law profile. For scientific collaborations, such distributions also appear, as demonstrated by Lotka [38], from the analysis of two empirical sets of publications data in natural sciences.
Although in Lotka's analysis [38] only the senior authorship has been considered, the obtained power-law was shown to be consistent with empirical bibliometric data taking all authors into account [39]. The so called Lotka's Law therefore seems to be valid even in different fields than those originally considered [39], [40]. It is also worth noting that highly prolific authors were excluded in Lotka's procedure due to the limited number of persons in the samples. These teeming researchers might lie outside the pure power-law distribution. Considering that engaging in collaboration is a time consuming activity, the number of collaborators can not be arbitrarily large, i.e., must be somehow limited. An exponential cutoff has then been suggested as a correction to fit the distribution of productivity [27]. Measuring the distributions of citations by city or country, a power-law distribution also arises [32], which indicates the presence of self-similarity in the science system [41].
Nonetheless, the definition of research collaboration is problematic due to the subjective understanding of its essential ingredients [2], [3]. This can be avoided by considering as scientific collaboration a research which resulted in a coauthored scientific paper. This approach, although traditional, is not free of criticism as there are fruitful and relevant collaborations which do not necessarily involve a publication. Notwithstanding, there is evidence that division of labor of theoretical or experimental work is usually rewarded with a coauthorship [3]. Also, analysing coauthorship makes it feasible to study collaboration of a greater number of researchers as compared by interviewing each individual.
Despite the numerous studies about scientific production, citations and collaborations found in the literature, it is difficult to compare these variables as the databases used in these studies are usually unrelated. Another problem is the small number of samples, due to a low number of respondents in questionnaires or data used only from a specific journal. To analyse the big picture is paramount to work with a dense information database. Here, we used data from Lattes Platform (http://lattes.cnpq.br), an online database maintained by CNPq (National Council of Technological and Scientific Development), a government agency that finances scientific research in Brazil. It contains the curricula of almost all researchers in Brazil and their collaborators abroad, as well as information concerning their research groups. The Lattes Curriculum became the standard national scientific curriculum in Brazil, and compulsory for those requiring financial support from the Brazilian government. The curricula present detailed information concerning the researcher, including, but not limited to, full name, gender, professional address, academic titles, field of expertise and list of papers. Researchers are classified in 8 major fields: Agricultural Sciences (Agr), Applied Social Sciences (Soc), Biological Sciences (Bio), Exact and Earth Sciences (Exa), Humanities (Hum), Health Sciences (Hea), Engineering (Eng), Linguistics and Arts (Lin), and Others (Oth). Most information in the curriculum are provided by the researcher themselves, for example, their list of publications.
By using this database, we may overcome some of the limitations found by other authors [23], [24]. Due to the lack of individual information of the researcher, the problem of author name disambiguation [24], [42] becomes relevant, when, for example, two or more authors share initials and surnames. This is not the case with the Lattes Platform, where coauthorship is unambiguous. Researchers themselves update their curricula with detailed information about their publications and professional activity. As a consequence, this type of data allows us to study scientific production and collaborations of individual researchers and correlations between fields of expertise.
Methods
The collaboration networks are build based on data of approximately 2.7 million curricula downloaded in June 2012 from the Lattes Platform website. Files are parsed to extract the name of the researcher, professional address and authored papers published in periodicals (including title, year and number of coauthors in the paper).
Due to possible typographical errors [43], an approximate string matching is used to compare paper titles. We use Damereau-Levenshtein distance [44] as the metric and compare papers of the same year and with the same number of authors starting with the same letter. Papers differing by 10% or less of the maximum distance are considered to be the same paper.
From the string matching results, we build a unweighted bipartite network  , with node classes
  and
and  , representing researchers and papers, respectively. A researcher
  in
in  is connected to a paper
  in
in  if
if  is identified as one of the authors of
  in the former procedure. Nodes store the information parsed previously:
  contains gender, fields of expertise, professional address and scholarships information while
  contains title, number of coauthors and year.
We focus our study on a projection of the bipartite network onto  . There are many ways to accomplish this [45], the simplest being to project
  onto an unweighted undirected network, with researchers
  and
and  connected if both are connected to a paper
  in
in  . We used this method to construct a cumulative network containing collaborations of all researchers in the database, the Total Collaboration Network (TCN). One should note that, with this database, we are not limited to the simple projecting scheme, since information on researchers and papers can be used in the projection. In order to illustrate this procedure, we show in Fig. 1 a network constructed only with researchers working on fields of Medicine in the state of São Paulo and with a grant from the Brazilian government. We did the projection in such way that the edges are directed, pointing to the researcher with the earliest date of publication of a paper. Unless noted otherwise, all the network projections analysed in this work are unweighted and undirected.
Figure 1. Sample network extracted from the collected data.
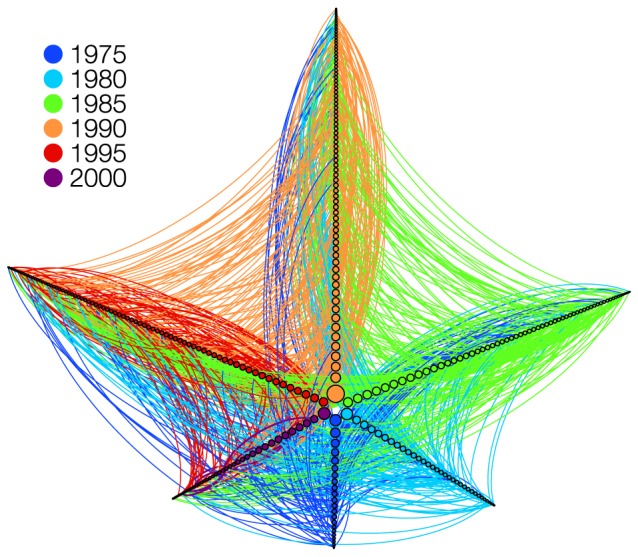
We show links between researchers (nodes) who were granted a scholarship and working in fields of Medicine in the state of São Paulo. Node size is proportional to the degree of the researcher in the whole database. Researchers were grouped according to the year of their first published paper. The first cohort (dark blue) comprises all researchers who published their first paper before 1975. Each subsequent one, in counterclockwise direction, comprises researchers who published within 5 years from the previous one, up to 2000. The edges are directed, colored according to the most senior.
The parameter for the exponential functions were estimated by logarithmic transformation and subsequent linear regression. For the power-law with exponential cutoff distributions,  , the
, the  parameters were initially estimated by numerically maximizing the corresponding log-likelihood function [46]. The values for the lower bounds of the modeled behavior,
  , were estimated from the corresponding Hill plot [46]. Subsequently, the
  parameters were estimated using the Levenberg-Marquardt Algorithm (LMA) with the previously estimated value of
  and
and  .
.
For power-law functions, we perform a logarithmic transformation followed by linear regression to calculate the power-law exponent.
Results and Discussion
TCN includes 275,061 researchers, with 90.4% belonging to the largest component. The total number of identified papers written in collaboration is 623,984, the number of collaborations is 1,095,871 and the network comprises all 8 major fields used by the Brazilian agency CNPq to classify researchers.
The extracted papers have publication date extending for several decades, the oldest paper in collaboration being from 1949. By analysing the growth of the network, we show in Fig. 2 (left) that the number of researchers ( ) as well as collaborations (
 ) grew exponentially in the last three decades,
  and
and  , with
  in years. We also show that the number of collaborations increases superlinearly with the number of researchers in the network. This accelerated growth has been observed in collaboration networks [23], [47] and other types of empirical networks [48]. More recently, it was shown that the number of social contacts and total communication also scales superlinearly with city population size [49].
Figure 2. Left: Number of researchers with published papers (black circles) and collaborations between them (red stars) present in the cumulative collaboration network.
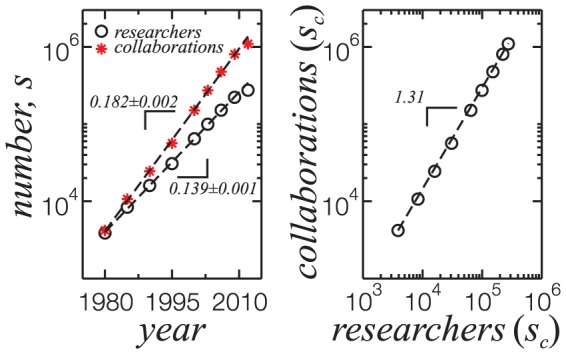
Dashed lines are exponential fits in the form  up to 2009, seen as straight lines in the linear-log plot. The coefficient
  is shown in the picture for each curve. Deviations of the 2012 data points from the exponential fit are due to the early acquisition of the curricula, in June of 2012. Right: Superlinear scaling of the number of collaborations with the number of researchers. Dashed line is a power-law curve with exponent
  .
.
To analyse the evolution of the largest component, we construct networks with a limited time window spanning five years centered in 1990, 1995, 2000, 2005 and 2010. This was accomplished projecting the bipartite network linking researchers connected to papers published only within the respective time window. Fig. 3 shows an increase in the largest component fraction over years, with a fraction 84.9% of researchers in the last data point. For this time window, we obtained the fraction of each field, shown on Table 1, indicating that fields are mixed in the largest component in the same proportion as in the complete network. The fact that more than 80% of the network is connected together with the field distribution is an interesting sign, which indicates that discoveries from a field can spread in the communities through interdisciplinary collaborations. As this last network is a subgraph of TCN, most of the links in latter were active in the last 5 years.
Figure 3. Evolution of the largest component.
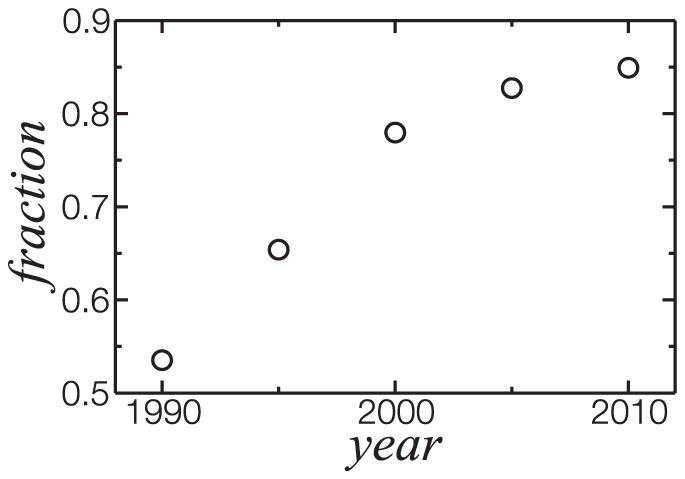
Data points represent the fraction of researchers present in the largest component for a five year time window centered in the respective year. More than 80% of the researchers engaged in collaborations in the last 5 years are in the largest component. They represent 61% of the researchers in TCN.
Table 1. Fraction of fields in the last 5 years.
| Field | fraction in largest component | fraction in the network |
| Agr | 13.9% | 12.2% |
| Bio | 18.0% | 15.8% |
| Hea | 26.3% | 24.1% |
| Exa | 13.0% | 12.3% |
| Hum | 5.9% | 8.9% |
| Soc | 5.1% | 7.3% |
| Eng | 6.5% | 6.5% |
| Lin | 0.5% | 1.8% |
The network was constructed by projecting the bipartite network onto a network containing only reseachers connected if they share a paper published in the last 5 years. Sum of fractions is not 100% because the field information is not available for all researchers.
A commendable initiative of the Brazilian government is to award scholarships to distinguished researchers among their peers. Doctorates may apply for several levels of scholarship. Applications are judged by a committee based on requestor's project, scientific contributions, participation as a journal editor, among other criteria. These scholarships correspond to a bonus payment in addition to their base salary. The scholarship information is included in the CV by CNPq, not by the researcher, and we obtain the list of researchers awarded when parsing their curricula. For comparison with the TCN, we built a collaboration network with only these researchers, projecting the bipartite network  onto
onto  connecting only awarded researchers with shared papers on
  , which we call Scholarship Collaboration Network (SCN). SCN is therefore a subgraph of TCN. In Table 2 we show the basic statistical properties of TCN and SCN.
Table 2. Statistics for the networks studied in this work.
| TCN | SCN | |
Number of researchers ( ) ) |
275,061 | 12,302 |
Number of edges ( ) ) |
1,095,871 | 134,186 |
| Total number of papers | 623,984 | 129,699 |
| Average researchers per paper | 4.51 | 5.26 |
Average papers per author ( ) ) |
11.1 | 61.4 |
Average number of collaborators ( ) ) |
8.0 | 38.1 |
| Largest component fraction | 90.4% | 94.6% |
Clustering coefficient ( ) ) |
0.465 | 0.266 |
Assortativity coefficient ( ) ) |
0.094 | 0.230 |
The clustering coefficient [11],  , measures the probability that two collaborators of a given researcher have papers in common (forming a triangle in the graph). Social networks are known to have high degree of clustering [14], which can be explained in terms of a hierarchical structure [15]. Here both networks display a high clustering coefficient but the average value for SCN is about half of TCN. This difference reflects the higher position in the research groups of the researchers with scholarship. They are more likely to have contacts in other research groups, which means being less clustered.
A relevant question which naturally arises is how the scientific productivity and collaboration statistics of researchers awarded with scholarships differ from regular researchers. Studying our database, we find that researchers in the SCN represent less than 5% of the researchers in the TCN but contribute with 20% of the production. They are in average more than five times more productive, as measured by publication output. Also, SCN is more cohesive than TCN, as measured by the size of the giant component. To determine whether these characteristics are cause or consequence of their scholarship is not our aim, but previous research on collaborations strategies indicate that those with higher grants are more likely to have more collaborators [33]. The degree distributions shown in Fig. 4 clearly corroborate this difference between groups.
Figure 4. Normalized distribution of the number of collaborators ( ) of researchers with scholarship (blue stars), without (black circles) and for the TCN (red triangles).
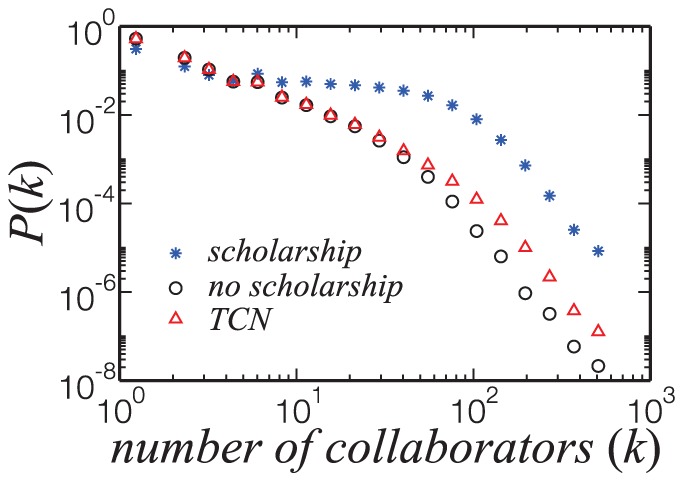
The distribution for researchers with scholarship decreases slowly up to one hundred collaborators, although most of them still have a small number of collaborators. The higher proportion of researchers with high  might reflect the CNPq policy of considering the proponent's participation in research groups, international immersion and human resources development to grant the scholarship.
The assortativity coefficient [13],  , measures the correlation between degrees of nodes at either ends of an edge. Networks with
  are said to display disassortative mixing, while
  means assortative mixing. Social networks, including collaborations networks, are known to display assortative mixing [13], [16]. Another way of looking at the assortative properties of a network is through the average nearest-neighbor degree,
  [17], where
  is the number of collaborators of a researcher. This measures how well connected the collaborators of a researcher are. If
  is an increasing function, then researchers with high
  collaborate with other well-connected researchers, and the network displays assortative mixing. We show in Fig. 5 that this occurs in TCN, and that
  increases logarithmically with
  . Assuming that researchers with a high number of collaborators are positioned in the top of the academic hierarchy, we can infer from Fig. 5 that prominent researchers and group leaders collaborate more among themselves. Nonetheless,
  does not grow fast but logarithmically, as researchers growing in importance absorb the influx of new actors in the network.
Figure 5. Variation of the average nearest-neighbor degree ( ) with
  .
.

Being an increasing function of  , the network displays assortative mixing. Researchers with high
  are more likely to collaborate with other well connected researchers. This tendency, however, increases logarithmically with
  , as indicated by the regression fit (dashed line).
It is inviting to verify if the production of researchers on Lattes Platform obeys Lotka's Law. As shown in Fig. 6, the distribution of scientific production (in number of papers,  ) obeys a power-law with exponential cutoff,
  , with exponent
  and characteristic cutoff length
  .
.
Figure 6. Distribution of scientific production of researchers belonging to the TCN group.
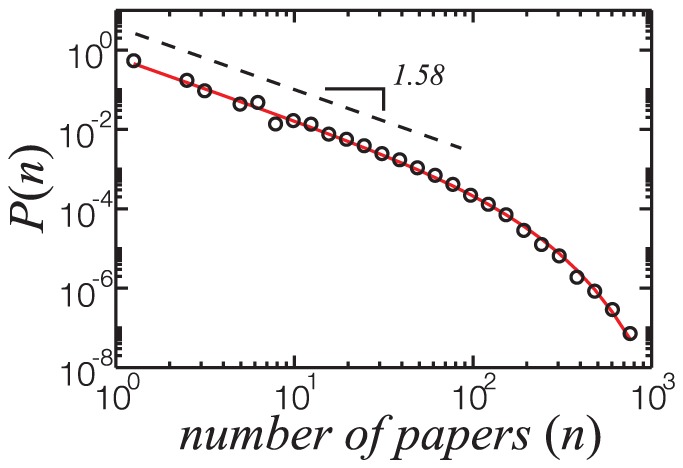
The solid red line is the best fit to the data points of a power-law with exponential cutoff,  , where
  and
and  . The dashed black line is a power-law with exponent
  .
.
With this database, we can study the time evolution of the cumulative collaboration network by analysing different groups of papers that have been published within a specific range of years. We show in Fig. 7 (a) the evolution of the distribution of the number of collaborators in TCN, from 1980 to 2012. We show in Fig. 7 (b) a rescaling of these curves by the relative number of collaborators for each year, collapsing onto a single curve. Figs. 7 (c) and (d) show the respective cumulative distributions. Although the cumulative distribution varies with year, with the increase of highly connect researchers, this distribution is constrained to the average number of collaborators of TCN (d).
Figure 7.
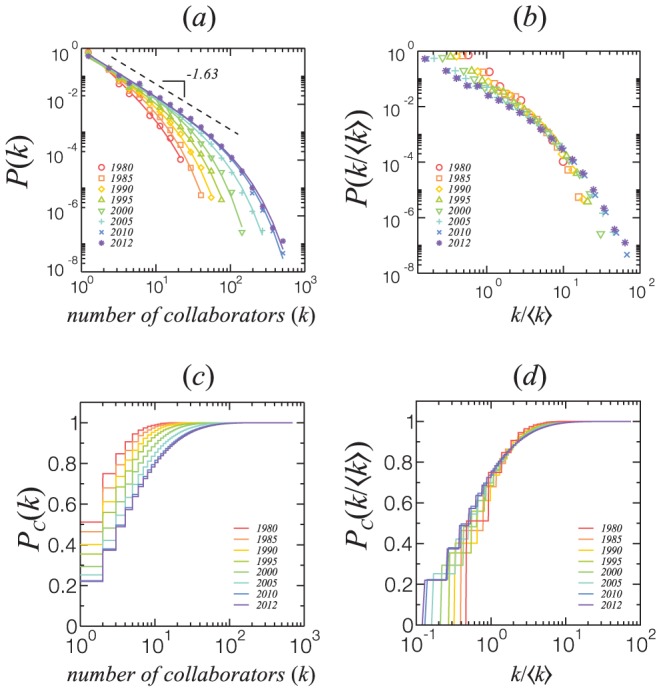
(a) Time evolution of the distribution of the number of collaborators in the TCN. (b) Rescaling the distribution in (a) by the relative number of collaborators for each year shows a collapse onto a single curve. We also show the respective cumulative distributions in (c) and (d). As the network ages, the fraction of researchers with high  increases (c), but the evolution of the network shows that the distribution is constrained to the average production (d).
We can use the professional address information included in the curricula to study the differences of collaboration profile due to geographical location. As shown in Fig. 8 (top), the overlap of the degree distributions for the TCN at each of the 26 states of Brazil and Brasília, the Federal District, suggests universality in the collaboration mechanism. The geographical location of the researcher, while not changing the shape of the distribution, is correlated with the spectrum of the number of collaborators. Recent allometric studies show that a large number of urban indicators (e.g., R&D employment, total wages, GDP, gasoline sales, length of electrical cables) scale as a power-law of population of the city [50]. In Fig. 8 (bottom) we show that the average number of collaborators per researcher in the Brazilian states  generally increases with their number of researchers as a power-law,
  with an exponent
  .
.
Figure 8. Top: Distribution of number of collaborators in the TCN for the 26 Brazilian states and the Federal District.
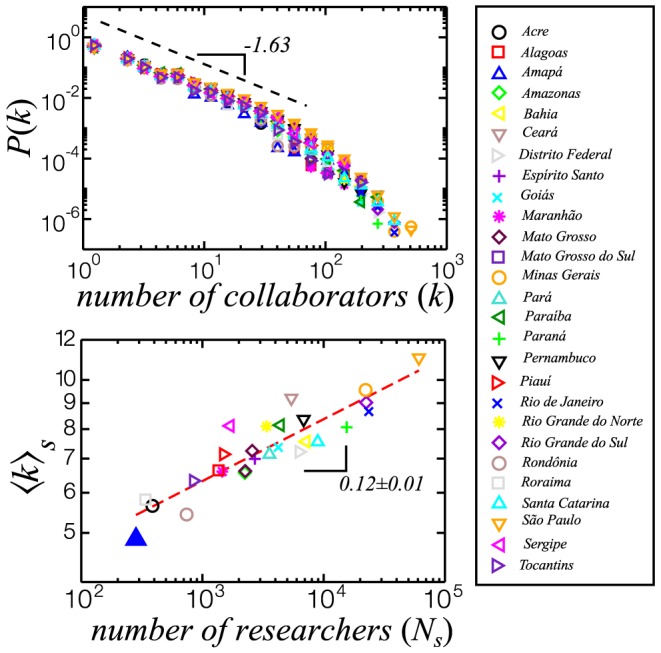
The distributions display the same behavior as the TCN (Fig. 7). The dashed line is a power-law with exponent  . Bottom: the average number of collaborators versus the number of researchers in each state. The circles correspond to the results for 26 Brazilian states and the Federal District. The dashed line is the best fit obtained by linear regression of the data to a power-law
  in logatirhmic scale, with exponent
  .
.
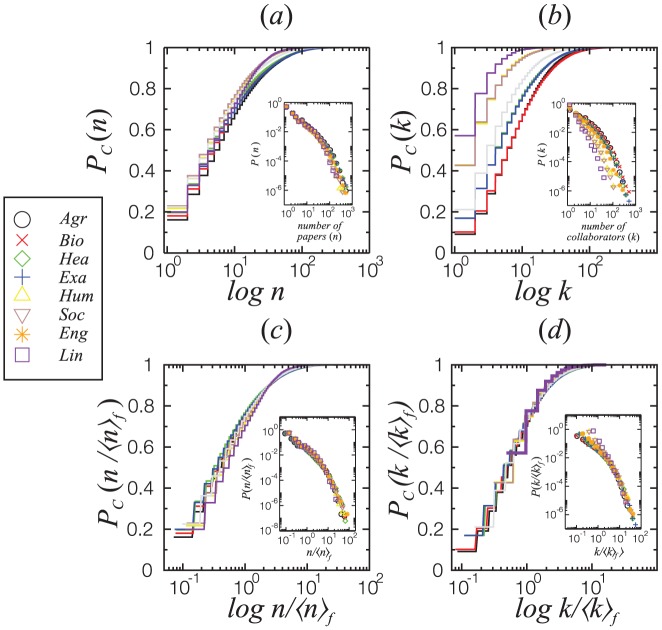
Finally, the way researchers from different fields collaborate can also be investigated with the data downloaded from the Lattes platform. Fig. 9(a) and (b) show that the cumulative distributions of researcher productivity  as well as their corresponding degree distributions
  , respectively, can be rather different for distinct fields. However, since different fields are known to have different levels of productivity [51], by rescaling
  and
and  to the corresponding average values of the field (see Table 3),
  and
and  , both
  and
and  distributions collapse to single universal curves, as depicted in Figs. 9(c) and (d), respectively.
Figure 9. Cumulative distributions  of the number of papers published per researcher
  (a) and number of collaborators (b) for each of the 8 major fields.
The respective distributions for the rescaled data are shown on (c) and (d). Lines represent different fields, colored according to the symbol in the legend. Scientists working on social sciences and related fields (Lin, Soc and Hum) are less likely to have published more than one hundred papers than others. They also are less likely to have more than one hundred collaborators. Considering the average publication count  and average number of collaborations
  in each field, all the curves collapse to a single universal behavior. The insets show the respective (non-cumulative) distributions.
Table 3. Statistics for researchers working on the 8 major fields associated with the TCN.
Number of researchers ( ) ) |
Researchers with scholarship ( ) ) |
Average number of papers per researcher ( ) ) |
Average number of collaborators ( ) ) |
|
| Agr | 31812 | 1692 | 13.9 | 11.7 |
| Bio | 39767 | 2605 | 13.1 | 12.5 |
| Hea | 67561 | 1511 | 12.6 | 9.08 |
| Exa | 33310 | 3273 | 13.5 | 9.16 |
| Hum | 26263 | 1324 | 8.90 | 3.21 |
| Soc | 20806 | 742 | 8.66 | 3.23 |
| Eng | 18365 | 1841 | 10.2 | 6.37 |
| Lin | 5202 | 300 | 9.09 | 2.06 |
Conclusions
In summary, we have used the Lattes Platform, which contains detailed and unambiguous data of approximately 2.7 million curricula of researchers, as a database for analysing research collaboration in Brazil. It has the advantage of displaying individual curricula, allowing us to study collaborations in a mix of a paper-based approach and questionnaire data.
We therefore built collaboration networks including all researchers data from Lattes Platform as June 2012, and found that the network has grown exponentially for the last three decades. The calculated values of the assortativity coefficient and the average nearest-neighbor degree indicate that the networks display assortative mixing, where researchers having high  collaborate with others alike. Our results show that these teeming researchers are more likely to have a scholarship and to produce more papers than researchers with low
  . The distribution
  is also approaching a power-law as the network gets older.
Finally, we confirmed the validity of Lotka's Law for researchers working on different states of Brazil and found substantial correlations between  and
and  . Lotka's Law is shown to be valid for different fields: indeed,
  and
and  follow an universal behavior.
Funding Statement
Project funded by the Brazilian Agencies CNPq (www.cnpq.br), CAPES (www.capes.gov.br), FUNCAP (www.funcap.ce.gov.br), the FUNCAP/CNPq Pronex grant, and the National Institute of Science and Technology for Complex Systems in Brazil. The funders had no role in study design, data collection and analysis, decision to publish, or preparation of the manuscript.
References
- 1. Fox MF, Faver CA (1984) Independence and cooperation in research: The motivations and costs of collaboration. J Higher Educ 55: 347. [Google Scholar]
- 2. Katz JS, Martin BR (1997) What is research collaboration? Res Policy 26: 1. [Google Scholar]
- 3. Laudel G (2002) What do we measure by co-authorships. Res Eval 11: 3. [Google Scholar]
- 4. Beaver D, Rosen R (1978) Studies in scientific collaboration. Scientometrics 1: 65. [Google Scholar]
- 5. Lawani SM (1986) Some bibliometric correlates of quality in scientific research. Scientometrics 9: 13. [Google Scholar]
- 6. Lee S, Bozeman B (2005) The impact of research collaboration on scientific productivity. Soc Stud Sci 35: 673. [Google Scholar]
- 7. de Solla Price DJ, Beaver D (1966) Collaboration in an invisible college. Am Psychol 21: 1011. [DOI] [PubMed] [Google Scholar]
- 8. Frame JD, Carpenter MP (1979) International research collaboration. Soc Stud Sci 9: 481. [Google Scholar]
- 9. Heffner AG (1981) Funded research, multiple authorship, and subauthorship collaboration in four disciplines. Scientometrics 3: 5. [Google Scholar]
- 10.Kraut R, Egido C (1988) Patterns of Contact and Communication in Scientific Research Collaboration. ACM Press, 1–12 pp.
- 11. Watts DJ, Strogatz SH (1998) Collective dynamics of ‘small-world’ networks. Nature 393: 440. [DOI] [PubMed] [Google Scholar]
- 12. Albert R, Barabási AL (2002) Statistica mechanics of complex networks. Rev Mod Phys 74: 47. [Google Scholar]
- 13. Newman MEJ (2002) Assortative mixing in networks. Phys Rev Lett 89: 208701. [DOI] [PubMed] [Google Scholar]
- 14. Newman MEJ (2003) The structure and function of complex networks. SIAM Rev Soc Ind Appl Math 45: 167. [Google Scholar]
- 15. Ravasz E, Barabási AL (2003) Hierarchical organization in complex networks. Phys Rev E Stat Nonlin Soft Matter Phys 67: 026112. [DOI] [PubMed] [Google Scholar]
- 16. Barrat A, Barthélemy M, Pastor-Satorras R, Vespignani A (2004) The architecture of complex weighted networks. Proc Natl Acad Sci USA 101: 3747. [DOI] [PMC free article] [PubMed] [Google Scholar]
- 17. Barrat A, Barthélemy M, Vespignani A (2004) Modeling the evolution of weighted networks. Phys Rev E Stat Nonlin Soft Matter Phys 70: 066149. [DOI] [PubMed] [Google Scholar]
- 18. Moreira AA, Paula DR, Filho RMC, Andrade JS (2006) Competitive cluster growth in complex networks. Phys Rev E Stat Nonlin Soft Matter Phys 73: 065101. [DOI] [PubMed] [Google Scholar]
- 19. Lind PG, da Silva LR, Andrade JS, Herrmann HJ (2007) Spreading gossip in social networks. Phys Rev E Stat Nonlin Soft Matter Phys 76: 036117. [DOI] [PubMed] [Google Scholar]
- 20. Moreira AA, Andrade JS, Herrmann HJ, Indekeu JO (2009) How to make a fragile network robust and vice versa. Phys Rev Lett 102: 018701. [DOI] [PubMed] [Google Scholar]
- 21. Galvão V, Miranda JGV, Andrade RFS, Andrade JS, Gallos LK, et al. (2010) Modularity map of the network of human cell differentiation. Proc Natl Acad Sci USA 107: 5750. [DOI] [PMC free article] [PubMed] [Google Scholar]
- 22. Schneider CM, Moreira AA, Andrade JS, Havlin S, Herrmann HJ (2011) Mitigation of malicious attacks on networks. Proc Natl Acad Sci USA 108: 3838. [DOI] [PMC free article] [PubMed] [Google Scholar]
- 23. Barabási AL, Jeong H, Néda Z, Ravasz E, Schubert A, et al. (2002) Evolution of the social network of scientific collaboration. Physica A 311: 590. [Google Scholar]
- 24. Newman MEJ (2002) Scientific collaboration networks. i. network construction and fundamental results. Phys Rev E Stat Nonlin Soft Matter Phys 64: 016131. [DOI] [PubMed] [Google Scholar]
- 25. Newman MEJ (2002) Scientific collaboration networks. ii. shortest paths, weighted networks, and centrality. Phys Rev E Stat Nonlin Soft Matter Phys 64: 016132. [DOI] [PubMed] [Google Scholar]
- 26. Goh K, Oh E, Jeong H, Kahng B, Kim D (2002) Classification of scale-free networks. Proc Natl Acad Sci USA 99: 12583. [DOI] [PMC free article] [PubMed] [Google Scholar]
- 27. Newman MEJ (2004) Coauthorship networks and patterns of scientific collaboration. Proc Natl Acad Sci USA 101: 5200. [DOI] [PMC free article] [PubMed] [Google Scholar]
- 28. Ramasco JJ, Dorogovtsev SN, Pastor-Satorras R (2004) Self-organization of collaboration networks. Phys Rev E Stat Nonlin Soft Matter Phys 70: 036106. [DOI] [PubMed] [Google Scholar]
- 29. Li M, Fan Y, Chen J, Gao L, Di Z, et al. (2005) Weighted networks of scientific communication: the measurement and topological role of weight. Physica A 350: 643. [Google Scholar]
- 30. Katz JS (1994) Geographical proximity and scientific collaboration. Scientometrics 31: 31. [Google Scholar]
- 31. Ponds R, Oort FV, Frenken K (2007) The geographical and institutional proximity of research collaboration. Pap Reg Sci 86: 423. [Google Scholar]
- 32. Pan RK, Kaski K, Fortunato S (2012) World citation and collaboration networks: uncovering the role of geography in science. Sci Rep 2: 902. [DOI] [PMC free article] [PubMed] [Google Scholar]
- 33. Bozeman B, Corley E (2004) Scientists' collaboration strategies: implications for scientific and technical human capital. Res Policy 33: 599. [Google Scholar]
- 34.Hagstrom WO (1964) The Scientific Community. Basic Books, 297 pp.
- 35. Muchnik L, Pei S, Parra LC, Reis SDS, Andrade JS, et al. (2013) Origins of power-law degree distribution in the heterogeneity of human activity in social networks. Sci Rep 3: 01783. [DOI] [PMC free article] [PubMed] [Google Scholar]
- 36.Pareto V (1897) Cours d'économie politique. Lausanne: F. Rouge, 426 pp.
- 37. Gallos LK, Potiguar FQ, Andrade JS, Makse HA (2013) Imdb network revisited: unveiling fractal and modular properties from a typical small-world network. PLoS ONE 8: e66443. [DOI] [PMC free article] [PubMed] [Google Scholar]
- 38. Lotka AJ (1926) The frequency distribution of scientific productivity. J Wash Acad Sci 16: 317. [Google Scholar]
- 39. Nicholls PT (1986) Empirical validation of lotka's law. Inf Process Manag 22: 417. [Google Scholar]
- 40. Pao ML (1986) An empirical examination of lotka's law. J Am Soc Inf Sci 37: 26. [Google Scholar]
- 41. Katz JS (1999) The self-similar science system. Res Policy 28: 501. [Google Scholar]
- 42. Tang L, Wash JP (2010) Bibliometric fingerprints: name disambiguation based on approximate structure equivalence of cognitive maps. Scientometrics 84: 763. [Google Scholar]
- 43. O'Neill ET, Rogers SA, Oskins WM (1993) Characteristics of duplicate records in oclc's online union catalog. Libr Resour Tech Serv 37: 59. [Google Scholar]
- 44. Wagner RA, Lowrance R (1975) An extension of the string-to-string correction problem. J Assoc Comput Mach 22: 177. [Google Scholar]
- 45. Zhou T, Ren J, Medo M, Zhang YC (2007) Bipartite network projection and personal recommendation. Phys Rev E Stat Nonlin Soft Matter Phys 76: 046115. [DOI] [PubMed] [Google Scholar]
- 46. Clauset A, Shalizi CR, Newman MEJ (2009) Power-law distributions in empirical data. SIAM Rev 51: 661. [Google Scholar]
- 47.Zhang J (2012) Growing random geometric graph models of super-linear scaling law. arXiv e-print: arXiv:1212.4914 [physics.soc-ph].
- 48.Dorogovtsev SN, Mendes JFF (2002) Accelerated growth of networks. arXiv e-print: arXiv:condmat/0204102 [cond-mat.stat-mech].
- 49.Schläpfer M, Bettencourt LMA, Grauwin S, Raschke M, Claxton R, et al.. (2013) The scaling of human interactions with city size. arXiv e-print: arXiv:1210.5215v2 [physics.soc-ph]. [DOI] [PMC free article] [PubMed]
- 50. Bettencourt LMA, Lobo J, Helbing D, Kühnert C, West GB (2007) Growth, innovation, scaling, and the pace of life in cities. P Natl Acad Sci USA 104: 7301. [DOI] [PMC free article] [PubMed] [Google Scholar]
- 51. Allison PD (1980) Inequality and scientific productivity. Soc Stud Sci 10: 163. [Google Scholar]


