

Abstract
Cerebral blood flow (CBF) provides an indication of the metabolic status of the cortex and may have utility in elucidating preclinical brain changes in persons at risk for Alzheimer's disease (AD) and related diseases. In this study, we investigated CBF in 327 well-characterized adults including patients with AD (n = 28), patients with amnestic mild cognitive impairment (aMCI, n = 23), older cognitively normal (OCN, n = 24) adults, and asymptomatic middle-aged adults (n = 252) with and without a family history (FH) of AD. Compared with the asymptomatic cohort, AD patients displayed significant hypoperfusion in the precuneus, posterior cingulate, lateral parietal cortex, and the hippocampal region. Patients with aMCI exhibited a similar but less marked pattern of hypoperfusion. Perfusion deficits within the OCN adults were primarily localized to the inferior parietal lobules. Asymptomatic participants with a maternal FH of AD showed hypoperfusion in hippocampal and parietofrontal regions compared with those without a FH of AD or those with only a paternal FH of AD. These observations persisted when gray matter volume was included as a voxel-wise covariate. Our findings suggest that having a mother with AD might confer a particular risk for AD-related cerebral hypoperfusion in midlife. In addition, they provide further support for the potential utility of arterial spin labeling for the measurement of AD-related neurometabolic dysfunction, particularly in situations where [18F]fluorodeoxyglucose imaging is infeasible or clinically contraindicated.
Keywords: Alzheimer's disease, cerebral blood flow, maternal family history, preclinical, pseudocontinuous arterial spin labeling
Introduction
Parental family history (FH) of sporadic Alzheimer's disease (AD) is an established risk factor for the development of the disease (Jarvik et al. 2008). Population studies suggest that, among cognitively normal elders, first-degree relatives of AD probands could, in some cases, be at a 10-fold increased risk of developing the disease compared with peers without an AD-affected relative (Silverman et al. 2005). Further support for the unique contribution of FH to the risk of AD comes from neuroimaging and biomarker studies that have indicated that the deleterious effect of FH on AD-vulnerable brain regions and molecular markers is comparable in magnitude to, and generally independent of, the effect attributable to apolipoprotein E ɛ4 allele (APOE4), the only established genetic risk factor for sporadic AD (Johnson et al. 2006; van Exel et al. 2009; Bendlin et al. 2010; Donix et al. 2010; Xiong et al. 2011; Okonkwo et al. 2012).
Cerebral hypometabolism, typically indexed using [18F]fluorodeoxyglucose positron emission tomography (FDG-PET), is now a well-recognized feature of AD and has a distinct topography that spans the temporoparietal association cortices, precuneus, posterior cingulate, and frontal association cortices (Herholz et al. 2007). Because cerebral metabolism is generally tightly coupled to cerebral blood flow (CBF; Fox and Raichle 1986), arterial spin labeling (ASL)—which provides a direct assessment of CBF using magnetic resonance imaging (MRI)—is a viable surrogate for FDG-PET, particularly because it is noninvasive, rapidly repeatable, can be acquired within a short amount of time (∼5 min), and does not involve exposure to radiation (Alsop et al. 2010). Investigations of CBF in AD have revealed the existence of a characteristic pattern of cerebral hypoperfusion that is remarkably analogous to the topography of hypometabolism in AD (Johnson et al. 2005; Chen, Wolk, et al. 2011; Musiek et al. 2012).
A limited number of studies have suggested that ASL CBF may be sensitive to neurometabolic alterations among persons with risk factors for AD including individuals with mild cognitive impairment (MCI; Johnson et al. 2005; Xu et al. 2007; Chao et al. 2009; Dai et al. 2009; Bangen et al. 2012) and cognitively normal adults who have a FH of AD and/or carry the APOE4 allele (Fleisher et al. 2009; Filippini et al. 2011); with the latter set of studies yielding inconsistent findings. However, only recently has the ASL methodolgy become more fully developed and readily available across major scanner vendors (Alsop 2012), suggesting the need for a renewed evaluation of the utility of ASL CBF within the context of AD, from its preclinical stages to frank dementia. Therefore, in this cross-sectional study, we used a whole-brain CBF sequence with established fidelity (Gevers et al. 2011) to evaluate resting CBF in a large sample (n = 327) of well-characterized adults spanning the AD spectrum from at-risk cognitively healthy middle-aged individuals to patients with probable AD.
To further establish the validity of the ASL technique in our hands (Xu et al. 2010), we first investigated CBF alterations in older cognitively normal (OCN) adults, persons with amnestic MCI (aMCI), and those with mild AD compared with an asymptomatic middle-aged reference group who were APOE4− and had no FH of AD. Then, because the preclinical stages of AD is where the least scientific progress has been made to date and where the greatest clinical gains can be achieved with respect to the prevention of the disease, we focused our analyses within the asymptomatic cohort with the goal of elucidating the effects of FH and APOE4 on CBF. We especially concentrated on determining the potential effect of “parent of origin” on CBF based on prior evidence that the sex of the AD-affected parent may be influential, with maternal FH imparting a greater risk (Mosconi et al. 2007; Bendlin et al. 2010; Honea et al. 2010). Finally, we investigated associations between CBF and cognitive performance across 6 cognitive domains in this asymptomatic cohort.
Materials and Methods
Participants
Two hundred fifty-two middle-aged adults were recruited from the Wisconsin Registry for Alzheimer's Prevention (WRAP) cohort into this neuroimaging study. The WRAP is a longitudinal registry of approximately 1500 middle-aged adults who were cognitively healthy and between the ages of 40 and 65 at study entry (Sager et al. 2005). Of these recruited 252 individuals, 177 persons had at least one parent with a reported diagnosis of AD (FH+ group; 50% APOE4+) and the other 75 individuals reported no FH of AD (FH− group; 21% APOE4+). Of the 177 FH+ participants, 111 persons had a maternal history of AD (mFH+; 51% APOE4+), 54 had a paternal history (pFH+; 50% APOE4+), and 12 had both parents afflicted with AD (mpFH+; 33% APOE4+).
To verify the diagnosis of AD in the parent, parental medical records were obtained (including autopsy reports when available) and reviewed by a multidisciplinary diagnostic consensus panel at the Wisconsin Alzheimer's Disease Research Center (WADRC). In the majority of cases, the parent's clinical work-up and diagnosis of AD had occurred at the University of Wisconsin Memory Clinics. The absence of a FH of AD was verified through detailed medical history surveys and phone interview with the participants. Inclusion in the FH− group required that the father survives to at least age 70 and the mother to age 75 without incurring a formal diagnosis of dementia or exhibiting cognitive deterioration.
This study also included data from 24 OCN adults, 23 persons with aMCI, and 28 persons with mild AD who were enrolled in the WADRC. These individuals were diagnostically characterized in the WADRC's multidisciplinary consensus conferences using applicable clinical criteria (McKhann et al. 1984; Petersen et al. 2001). The underlying etiology for all aMCI cases was attributed to AD. Sixteen cases (70%) had isolated memory impairment, whereas 7 had additional impairments in other cognitive domains. For these multidomain cases, additional domains of impairment were executive function (n = 5), language (n = 1), and executive function plus language (n = 1). The University of Wisconsin Institutional Review Board approved all study procedures and each participant provided signed informed consent before participation.
Neuropsychological Assessment
The 252 participants recruited from WRAP completed a comprehensive neuropsychological battery (Sager et al. 2005) that included the Clinical Dementia Rating Scale (CDR), the Mini-Mental State Exam (MMSE), and other psychometric measures that span traditional cognitive domains of memory, attention, executive function, language, and visuospatial ability. An earlier factor analytic study of psychometric measures within the larger WRAP cohort (Dowling et al. 2010) showed that these tests map onto 6 cognitive factors—Immediate Memory, Verbal Learning and Memory, Working Memory, Speed and Flexibility, Visuospatial Ability, and Verbal Ability (see Table 1 for the full listing of each factor's constituent tests). These factor scores were used in our evaluation of the association between CBF and cognition in this study. Those participants enrolled in the WADRC also underwent an extensive neuropsychological evaluation, consisting of all components of the National Alzheimer's Coordinating Center's Uniform Dataset (Weintraub et al. 2009).
Table 1.
Characteristics of study participants at baselinea
| Variable | Asymptomatic cohort (n = 252) | OCN (n = 24) | MCI (n = 23) | Mild AD (n = 28) | P-value* |
|---|---|---|---|---|---|
| Demographic | |||||
| FH+, % | 70.2 | 54.2 | 68.2 | 55.6 | 0.206 |
| APOE4+, % | 41.3 | 38.1 | 56.5 | 68.0b,c | 0.039 |
| Female, % | 69.8 | 50.0b | 30.4b | 42.9b | <0.001 |
| Age | 59.15 (6.47) | 75.07 (6.30)b | 73.25 (6.95)b | 75.09 (9.81)b | <0.001 |
| Education | 16.37 (2.65) | 16.50 (3.32) | 16.83 (2.95) | 14.57 (3.05)b,c,d | 0.008 |
| Clinical/cognitive | |||||
| CDR global = 0, % | 97.7 | 91.7 | 4.3b,c | 0.0b,c,d | <0.001 |
| CDR sum of boxes | 0.02 (0.13) | 0.13 (0.42) | 1.94 (1.27)b,c | 4.25 (1.62)b,c,d | <0.001 |
| MMSE | 29.31 (0.99) | 29.04 (1.02) | 26.96 (2.01)b,c | 22.04 (3.65)b,c,d | <0.001 |
| RAVLT total | 51.66 (7.94) | 42.29 (9.58)b | 29.48 (8.43)b,c | 21.04 (6.68)b,c,d | <0.001 |
| RAVLT short delay | 10.82 (2.54) | 8.46 (3.27)b | 3.13 (2.05)b,c | 1.25 (1.53)b,c,d | <0.001 |
| RAVLT long delay | 10.78 (2.71) | 7.79 (3.13)b | 2.30 (2.23)b,c | 0.57 (1.32)b,c,d | <0.001 |
| RAVLT recognition | 13.95 (1.30) | 13.71 (1.92) | 10.87 (3.35)b,c | 7.21 (3.73)b,c,d | <0.001 |
| Immediate Memorye | 0.07 (1.01) | ||||
| RAVLT trial 1 | — | — | — | — | — |
| RAVLT trial 2 | — | — | — | — | — |
| Verbal Learning and Memorye | 0.14 (0.97) | ||||
| RAVLT trial 3 | — | — | — | — | — |
| RAVLT trial 4 | — | — | — | — | — |
| RAVLT trial 5 | — | — | — | — | — |
| RAVLT long delay | — | — | — | — | — |
| Working Memorye | 0.16 (1.04) | ||||
| WAIS Dig. Sp. Fwd. | — | — | — | — | — |
| WAIS Dig. Sp. Bwd. | — | — | — | — | — |
| WAIS L–N Seq. | — | — | — | — | — |
| Speed and Flexibilitye | 0.20 (0.98) | ||||
| Stroop color-word | — | — | — | — | — |
| Trail making Test A | — | — | — | — | — |
| Trail making Test B | — | — | — | — | — |
| Visuospatial Abilitye | 0.28 (0.89) | ||||
| WASI block design | — | — | — | — | — |
| WASI matrix reas. | — | — | — | — | — |
| Benton JLO | — | — | — | — | — |
| Verbal Abilitye | 0.23 (0.93) | ||||
| WASI vocabulary | — | — | — | — | — |
| WASI similarities | — | — | — | — | — |
| Boston naming test | — | — | — | — | — |
| WRAT III—Reading | — | — | — | — | — |
| CBF, ml/100 g/minf | — | — | — | — | — |
| Global gray matter | 45.42 (11.11) | 40.32 (11.27) | 35.32 (11.18) | 32.48 (11.06) | — |
| Hippocampus | 43.32 (10.79) | 39.87 (10.98) | 36.13 (10.85) | 33.73 (10.79) | — |
| Parahippocampal gyrus | 42.52 (11.27) | 40.18 (11.42) | 35.25 (11.33) | 36.17 (11.21) | — |
| Amygdala | 41.40 (10.63) | 37.53 (10.83) | 33.17 (10.70) | 31.84 (10.63) | — |
| Superior frontal gyrus | 49.77 (13.33) | 44.53 (13.43) | 39.98 (13.34) | 38.22 (13.23) | — |
| Middle frontal gyrus | 48.48 (14.12) | 42.49 (14.31) | 36.23 (14.16) | 32.71 (14.07) | — |
| Superior parietal lobule | 37.02 (11.74) | 31.05 (11.96) | 25.84 (11.81) | 20.98 (11.74) | — |
| Inferior parietal lobule | 42.63 (11.74) | 37.64 (11.91) | 31.07 (11.81) | 26.07 (11.74) | — |
| Posterior cingulate | 57.64 (15.87) | 51.91 (16.02) | 42.92 (15.89) | 38.41 (15.76) | — |
| Precuneus | 52.35 (14.60) | 45.85 (14.90) | 38.26 (14.74) | 33.37 (14.65) | — |
OCN = older cognitively normal adults; aMCI = amnestic mild cognitive impairment; AD = Alzheimer's disease; FH = a family history of Alzheimer's disease; APOE4 = the varepsilon 4 allele of the apolipoprotein E gene; CDR = Clinical Dementia Rating Scale; MMSE = Mini-Mental State Exam; RAVLT = Rey Auditory Verbal Learning Test; WAIS = Wechsler Adult Intelligence Scale; Dig. Sp. Fwd. = digit span forward; Dig. Sp. Bwd. = digit span backward; L–N Seq. = letter–number sequencing; WASI = Wechsler Abbreviated Scale of Intelligence; Matrix Reas. = matrix reasoning; JLO = judgment of line orientation; WRAT III = Wide-Range Achievement Test, 3rd edition.
aAll values are mean (SD) except where otherwise indicated.
bSignificantly different from the asymptomatic cohort.
cSignificantly different from OCN
dSignificantly different from MCI.
eThese are factor scores derived from a factor analysis of the battery of tests administered to the asymptomatic cohort. Tests listed below each factor are the components of that factor. See Dowling et al. (2010) for details.
fThese values have been adjusted for differences in post-labeling delay. They are presented for descriptive purposes. Hence, no statistical comparisons were performed.
*Reported P-value is for an omnibus test of group difference.
Neuroimaging Protocol
The MRI scans were acquired in the axial plane on a GE ×750 3.0-T scanner with an 8-channel phased array head coil (General Electric, Waukesha, WI). Three-dimensional (3D) T1-weighted inversion recovery-prepared spoiled gradient echo scans were collected using the following parameters: inversion time (TI)/echo time (TE)/repetition time (TR) = 450 ms/3.2 ms/8.2 ms, flip angle = 12°, slice thickness = 1 mm no gap, field of view (FOV) = 256, matrix size = 256 × 256. Resting CBF assessments were made using background-suppressed pseudocontinuous ASL (pcASL; Ye et al. 2000; Dai et al. 2008) featuring a 3-D fast spin echo spiral sequence that utilizes a stack of variable-density spiral 4-ms readout and 8 interleaves. Scan parameters included TE/TR = 10.5 ms/4.9 s, slice thickness = 4 mm no gap, FOV = 240, matrix size = 128 × 128, number of excitations = 3, and labeling radiofrequency (RF) amplitude = 0.24 mG. Multislice spin labeling was implemented using a single coil that eliminates off-resonance errors (Garcia et al. 2005). Due to a protocol change during the course of the study, post-labeling delay was 1525 ms for some participants (69% of sample) and 2025 ms for others. Accordingly, this measure was included as a covariate in all CBF analyses to control for any potential effect, it may have had on CBF quantitation. The three acquisitions that comprise the pcASL sequence (i.e., NEX = 3) were averaged to improve signal-to-noise ratio. The pcASL sequence also included a fluid-suppressed proton density (PD) acquisition, with the same imaging sequence/image slab location as the pcASL but without the RF-labeling preparation, for CBF flow quantitation and image registration. The entire pcASL sequence—all 3 excitations plus PD scan—lasts 4 min and 27 s. To preserve the fidelity of the CBF assessment, scanning was done after a minimum 4-h fast from food, tobacco, caffeine, and medications with vasomodulatory properties. We have previously reported excellent test–retest reliability (r > 0.95) of this pcASL procedure (Xu et al. 2010).
Image Processing
The CBF images were processed using SPM8 (www.fil.ion.ucl.ac.uk/spm). The procedure essentially involved registering each participant's co-localized PD image to their T1 volume, applying the derived transformation matrix to their average quantitative CBF map, then spatially normalizing the T1 volume and associated CBF image to the Montreal Neurological Institute (MNI) template, with resampling to a 2 × 2 × 2 mm voxel size. The normalized CBF maps were then smoothed using an 8-mm full-width at half-maximum Gaussian kernel. We corrected for inter-individual variations in global perfusion by scaling each voxel in the CBF map by the mean whole-brain CBF. To focus our analyses on brain regions known to be implicated in AD and reduce the risk of false-positive errors, we 1) imposed an a priori anatomical mask (Fig. 1) that included the bilateral superior and middle frontal cortices, superior and inferior parietal lobules, precuneus, posterior cingulate, parahippocampal gyrus, amygdala, and hippocampus using the WFU PickAtlas toolbox (Maldjian et al. 2003) and 2) masked the CBF maps using SPM8's gray matter (GM) tissue priors in order to minimize the inclusion of white matter and cerebrospinal fluid in our analyses. For descriptive purposes, the FreeSurfer image analysis suite (http://surfer.nmr.mgh.harvard.edu/) was used to extract mean CBF values in the entire cortical mantle and within each of the 9 regions in our anatomical mask (Table 1). In brief, this was accomplished by first rendering each participant's native T1 volume in FreeSurfer space, co-registering their PD and average CBF images to this FreeSurfer-rendered T1 volume, and then using FreeSurfer's APARC + ASEG template as a mask for extracting mean CBF values in the regions of interest.
Figure 1.
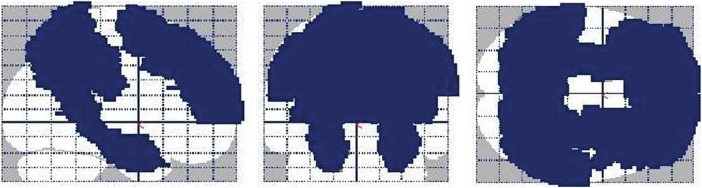
A glass brain rendering of the a priori anatomical mask utilized in this study. The mask, which was constructed using the WFU PickAtlas toolbox (Maldjian et al. 2003), included the bilateral superior and middle frontal cortices, superior and inferior parietal lobules, precuneus, posterior cingulate, parahippocampal gyrus, amygdala, and hippocampus. The left side of the image is the left side of the brain.
Statistical Analysis
Data describing participants' baseline characteristics were analyzed using SPSS 20.0 (IBM Corp., Armonk, NY). To delineate changes in CBF across the AD spectrum, we fitted a voxel-wise analyses of covariance in SPM8 that compared CBF in each of the OCN, MCI, and AD groups to CBF in the asymptomatic (i.e. WRAP) cohort, with age, sex, and post-labeling delay as covariates. For this initial set of analyses, we utilized data from only those asymptomatic participants who had neither a FH of AD nor carried an APOE4 allele (FH–APOE4−, n = 59, mean age = 62.03 ± 5.81, 69.5% female). We specifically chose the FH–APOE4− group as the reference group in this initial set of analyses because they were devoid of established risk factors for AD, i.e. age, FH of AD, and APOE4 carriership. Thus, they provide a “reference” of sorts as to what CBF should be in the absence of compromising risk factors for AD. Within the asymptomatic cohort, we also fitted age-, sex-, and post-labeling delay-adjusted voxel-wise ANCOVAs to assess the respective effects of FH, APOE4 status, and parent of origin on CBF, with APOE4 status being an additional covariate in the FH and parent-of-origin analyses. Lastly, within the asymptomatic cohort, we investigated voxel-wise associations between each of the 6 cognitive domains and CBF using a multiple regression framework that adjusted for age, education, and post-labeling delay. For all the CBF analyses described above, only clusters with a minimum of 101 contiguous voxels and Pvoxel <0.005 were deemed significant. This a priori threshold was derived via Monte Carlo simulations (3dClustSim, AFNI, http://afni.nimh.nih.gov).
Results
Baseline Characteristics
Table 1 details the baseline characteristics of the study participants. The AD group had proportionately more APOE+ individuals than the asymptomatic and OCN groups. They also had fewer years of schooling than the asymptomatic, OCN, and MCI groups. There were proportionately more women in the asymptomatic cohort than the other 3 groups. Similarly, the asymptomatic cohort was younger than the other groups. As expected, the AD group had worse clinical/cognitive status than the other 3 groups, and the MCI group was more impaired than the asymptomatic and OCN groups. The OCN group differed from the asymptomatic group on measures of episodic memory, but not on the CDR or MMSE.
CBF Findings
Alterations in CBF Across the AD Spectrum
Table 2 summarizes our analyses of differences in CBF within the OCN, MCI, and AD groups compared with the FH−APOE4− asymptomatic individuals. The AD group (Fig. 2A) exhibited hypoperfusion in a large cluster comprising portions of the bilateral inferior and superior parietal lobules, precuneus, and posterior cingulate cortex. Additionally, hypoperfusion was evident in the right superior, medial, and middle frontal gyri, and the left parahippocampal gyrus/amygdala and middle frontal gyrus. Patients with MCI (Fig. 2B) exhibited essentially the same pattern of hypoperfusion as seen in the AD group, although the effect was comparatively weaker and less pervasive. The OCN group (Fig. 2C) exhibited hypoperfusion in the bilateral inferior parietal lobule, left superior parietal lobule, bilateral superior frontal gyrus, and right middle frontal gyrus. Unlike the MCI and AD groups, the mesial temporal lobe was not hypoperfused in the OCN group. There were no regions wherein the FH−APOE4− asymptomatic participants showed hypoperfusion compared with the other groups.
Table 2.
CBF differences across the AD spectrum
| Contrast | Anatomical label | Voxels | Peak T-value | MNI x, y, z coordinates |
|---|---|---|---|---|
| FH−APOE− asymptomatic participants > AD | Right inferior parietal lobule | 14 178 | 5.47 | 48, −62, 24 |
| Right middle frontal gyrus | 6182 | 4.70 | 36, 50, 24 | |
| Left parahippocampal gyrus | 281 | 3.86 | −20, 4, −28 | |
| Left middle frontal gyrus | 555 | 3.52 | −36, 24, 32 | |
| Left middle frontal gyrus | 203 | 3.38 | −34, 50, 20 | |
| Left middle frontal gyrus | 114 | 3.17 | −34, 2, 56 | |
| Right medial superior frontal gyrus | 106 | 3.04 | 12, 56, 0 | |
| Right supramarginal gyrus | 111 | 2.99 | 62, −18, 22 | |
| FH−APOE− asymptomatic participants > MCI | Left inferior parietal lobule | 6950 | 4.32 | −30, −42, 48 |
| Left parahippocampal gyrus | 619 | 4.09 | −18, 2, −28 | |
| Left middle frontal gyrus | 416 | 3.55 | −36, 22, 32 | |
| Left superior frontal gyrus | 304 | 3.35 | −20, 40, 34 | |
| Right middle frontal gyrus | 701 | 3.20 | 28, 42, 32 | |
| Left medial superior frontal gyrus | 209 | 3.06 | 0, 58, 12 | |
| Left medial superior frontal gyrus | 300 | 3.03 | 0, 44, 38 | |
| Right superior frontal gyrus | 462 | 2.96 | 16, 20, 60 | |
| FH−APOE− asymptomatic participants > OCN | Left inferior parietal lobule | 3017 | 4.32 | −36, −46, 38 |
| Right inferior parietal lobule | 891 | 3.87 | 42, −42, 36 | |
| Left superior frontal gyrus | 131 | 3.59 | −16, 4, 60 | |
| Right middle frontal gyrus | 187 | 3.37 | 22, −16, 64 |
CBF = cerebral blood flow; MNI = Montreal Neurological Institute; FH−APOE4− = having neither a FH of AD nor carrying the varepsilon 4 allele of the apolipoprotein E gene; OCN = older cognitively normal adults; aMCI = amnestic mild cognitive impairment; AD = Alzheimer's disease.
Figure 2.

Three-dimension rendering of regional hypoperfusion in the AD (A), MCI (B), and OCN (C) groups compared with the FH−APOE4− asymptomatic participants. The panels demonstrate (i) progressively pervasive parietofrontal hypoperfusion across the AD spectrum, from OCN to AD, and (ii) hippocampal hypoperfusion in the MCI and AD groups but not the OCN group. The coronal inserts to panels A and B display the hippocampal signal in the MCI and AD analyses (blue ellipse in the left medial view). There were no regions of hyperperfusion in the AD, MCI, or OCN groups compared with the FH−APOE4− asymptomatic group. Analyses were adjusted for age, sex, and post-labeling delay. Results were thresholded at Pvoxel <0.005 and minimum of 101 contiguous voxels, based on Monte Carlo simulations (3dClustSim, AFNI, http://afni.nimh.nih.gov). AD = Alzheimer's disease; aMCI = amnestic mild cognitive impairment; OCN = older cognitively normal adults; FH−APOE4− = having neither a FH of AD nor carrying the varepsilon 4 allele of the apolipoprotein E gene.
Family History of AD, APOE4 Status, and Alterations in CBF
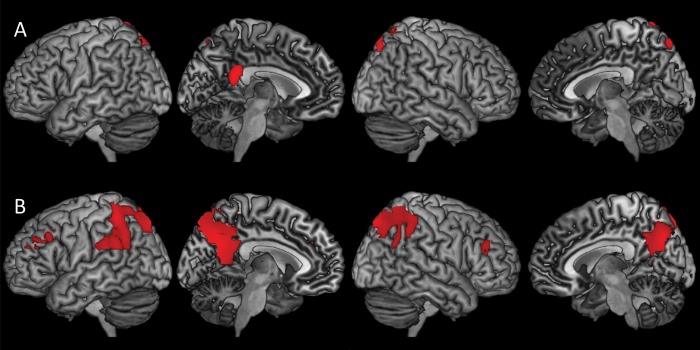
Within the full asymptomatic cohort, FH+ participants showed circumscribed hypoperfusion in the right superior and middle frontal cortices compared with FH− participants. To test for parent-of-origin effects, we performed the following “planned” contrasts: 1) FH− > mFH+, 2) FH− > pFH+, 3) FH− > mpFH+, 4) mFH+ < pFH+, and 5) mFH+ < mpFH+. Contrast 1 revealed perfusion deficits in the mFH+ group relative to the FH− group within several AD-vulnerable regions such as the bilateral hippocampus, right parahippocampal gyrus/amygdala, right supramarginal gyrus, and the superior/middle frontal cortices bilaterally (Fig. 3A). Contrasts 2, 3, and 5 revealed no perfusion differentials at the set threshold. Contrast 4 revealed that, compared with pFH+, mFH+ was associated with hypoperfusion in the left hippocampus and parahippocampal gyrus, bilateral supramarginal gyri and superior frontal cortices, and right middle/medial frontal gyrus (Fig. 3B). These findings are summarized in Table 3. There were no significant findings when the reverse hypotheses were tested (e.g. mFH+ > pFH+).
Figure 3.

Three-dimension rendering of regional hypoperfusion in the mFH+ group compared with the FH− (A) and pFH+ (B) groups. There were no regions of hyperperfusion in the mFH+ group compared with FH− or pFH+ groups. Analyses were adjusted for age, sex, and post-labeling delay. Results were thresholded at Pvoxel <0.005 and minimum of 101 contiguous voxels, based on Monte Carlo simulations (3dClustSim, AFNI, http://afni.nimh.nih.gov). The accompanying bar chart displays the adjusted mean ± standard error CBF value extracted from the hippocampal clusters in the FH− versus mFH+ analysis (blue ellipse in medial views, panel A). It depicts significant hippocampal hypoperfusion in the mFH+ group compared with the FH− and pFH+ groups. CBF = cerebral blood flow; AD = Alzheimer's disease; FH− = negative FH of AD; mFH+ = maternal FH of AD; pFH+ = paternal FH of AD.
Table 3.
Effect of FH of AD on CBF
| Contrast | Anatomical label | Voxels | Peak T-value | MNI x, y, z coordinates |
|---|---|---|---|---|
| FH− > FH+ | Right superior frontal gyrus | 123 | 3.55 | 12, −6, 76 |
| Right superior frontal gyrus | 210 | 2.95 | 32, 54, 32 | |
| FH− > mFH+ | Right superior frontal gyrus | 4161 | 4.18 | 12, −6, 76 |
| Left medial superior frontal gyrus | 109 | 3.58 | −10, 36, 62 | |
| Right hippocampus | 646 | 3.40 | 24, −10, −12 | |
| Left superior frontal gyrus | 139 | 3.35 | −10, −4, 80 | |
| Right supramarginal gyrus | 538 | 3.29 | 54, −34, 24 | |
| Left hippocampus | 181 | 3.25 | −28, −12, −12 | |
| Left middle frontal gyrus | 140 | 3.16 | −48, 28, 42 | |
| FH− > pFH+ | X | X | X | X |
| FH− > mpFH+ | X | X | X | X |
| mFH+ < pFH+ | Left superior frontal gyrus | 270 | 3.52 | −12, 26, 42 |
| Left hippocampus | 960 | 3.40 | −34, −22, −16 | |
| Right middle frontal gyrus | 207 | 3.33 | 28, 28, 30 | |
| Right supramarginal gyrus | 151 | 3.25 | 52, −48, 30 | |
| Right medial superior frontal gyrus | 440 | 3.21 | 12, 50, 18 | |
| Left supramarginal gyrus | 118 | 3.12 | −56, −42, 30 | |
| Right superior frontal gyrus | 101 | 2.79 | 14, 40, 36 | |
| mFH+ < mpFH+ | X | X | X | X |
AD = Alzheimer's disease; CBF = cerebral blood flow; MNI = Montreal Neurological Institute; FH− = negative family history of AD; FH+ = positive family history of AD; mFH+ = maternal family history of AD; pFH+ = paternal family history of AD; mpFH+ = history of AD in both parents; X = no significant group differences.
Cerebral perfusion did not significantly differ between APOE4 carriers and noncarriers. As supplementary analyses, we then explored the additive effect of FH and APOE4 status on CBF by creating the following 4 groups: FH− and APOE4− (FH−APOE4−, n = 59); FH− and APOE4+ (FH−APOE4+, n = 16); FH+ and APOE4− (FH+APOE4−, n = 89); and FH+ and APOE4+ (FH+APOE4+, n = 88). With FH−APOE4− as reference, there was no evidence of hypoperfusion in the FH−APOE4+ or FH+APOE4− groups. In contrast, the FH+APOE4+ group exhibited hypoperfusion in a large cluster comprising the left medial superior frontal gyrus and bilateral superior/middle frontal cortices (voxels = 6069, Tmax = 4.00, Pvoxel < 0.001, x, y, z = −8, 36, 62), in the right supramarginal gyrus/superior parietal lobule (voxels = 316, Tmax = 3.03, Pvoxel = 0.001, x, y, z = 64, −20, 48), and the right hippocampus (voxels = 101, Tmax = 2.99, Pvoxel = 0.002, x, y, z = 20, −8, −12).
Associations Between CBF and Cognition
Within the asymptomatic cohort, we found that scores on 2 cognitive factors—Immediate Memory and Working Memory—were positively correlated with regional CBF. For Immediate Memory, the involved brain regions were the left precuneus and posterior cingulate, and the right superior parietal lobule. For Working Memory, the association was spread over a large cluster involving bilateral precuneus and left posterior cingulate, with additional clusters in the bilateral inferior parietal lobules and middle frontal gyri. No negative associations were detected. These results are shown in Table 4 and displayed in Figure 4.
Table 4.
Correlations between CBF and cognitive function
| Cognitive domain | Anatomical label | Voxels | Peak T-value | MNI x, y, z coordinates |
|---|---|---|---|---|
| Immediate Memory | Left posterior cingulate | 266 | 3.50 | −4, −44, 22 |
| Right superior parietal lobule | 132 | 3.25 | 30, −62, 72 | |
| Left precuneus | 123 | 3.07 | 0, −76, 56 | |
| Working Memory | Left precuneus | 6897 | 4.12 | −2, −64, 30 |
| Left supramarginal gyrus | 254 | 3.24 | −64, −46, 28 | |
| Right middle frontal gyrus | 111 | 3.05 | 34, 34, 22 | |
| Left middle frontal gyrus | 302 | 3.03 | −26, 40, 32 |
CBF = cerebral blood flow; MNI = Montreal Neurological Institute.
Figure 4.
Three-dimension rendering of voxel-wise correlations between CBF and test scores on 2 cognitive domains: Immediate Memory (A) and Working Memory (B) within the asymptomatic cohort. The images show that CBF in the precuneus and posterior cingulate are positively correlated with performance on these cognitive domains. Analyses were adjusted for age, education, and post-labeling delay. Results were thresholded at Pvoxel <0.005 and minimum of 101 contiguous voxels, based on Monte Carlo simulations (3dClustSim, AFNI, http://afni.nimh.nih.gov). CBF = cerebral blood flow.
Sensitivity Analyses
Given the possibility that our CBF findings may have been influenced by group differences in GM volume (i.e. GM atrophy), we performed follow-up “sensitivity analyses” to determine whether and to what extent our initial CBF findings were altered after taking such GM differentials into account. Accordingly, the sensitivity analyses consisted of 2 classes of inquiry. First, we implemented voxel-based morphometry (VBM) routines in SPM8 to assess whether there were, indeed, GM differences among the groups. Secondly, we repeated the initial CBF analyses while additionally adjusting for local GM volume (on a voxel-wise level)—using the biological parametric mapping (BPM) toolbox of SPM (Casanova et al. 2007)—to ascertain the robustness of those initial findings. Both sets of sensitivity analyses (i.e. VBM and BPM) were only performed for the 2 primary analyses of this study—the examination of CBF differences across the AD spectrum and the investigation of parent-of-origin effects on CBF. Methodological details for the VBM and BPM analyses are presented in Supplementary Material.
VBM Results
Compared with the FH−APOE4− group, the AD group showed GM reduction in a large cluster comprising the bilateral precuneus, bilateral posterior cingulate cortex, and the left inferior parietal lobule, as well as in the left amygdala/hippocampus, the right superior/inferior parietal lobules, the right amygdala/hippocampus, and the right inferior parietal lobule. The MCI group exhibited reduced GM volume along the long axis of the left hippocampus, the right amygdala/hippocampus, and the left supramarginal gyrus. The OCN group only had reduced GM volume in a single cluster within the left inferior parietal lobule.
For the parent-of-origin analyses, the FH− > mFH+, FH− > pFH+, and FH− > mpFH+ contrasts did not reveal any GM differentials at the set threshold. The mFH+ group exhibited reduced GM volume in the right precuneus/posterior cingulate relative to the pFH+ group. They also had less GM volume than the mpFH+ group in the right hippocampus/parahippocampal gyrus. These VBM findings are detailed in Supplementary Tables S1 and S2 and illustrated in Supplementary Figures S1 and S2.
BPM Results
Upon voxel-wise adjustment for GM, the AD patients demonstrated hypoperfusion over the entire span of the anatomical mask (i.e. search region) relative to the FH−APOE4− group. Because the structures within the anatomical mask broadly segregate into frontal and temporoparietal regions, the AD analysis yielded 2 vast clusters with respective peaks in the left inferior parietal lobule and the right middle frontal gyrus. Similarly, the MCI patients showed pervasive—albeit comparatively attenuated—hypoperfusion across almost the entire mask, separated into 4 clusters with respective peak effects in the left inferior parietal lobule, the left middle frontal gyrus, the left parahippocampal gyrus, and the right parahippocampal gyrus. The OCN group exhibited hypoperfusion in the left inferior parietal lobule, the right inferior parietal lobule, and the left superior frontal gyrus. In contrast to the MCI and AD groups, the OCN group showed no mesial temporal hypoperfusion when compared with the FH−APOE4− group.
In the parent-of-origin analyses, only the FH− > mFH+ and mFH+ < pFH+ contrasts yielded significant findings. Specifically, the mFH+ group exhibited lower perfusion compared with the FH− group in the right superior frontal cortex, the left medial superior frontal gyrus, the right hippocampus, the right supramarginal gyrus/superior parietal lobule, the left middle frontal cortex, the left hippocampus, and the left superior frontal cortex. The mFH+ group also exhibited lower perfusion compared with the pFH+ group in the left hippocampus/parahippocampal gyrus. The FH− > pFH+, FH− > mpFH+, and mFH+ < mpFH+ contrasts did not reveal any CBF differentials. In summary, the essence of our original CBF findings persisted upon performing “atrophy correction,” suggesting that those initial findings were not primarily driven by GM differentials among the groups. These GM-adjusted CBF findings are presented in Supplementary Tables S3 and S4 and illustrated in Supplementary Figures S3 and S4.
Discussion
In this study, we replicated the existence of a temporoparietofrontal pattern of hypoperfusion among persons with MCI and AD (Johnson et al. 2005; Chen, Wolk, et al. 2011; Musiek et al. 2012). We extended these prior studies by including both a middle-aged and an OCN cohorts, and showing that whereas parietofrontal hypoperfusion is also seen among OCN individuals—and, thus, possibly linked to general cerebral aging—hippocampal hypoperfusion was only evident within the AD and MCI cohorts and, thus, appears specific to the AD process. It is important to note, however, that the perfusion differences between the middle-aged reference group and the OCN group may not be exclusively attributable to aging. Rather, it may reflect a combination of aging, FH of AD, and APOE4 effects given that the middle-aged reference group (i.e., FH−APOE−) differed from the OCN group on all 3 factors.
The key finding from this study, however, is that, among cognitively healthy middle-aged adults, maternal history of AD selectively predisposes to cerebral perfusion deficits. This hypoperfusion was particularly evident in AD-sensitive structures within the mesial temporal lobe and in parietal and frontal heteromodal association cortices. The apparent absence of comparable hypoperfusion among persons with paternal or “bi-parental” history of AD suggests that this phenomenon might be specific to maternally transmitted AD. Furthermore, it is noteworthy that our mFH+ participants exhibited hypoperfusion in the hippocampal region, akin to the MCI and AD groups, whereas the OCN group did not demonstrate such hypoperfusion. This further raises suspicion that the hypoperfusion demonstrated by the mFH+ group might signal incipient AD, although longitudinal observation would be necessary to firmly establish this postulation. We did not observe associations between APOE4 and cerebral perfusion. However, we found evidence for possible FH and APOE4 additivity such that, compared with persons with neither risk factor, persons with both risk factors had diminished perfusion primarily in frontal regions, but also in the supramarginal gyrus and hippocampus (Johnson et al. 2006; Bendlin et al. 2010). When the original CBF analyses were repeated while adjusting for potential differences in GM between the groups, the original pattern of findings persisted, suggesting that the findings were not accounted for by differential GM “atrophy” across the groups.
An accumulation of empirical findings now strongly suggests that, not only is maternal transmission of AD more prevalent than paternal transmission (Bassett et al. 2002; Gomez-Tortosa et al. 2007), but that having an AD-affected mother is preferentially associated with cognitive deterioration in later life (Debette et al. 2009) and a lower and more predictable age of AD onset in the children (Gomez-Tortosa et al. 2007). Although the precise pathophysiological mechanisms by which maternal history of AD affects cognitive function and risk of AD in the offspring have been elusive and remain largely unknown, a series of recent studies has begun to shed light on possible pathways. Mosconi and colleagues reported that, among cognitively normal older adults, having a mother affected with AD was selectively associated with reduced (Mosconi et al. 2007) and progressively diminishing (Mosconi et al. 2009) glucose metabolism, increased aggregation of fibrillar β-amyloid (Mosconi, Rinne, et al. 2010), increased levels of oxidative stress markers (Mosconi, Glodzik, et al. 2010), and reduced platelet mitochondrial cytochrome oxidase activity (Mosconi et al. 2011). Similarly, another research group found that GM volume was reduced (Honea et al. 2010) and progressively atrophied (Honea et al. 2011) in persons with a maternal family history of AD compared with those with either a paternal or no family history of AD. Our study adds to this growing body of knowledge by demonstrating cerebral hypoperfusion in cognitively healthy middle-aged adults at a mean age of 59 years—up to 15 years earlier than the mean age of participants in these other asymptomatic cohorts—as a consequence of having an AD-affected mother. There is currently some evidence to suggest that the genetic basis for maternal transmission of AD is through mitochondrial DNA and associated oxidative damage (Lin and Beal 2006). While this possibility offers exciting biomolecular grounding for the previously reported associations between maternal AD and cerebral hypometabolism (Mosconi et al. 2007, 2009), and now cerebral hypoperfusion, a more comprehensive exploration of this linkage would be beyond the scope of the present study.
Although FDG-PET has demonstrated excellent promise for use in the diagnosis of AD and tracking of disease progression (Jagust et al. 2010), its widespread use has been hampered by several factors including expense, radiation exposure, length of protocol (∼1 h), and perceived invasiveness. Consequently, because of the generally tight coupling of cerebral perfusion to metabolism, there has been considerable interest in determining the extent to which ASL may serve as a viable alternative to FDG-PET, especially because ASL is essentially free of the barriers that have hindered a more universal applicability of FDG-PET (Alsop et al. 2010). In light of this, another important finding from our study is the observation that the pattern of hypoperfusion exhibited by our mFH+ participants is distinctly similar to the pattern of hypometabolism that was attributed to maternal history of AD in an earlier FDG-PET study of cognitively normal elders (Mosconi et al. 2007). In addition, the patterns of hypoperfusion we observed in our MCI and AD cases equally mirrored well-documented patterns of regional hypometabolism in these patient groups (Choo et al. 2007; Li et al. 2008; Chen et al. 2010; Chen, Ayutyanont, et al. 2011). Taken in combination with findings from other studies that have performed more direct comparisons of ASL with FDG-PET (Chen, Wolk, et al. 2011; Musiek et al. 2012), our results provide added validation of the potential role that ASL could play in AD case finding, particularly in the “early identification of persons at risk” for AD. Such early identification would greatly facilitate targeted intervention with disease-modifying therapeutics when such treatments become available.
Within the asymptomatic cohort, we found that regional CBF in 2 cortical midline structures—precuneus and posterior cingulate—were positively associated with performance on cognitive measures of Working Memory and Immediate Memory, with additional contributions from lateral parietal and middle frontal cortices. These effects were mostly left-lateralized though some associations were also found in the right hemisphere. The Immediate Memory composite in our study comprised the first 2 learning trials of the Rey Auditory Verbal Learning Test, a word-list learning task. Therefore, Immediate Memory putatively taps cognitive mechanisms necessary for holding (and manipulating) information in attentional space for a relatively brief period of time, such as controlled-strategic processing (Wolk and Dickerson 2011). The component tests in our Working Memory index are classic cognitive measures that assess online monitoring and manipulation of information. Lesion studies going back several decades have established the critical role that parietofrontal networks play in attention and working memory (Muller and Knight 2006). More recently, experimental task functional MRI (fMRI) studies have consistently shown selective activations in these brain regions when research subjects perform attentional and working memory tasks (Corbetta and Shulman 2002; Champod and Petrides 2007). Our CBF–Cognition findings are, thus, very intriguing because they suggest that, despite the separation in time between the ASL scan and cognitive assessment, blood flow at rest bears a similar relationship with cognition as is observed when the brain is subjected to targeted mental challenges under experimental manipulation. Indeed, there is now increasing appreciation that fMRI task-related activations might be modulated by baseline CBF (D'Esposito et al. 2003; Fleisher et al. 2009).
We observed, with great interest, that when we initially collapsed the mFH+, pFH+, and mpFH+ groups into a FH+ group, we only found rather minimal hypoperfusion in this FH+ group when compared with the FH− group. When we performed the preplanned parent-of-origin analyses, this initial finding was shown to be driven by the lack of perfusion differential in the pFH+ and mpFH+ groups relative to the FH− group. However, we note that the relatively modest size of the mpFH+ group—which likely resulted in reduced power to detect present effects—precludes definitive assertions concerning associations between “conjugal AD” and cerebral perfusion (Jayadev et al. 2008). We have now examined parent-of-origin effects in the WRAP cohort using structural MRI (Okonkwo et al. 2012), diffusion tensor imaging (DTI; Bendlin et al. 2010), and presently ASL. Effects have been observed with DTI and ASL modalities, but not with standard T1 volume (although in the present study, in which our participants are now older than in our prior reports, we found very circumscribed regional GM loss in the mFH+ group compared with the pFH+ and mpFH+ groups). This difference in findings when using DTI/ASL vis-à-vis structural T1 is likely because DTI and ASL are more sensitive during this asymptomatic stage as they measure physiologic processes and may be more direct indicators of neural integrity and function than volumetric imaging. Overall, then, while parent-of-origin effects may not be ubiquitous, our findings and those of other groups (Mosconi et al. 2007; Honea et al. 2010) suggest that they deserve consideration whenever feasible. Finally, although space limitation precluded the presentation of the data, it is worth noting that absolute CBF varied significantly as a function of age, sex, and post-labeling delay in the asymptomatic cohort (with older age, male sex, and longer post-labeling delay being associated with lower CBF), though not among the groups of older persons recruited from the WADRC possibly due to a smaller sample size. All analyses presented in this paper adjusted for these variables, and future ASL studies might similarly wish to take these factors into consideration in their study design and data analyses (Shin et al. 2007; Liu et al. 2011).
We note that an earlier pulsed ASL study (Fleisher et al. 2009) found that cognitively healthy middle-aged adults who were APOE4+ and had a FH of AD (“high-risk group,” n = 13) exhibited increased resting CBF in the hippocampal region compared with cognitively healthy middle-aged adults without either risk factor (“low-risk group,” n = 10). The discordance between this group's finding and our present report may be due to differences in image acquisition (pulsed vs. pseudocontinuous ASL), data analytic methodology (no correction for global perfusion vs. global scaling), and sample size (n = 23 vs. 252). In addition, their high-risk group contained more women (78%) than their low-risk group (50%). As we described above, and as reported in prior studies (Shin et al. 2007; Liu et al. 2011), resting CBF appears to be generally higher in women compared with men. A couple other studies (Alsop et al. 2008; Dai et al. 2009) have also found surprising hyperperfusion in patient groups when compared with age-matched cognitively normal peers. As with the Fleisher study (Fleisher et al. 2009), it is likely that methodological differences across studies account for the disparity in reported findings (e.g. our reference group [FH−APOE4−] was much younger and had no family/genetic risk for AD compared with the reference group in these other 2 clinical studies). We believe that more consistent findings across studies will emerge as the ASL technique further matures and the acquisition/data analytic procedures become better standardized.
In summary, this study adds to the growing empirical literature showing that 1) ASL CBF is sensitive to AD-related brain perfusion changes and holds promise as a noninvasive means of assessing cerebral function in symptomatic and asymptomatic at-risk cohorts, and 2) a history of an AD-affected mother might predispose some cognitively normal individuals to early cerebral alterations and eventual dementia. Although the findings in our asymptomatic cohort may not fully generalize to the general population given the unique characteristics of the cohort (e.g. 70% have a FH of AD), we believe that continued follow-up of the cohort will be of great value and would help determine whether the observed hypoperfusion is related to prospective clinical decline rather than being a stable trait marker. Such associations with future decline would further establish the utility of perfusion deficits as a candidate endophenotype of preclinical AD, particularly in at-risk populations.
Supplementary Material
Supplementary material can be found at: http://www.cercor.oxfordjournals.org/.
Funding
This work was supported by a Veterans Administration Merit Review grant I01CX000165 (S.C.J.); by National Institute on Aging grants AG021155 (to S.C.J.), AG027161 (to M.A.S.), P50 AG033514 (to S.A.), and P50 AG033514-S1 (to O.C.O.); and by a Clinical and Translational Science Award (UL1RR025011) to the University of Wisconsin, Madison. Additionally, portions of this research were supported by facilities and resources at the Geriatric Research Education and Clinical Center (GRECC) of the William S. Middleton Memorial Veterans Hospital, Madison, WI. This is GRECC manuscript # 2012-03.
Supplementary Material
Notes
We gratefully acknowledge the assistance of Caitlin Cleary, BS, and Jennifer Bond, BA, with data collection. In addition, we also acknowledge the support of researchers and staff at the Waisman Center, University of Wisconsin–Madison, where the brain scans took place. Finally, we thank our study participants for their continued dedication. Conflict of Interest: None declared.
References
- Alsop DC. Arterial spin labeling: its time is now. MAGMA. 2012;25:75–77. doi: 10.1007/s10334-012-0309-8. [DOI] [PubMed] [Google Scholar]
- Alsop DC, Casement M, de Bazelaire C, Fong T, Press DZ. Hippocampal hyperperfusion in Alzheimer's disease. Neuroimage. 2008;42:1267–1274. doi: 10.1016/j.neuroimage.2008.06.006. [DOI] [PMC free article] [PubMed] [Google Scholar]
- Alsop DC, Dai W, Grossman M, Detre JA. Arterial spin labeling blood flow MRI: its role in the early characterization of Alzheimer's disease. J Alzheimers Dis. 2010;20:871–880. doi: 10.3233/JAD-2010-091699. [DOI] [PMC free article] [PubMed] [Google Scholar]
- Bangen KJ, Restom K, Liu TT, Wierenga CE, Jak AJ, Salmon DP, Bondi MW. Assessment of Alzheimer's disease risk with functional magnetic resonance imaging: an arterial spin labeling study. J Alzheimers Dis. 2012;31(Suppl 3):559–574. doi: 10.3233/JAD-2012-120292. [DOI] [PMC free article] [PubMed] [Google Scholar]
- Bassett SS, Avramopoulos D, Fallin D. Evidence for parent of origin effect in late-onset Alzheimer disease. Am J Med Genet. 2002;114:679–686. doi: 10.1002/ajmg.10648. [DOI] [PubMed] [Google Scholar]
- Bendlin BB, Ries ML, Canu E, Sodhi A, Lazar M, Alexander AL, Carlsson CM, Sager MA, Asthana S, Johnson SC. White matter is altered with parental family history of Alzheimer's disease. Alzheimers Dement. 2010;6:394–403. doi: 10.1016/j.jalz.2009.11.003. [DOI] [PMC free article] [PubMed] [Google Scholar]
- Casanova R, Srikanth R, Baer A, Laurienti PJ, Burdette JH, Hayasaka S, Flowers L, Wood F, Maldjian JA. Biological parametric mapping: a statistical toolbox for multimodality brain image analysis. Neuroimage. 2007;34:137–143. doi: 10.1016/j.neuroimage.2006.09.011. [DOI] [PMC free article] [PubMed] [Google Scholar]
- Champod AS, Petrides M. Dissociable roles of the posterior parietal and the prefrontal cortex in manipulation and monitoring processes. Proc Natl Acad Sci U S A. 2007;104:14837–14842. doi: 10.1073/pnas.0607101104. [DOI] [PMC free article] [PubMed] [Google Scholar]
- Chao LL, Pa J, Duarte A, Schuff N, Weiner MW, Kramer JH, Miller BL, Freeman KM, Johnson JK. Patterns of cerebral hypoperfusion in amnestic and dysexecutive MCI. Alzheimer Dis Assoc Disord. 2009;23:245–252. doi: 10.1097/WAD.0b013e318199ff46. [DOI] [PMC free article] [PubMed] [Google Scholar]
- Chen K, Ayutyanont N, Langbaum JB, Fleisher AS, Reschke C, Lee W, Liu X, Bandy D, Alexander GE, Thompson PM, et al. Characterizing Alzheimer's disease using a hypometabolic convergence index. Neuroimage. 2011;56:52–60. doi: 10.1016/j.neuroimage.2011.01.049. [DOI] [PMC free article] [PubMed] [Google Scholar]
- Chen K, Langbaum JB, Fleisher AS, Ayutyanont N, Reschke C, Lee W, Liu X, Bandy D, Alexander GE, Thompson PM, et al. Twelve-month metabolic declines in probable Alzheimer's disease and amnestic mild cognitive impairment assessed using an empirically pre-defined statistical region-of-interest: findings from the Alzheimer's disease neuroimaging initiative. Neuroimage. 2010;51:654–664. doi: 10.1016/j.neuroimage.2010.02.064. [DOI] [PMC free article] [PubMed] [Google Scholar]
- Chen Y, Wolk DA, Reddin JS, Korczykowski M, Martinez PM, Musiek ES, Newberg AB, Julin P, Arnold SE, Greenberg JH, et al. Voxel-level comparison of arterial spin-labeled perfusion MRI and FDG-PET in Alzheimer disease. Neurology. 2011;77:1977–1985. doi: 10.1212/WNL.0b013e31823a0ef7. [DOI] [PMC free article] [PubMed] [Google Scholar]
- Choo IH, Lee DY, Youn JC, Jhoo JH, Kim KW, Lee DS, Lee JS, Woo JI. Topographic patterns of brain functional impairment progression according to clinical severity staging in 116 Alzheimer disease patients: FDG-PET study. Alzheimer Dis Assoc Disord. 2007;21:77–84. doi: 10.1097/WAD.0b013e3180687418. [DOI] [PubMed] [Google Scholar]
- Corbetta M, Shulman GL. Control of goal-directed and stimulus-driven attention in the brain. Nat Rev Neurosci. 2002;3:201–215. doi: 10.1038/nrn755. [DOI] [PubMed] [Google Scholar]
- Dai W, Garcia D, de Bazelaire C, Alsop DC. Continuous flow-driven inversion for arterial spin labeling using pulsed radio frequency and gradient fields. Magn Reson Med. 2008;60:1488–1497. doi: 10.1002/mrm.21790. [DOI] [PMC free article] [PubMed] [Google Scholar]
- Dai W, Lopez OL, Carmichael OT, Becker JT, Kuller LH, Gach HM. Mild cognitive impairment and Alzheimer disease: patterns of altered cerebral blood flow at MR imaging. Radiology. 2009;250:856–866. doi: 10.1148/radiol.2503080751. [DOI] [PMC free article] [PubMed] [Google Scholar]
- Debette S, Wolf PA, Beiser A, Au R, Himali JJ, Pikula A, Auerbach S, Decarli C, Seshadri S. Association of parental dementia with cognitive and brain MRI measures in middle-aged adults. Neurology. 2009;73:2071–2078. doi: 10.1212/WNL.0b013e3181c67833. [DOI] [PMC free article] [PubMed] [Google Scholar]
- D'Esposito M, Deouell LY, Gazzaley A. Alterations in the BOLD fMRI signal with ageing and disease: a challenge for neuroimaging. Nat Rev Neurosci. 2003;4:863–872. doi: 10.1038/nrn1246. [DOI] [PubMed] [Google Scholar]
- Donix M, Burggren AC, Suthana NA, Siddarth P, Ekstrom AD, Krupa AK, Jones M, Martin-Harris L, Ercoli LM, Miller KJ, et al. Family history of Alzheimer's disease and hippocampal structure in healthy people. Am J Psychiatry. 2010;167:1399–1406. doi: 10.1176/appi.ajp.2010.09111575. [DOI] [PMC free article] [PubMed] [Google Scholar]
- Dowling NM, Hermann B, La Rue A, Sager MA. Latent structure and factorial invariance of a neuropsychological test battery for the study of preclinical Alzheimer's disease. Neuropsychology. 2010;24:742–756. doi: 10.1037/a0020176. [DOI] [PMC free article] [PubMed] [Google Scholar]
- Filippini N, Ebmeier KP, MacIntosh BJ, Trachtenberg AJ, Frisoni GB, Wilcock GK, Beckmann CF, Smith SM, Matthews PM, Mackay CE. Differential effects of the APOE genotype on brain function across the lifespan. Neuroimage. 2011;54:602–610. doi: 10.1016/j.neuroimage.2010.08.009. [DOI] [PubMed] [Google Scholar]
- Fleisher AS, Podraza KM, Bangen KJ, Taylor C, Sherzai A, Sidhar K, Liu TT, Dale AM, Buxton RB. Cerebral perfusion and oxygenation differences in Alzheimer's disease risk. Neurobiol Aging. 2009;30:1737–1748. doi: 10.1016/j.neurobiolaging.2008.01.012. [DOI] [PMC free article] [PubMed] [Google Scholar]
- Fox PT, Raichle ME. Focal physiological uncoupling of cerebral blood flow and oxidative metabolism during somatosensory stimulation in human subjects. Proc Natl Acad Sci U S A. 1986;83:1140–1144. doi: 10.1073/pnas.83.4.1140. [DOI] [PMC free article] [PubMed] [Google Scholar]
- Garcia DM, Duhamel G, Alsop DC. Efficiency of inversion pulses for background suppressed arterial spin labeling. Magn Reson Med. 2005;54:366–372. doi: 10.1002/mrm.20556. [DOI] [PubMed] [Google Scholar]
- Gevers S, van Osch MJ, Bokkers RP, Kies DA, Teeuwisse WM, Majoie CB, Hendrikse J, Nederveen AJ. Intra- and multicenter reproducibility of pulsed, continuous and pseudo-continuous arterial spin labeling methods for measuring cerebral perfusion. J Cereb Blood Flow Metab. 2011;31:1706–1715. doi: 10.1038/jcbfm.2011.10. [DOI] [PMC free article] [PubMed] [Google Scholar]
- Gomez-Tortosa E, Barquero MS, Baron M, Sainz MJ, Manzano S, Payno M, Ros R, Almaraz C, Gomez-Garre P, Jimenez-Escrig A. Variability of age at onset in siblings with familial Alzheimer disease. Arch Neurol. 2007;64:1743–1748. doi: 10.1001/archneur.64.12.1743. [DOI] [PubMed] [Google Scholar]
- Herholz K, Carter SF, Jones M. Positron emission tomography imaging in dementia. Br J Radiol. 2007;80(Spec No 2):S160–167. doi: 10.1259/bjr/97295129. [DOI] [PubMed] [Google Scholar]
- Honea RA, Swerdlow RH, Vidoni ED, Burns JM. Progressive regional atrophy in normal adults with a maternal history of Alzheimer disease. Neurology. 2011;76:822–829. doi: 10.1212/WNL.0b013e31820e7b74. [DOI] [PMC free article] [PubMed] [Google Scholar]
- Honea RA, Swerdlow RH, Vidoni ED, Goodwin J, Burns JM. Reduced gray matter volume in normal adults with a maternal family history of Alzheimer disease. Neurology. 2010;74:113–120. doi: 10.1212/WNL.0b013e3181c918cb. [DOI] [PMC free article] [PubMed] [Google Scholar]
- Jagust WJ, Bandy D, Chen K, Foster NL, Landau SM, Mathis CA, Price JC, Reiman EM, Skovronsky D, Koeppe RA. The Alzheimer's disease neuroimaging initiative positron emission tomography core. Alzheimers Dement. 2010;6:221–229. doi: 10.1016/j.jalz.2010.03.003. [DOI] [PMC free article] [PubMed] [Google Scholar]
- Jarvik L, LaRue A, Blacker D, Gatz M, Kawas C, McArdle JJ, Morris JC, Mortimer JA, Ringman JM, Ercoli L, et al. Children of persons with Alzheimer disease: what does the future hold? Alzheimer Dis Assoc Disord. 2008;22:6–20. doi: 10.1097/WAD.0b013e31816653ac. [DOI] [PMC free article] [PubMed] [Google Scholar]
- Jayadev S, Steinbart EJ, Chi YY, Kukull WA, Schellenberg GD, Bird TD. Conjugal Alzheimer disease: risk in children when both parents have Alzheimer disease. Arch Neurol. 2008;65:373–378. doi: 10.1001/archneurol.2007.61. [DOI] [PubMed] [Google Scholar]
- Johnson NA, Jahng GH, Weiner MW, Miller BL, Chui HC, Jagust WJ, Gorno-Tempini ML, Schuff N. Pattern of cerebral hypoperfusion in Alzheimer disease and mild cognitive impairment measured with arterial spin-labeling MR imaging: initial experience. Radiology. 2005;234:851–859. doi: 10.1148/radiol.2343040197. [DOI] [PMC free article] [PubMed] [Google Scholar]
- Johnson SC, Schmitz TW, Trivedi MA, Ries ML, Torgerson BM, Carlsson CM, Asthana S, Hermann BP, Sager MA. The influence of Alzheimer disease family history and apolipoprotein E epsilon4 on mesial temporal lobe activation. J Neurosci. 2006;26:6069–6076. doi: 10.1523/JNEUROSCI.0959-06.2006. [DOI] [PMC free article] [PubMed] [Google Scholar]
- Li Y, Rinne JO, Mosconi L, Pirraglia E, Rusinek H, DeSanti S, Kemppainen N, Nagren K, Kim BC, Tsui W, et al. Regional analysis of FDG and PIB-PET images in normal aging, mild cognitive impairment, and Alzheimer's disease. Eur J Nucl Med Mol Imaging. 2008;35:2169–2181. doi: 10.1007/s00259-008-0833-y. [DOI] [PMC free article] [PubMed] [Google Scholar]
- Lin MT, Beal MF. Mitochondrial dysfunction and oxidative stress in neurodegenerative diseases. Nature. 2006;443:787–795. doi: 10.1038/nature05292. [DOI] [PubMed] [Google Scholar]
- Liu Y, Zhu X, Feinberg D, Guenther M, Gregori J, Weiner MW, Schuff N. Arterial spin labeling MRI study of age and gender effects on brain perfusion hemodynamics. Magn Reson Med. 2011;68:912–922. doi: 10.1002/mrm.23286. [DOI] [PubMed] [Google Scholar]
- Maldjian JA, Laurienti PJ, Kraft RA, Burdette JH. An automated method for neuroanatomic and cytoarchitectonic atlas-based interrogation of fMRI data sets. Neuroimage. 2003;19:1233–1239. doi: 10.1016/s1053-8119(03)00169-1. [DOI] [PubMed] [Google Scholar]
- McKhann G, Drachman D, Folstein M, Katzman R, Price D, Stadlan EM. Clinical diagnosis of Alzheimer's disease: report of the NINCDS-ADRDA Work Group under the auspices of Department of Health and Human Services Task Force on Alzheimer's Disease. Neurology. 1984;34:939–944. doi: 10.1212/wnl.34.7.939. [DOI] [PubMed] [Google Scholar]
- Mosconi L, Brys M, Switalski R, Mistur R, Glodzik L, Pirraglia E, Tsui W, De Santi S, de Leon MJ. Maternal family history of Alzheimer's disease predisposes to reduced brain glucose metabolism. Proc Natl Acad Sci U S A. 2007;104:19067–19072. doi: 10.1073/pnas.0705036104. [DOI] [PMC free article] [PubMed] [Google Scholar]
- Mosconi L, de Leon M, Murray J, E L, Lu J, Javier E, McHugh P, Swerdlow RH. Reduced mitochondria cytochrome oxidase activity in adult children of mothers with Alzheimer's disease. J Alzheimers Dis. 2011;27:483–490. doi: 10.3233/JAD-2011-110866. [DOI] [PMC free article] [PubMed] [Google Scholar]
- Mosconi L, Glodzik L, Mistur R, McHugh P, Rich KE, Javier E, Williams S, Pirraglia E, De Santi S, Mehta PD, et al. Oxidative stress and amyloid-beta pathology in normal individuals with a maternal history of Alzheimer's. Biol Psychiatry. 2010;68:913–921. doi: 10.1016/j.biopsych.2010.07.011. [DOI] [PMC free article] [PubMed] [Google Scholar]
- Mosconi L, Mistur R, Switalski R, Brys M, Glodzik L, Rich K, Pirraglia E, Tsui W, De Santi S, de Leon MJ. Declining brain glucose metabolism in normal individuals with a maternal history of Alzheimer disease. Neurology. 2009;72:513–520. doi: 10.1212/01.wnl.0000333247.51383.43. [DOI] [PMC free article] [PubMed] [Google Scholar]
- Mosconi L, Rinne JO, Tsui WH, Berti V, Li Y, Wang H, Murray J, Scheinin N, Nagren K, Williams S, et al. Increased fibrillar amyloid-{beta} burden in normal individuals with a family history of late-onset Alzheimer's. Proc Natl Acad Sci U S A. 2010;107:5949–5954. doi: 10.1073/pnas.0914141107. [DOI] [PMC free article] [PubMed] [Google Scholar]
- Muller NG, Knight RT. The functional neuroanatomy of working memory: contributions of human brain lesion studies. Neuroscience. 2006;139:51–58. doi: 10.1016/j.neuroscience.2005.09.018. [DOI] [PubMed] [Google Scholar]
- Musiek ES, Chen Y, Korczykowski M, Saboury B, Martinez PM, Reddin JS, Alavi A, Kimberg DY, Wolk DA, Julin P, et al. Direct comparison of fluorodeoxyglucose positron emission tomography and arterial spin labeling magnetic resonance imaging in Alzheimer's disease. Alzheimers Dement. 2012;8:51–59. doi: 10.1016/j.jalz.2011.06.003. [DOI] [PMC free article] [PubMed] [Google Scholar]
- Okonkwo OC, Xu G, Dowling NM, Bendlin BB, Larue A, Hermann BP, Koscik R, Jonaitis E, Rowley HA, Carlsson CM, et al. Family history of Alzheimer disease predicts hippocampal atrophy in healthy middle-aged adults. Neurology. 2012;78:1769–1776. doi: 10.1212/WNL.0b013e3182583047. [DOI] [PMC free article] [PubMed] [Google Scholar]
- Petersen RC, Stevens JC, Ganguli M, Tangalos E, Cummings JL, DeKosky ST. Practice parameter: early detection of dementia: mild cognitive impairment (an evidence-based review). Report of the Quality Standards Subcommittee of the American Academy of Neurology. Neurology. 2001;56:1133–1142. doi: 10.1212/wnl.56.9.1133. [DOI] [PubMed] [Google Scholar]
- Sager MA, Hermann B, La Rue A. Middle-aged children of persons with Alzheimer's disease: APOE genotypes and cognitive function in the Wisconsin Registry for Alzheimer's Prevention. J Geriatr Psychiatry Neurol. 2005;18:245–249. doi: 10.1177/0891988705281882. [DOI] [PubMed] [Google Scholar]
- Shin W, Horowitz S, Ragin A, Chen Y, Walker M, Carroll TJ. Quantitative cerebral perfusion using dynamic susceptibility contrast MRI: evaluation of reproducibility and age- and gender-dependence with fully automatic image postprocessing algorithm. Magn Reson Med. 2007;58:1232–1241. doi: 10.1002/mrm.21420. [DOI] [PubMed] [Google Scholar]
- Silverman JM, Ciresi G, Smith CJ, Marin DB, Schnaider-Beeri M. Variability of familial risk of Alzheimer disease across the late life span. Arch Gen Psychiatry. 2005;62:565–573. doi: 10.1001/archpsyc.62.5.565. [DOI] [PubMed] [Google Scholar]
- van Exel E, Eikelenboom P, Comijs H, Frolich M, Smit JH, Stek ML, Scheltens P, Eefsting JE, Westendorp RG. Vascular factors and markers of inflammation in offspring with a parental history of late-onset Alzheimer disease. Arch Gen Psychiatry. 2009;66:1263–1270. doi: 10.1001/archgenpsychiatry.2009.146. [DOI] [PubMed] [Google Scholar]
- Weintraub S, Salmon D, Mercaldo N, Ferris S, Graff-Radford NR, Chui H, Cummings J, DeCarli C, Foster NL, Galasko D, et al. The Alzheimer's Disease Centers’ Uniform Data Set (UDS): the neuropsychologic test battery. Alzheimer Dis Assoc Disord. 2009;23:91–101. doi: 10.1097/WAD.0b013e318191c7dd. [DOI] [PMC free article] [PubMed] [Google Scholar]
- Wolk DA, Dickerson BC. Fractionating verbal episodic memory in Alzheimer's disease. Neuroimage. 2011;54:1530–1539. doi: 10.1016/j.neuroimage.2010.09.005. [DOI] [PMC free article] [PubMed] [Google Scholar]
- Xiong C, Roe CM, Buckles V, Fagan A, Holtzman D, Balota D, Duchek J, Storandt M, Mintun M, Grant E, et al. Role of family history for Alzheimer biomarker abnormalities in the adult children study. Arch Neurol. 2011;68:1313–1319. doi: 10.1001/archneurol.2011.208. [DOI] [PMC free article] [PubMed] [Google Scholar]
- Xu G, Antuono PG, Jones J, Xu Y, Wu G, Ward D, Li SJ. Perfusion fMRI detects deficits in regional CBF during memory-encoding tasks in MCI subjects. Neurology. 2007;69:1650–1656. doi: 10.1212/01.wnl.0000296941.06685.22. [DOI] [PubMed] [Google Scholar]
- Xu G, Rowley HA, Wu G, Alsop DC, Shankaranarayanan A, Dowling M, Christian BT, Oakes TR, Johnson SC. Reliability and precision of pseudo-continuous arterial spin labeling perfusion MRI on 3.0 T and comparison with 15O-water PET in elderly subjects at risk for Alzheimer's disease. NMR Biomed. 2010;23:286–293. doi: 10.1002/nbm.1462. [DOI] [PMC free article] [PubMed] [Google Scholar]
- Ye FQ, Frank JA, Weinberger DR, McLaughlin AC. Noise reduction in 3D perfusion imaging by attenuating the static signal in arterial spin tagging (ASSIST) Magn Reson Med. 2000;44:92–100. doi: 10.1002/1522-2594(200007)44:1<92::aid-mrm14>3.0.co;2-m. [DOI] [PubMed] [Google Scholar]
Associated Data
This section collects any data citations, data availability statements, or supplementary materials included in this article.