

Abstract
We investigated the anti-obesity effect of the aerial part of Artemisia scoparia Waldst. et Kit. (Compositae). An 80 % aqueous EtOH extract of the aerial part inhibited triglyceride (TG) accumulation and the nitric oxide (NO) production activity. A new chromane derivative was isolated from the aerial part of A. scoparia Waldst. et Kit. along with 18 known compounds. The structure of the new chromane, scopariachromane (1), was elucidated by spectroscopic analyses. The inhibitory effects of the compounds on TG accumulation activity were examined. Among these, cirsiliol (11) inhibited TG accumulation in 3T3-L1 preadipocytes. Jaceosidin (12) inhibited NO production in a murine macrophage-like cell line (RAW 264.7). These results indicate that the 80 % aqueous EtOH extract and compounds isolated from the aerial part of A. scoparia Waldst. et Kit. may improve obesity-related insulin resistance.
Keywords: Artemisia scoparia Waldst. et Kit., Chromane, Triglyceride, Nitric oxide
Introduction
Obesity is one of the leading metabolic diseases worldwide [1] and is closely associated with coronary heart disease, hypertension, type 2 diabetes mellitus, cancer, respiratory complications, and osteoarthritis [2]. Obesity is a condition in which adipocytes accumulate a large amount of fat and become enlarged. At the cellular level, this condition is characterized by an increase in the number and size of adipocytes that differentiate from 3T3-L1 preadipocytes in the adipose tissue [3]. Recent studies have demonstrated that the obese adipose tissue is characterized by enhanced macrophage infiltration [4]. Macrophages produce various inflammatory proteins such as tumor necrosis factor alpha (TNF-α), monocyte chemoattractant protein-1 (MCP-1), and nitric oxide (NO), which are implicated in insulin resistance and metabolic disorders [5]. NO is a diffusible, liposoluble, free radical gas produced from l-arginine by a family of enzymes known as inducible NO synthases (iNOS) [6]. In a co-culture system of RAW 264.7 macrophages and 3T3-L1 adipocytes, marked increases in the secretion of inflammatory mediators such as TNF-α, MCP-1, and NO were observed [7]. Triglyceride (TG) is synthesized from glucose and fatty acid that is incorporated by glucose transporter 4 and fatty acid transporter (CD36) into 3T3-L1 preadipocytes [8, 9]. Cultured 3T3-L1 adipocytes have many properties similar to those of normal adipocytes. Thus, this cell line is a suitable model system for obesity-related research [10–12]. Herbal extracts from plants such as Blumea balsamifera [13], Ginkgo biloba [14], Wasabia japonica [15], Zizyphus jujuba [16], Morus alba var. multicaulis [17], and Albizia julibrissin Durazz [18] have been shown to possess anti-obesity effects. Thus, we aimed to screen for crude drugs and natural products with inhibitory effects on TG accumulation in adipocytes and NO production in activated macrophages.
Artemisia scoparia Waldst. et Kit. belongs to the family Compositae and is native to Japan, Korea, and Mongolia. The aerial part of this plant is used in traditional medicine as an antiphlogistic, as a diuretic, for the treatment of hepatitis and urticaria, and as an antimold agent. Phytochemical investigations of the aerial part of A. scoparia Waldst. et Kit. resulted in the isolation of flavonoids, coumarins, and essential oils [19].
In the present study, we found that an 80 % aqueous EtOH extract of A. scoparia Waldst. et Kit. inhibited TG accumulation [22.5 % (30 μg/mL)] in 3T3-L1 adipocytes and NO production [24.3 % (30 μg/mL)] by RAW 264.7, which were activated by lipopolysaccharide (LPS) and recombinant mouse interferon gamma (IFN-γ).
Therefore, we analyzed A. scoparia Waldst. et Kit. to identify the active compounds in the extract. Through bioactivity-guided fractionation, we identified a new chromane derivative, scopariachromane (1), and 18 known compounds from the aerial part of A. scoparia Waldst. et Kit. Herein, we describe the structural elucidation and biological evaluation of these compounds.
Results and discussion
The aerial parts of A. scoparia Waldst. et Kit. were extracted with 80 % aqueous EtOH. The 80 % aqueous EtOH extract was suspended in H2O and partitioned with n-hexane, CHCl3, EtOAc, and n-BuOH, successively. The CHCl3 and EtOAc layers showed inhibitory effects on TG accumulation [41.9 and 10.4 %, respectively (30 μg/mL)] and NO production [55.4 and 33.1 %, respectively (10 μg/mL)]. Bioassay-directed fractionation led to the isolation of a new chromane derivative, named scopariachromane, together with 18 known compounds (2–19) (Fig. 1).
Fig. 1.
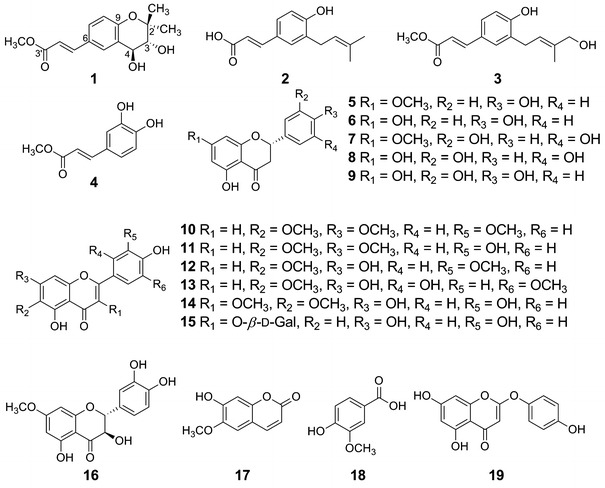
Structures of compounds isolated from Artemisia scoparia Waldst. et Kit
Scopariachromane (1) was isolated as an amorphous colorless powder, and its molecular formula was determined as C15H18O5 by HR-EI-MS, with seven degrees of unsaturation. The UV spectrum of 1 showed absorption at 295 and 232 nm, and its IR spectrum showed the characteristic absorption bands of hydroxyl groups (3420 cm−1), a conjugated carbonyl group (1694 cm−1), and conjugated double bonds (1633 and 1609 cm−1). The 1H NMR chemical shifts of 1 (Table 1) indicated the presence of a 1,2,4-trisubstituted aromatic ring at δ H 7.74 (1H, d, J = 1.8 Hz, H-5), δ H 7.47 (1H, dd, J = 8.7, 1.8 Hz, H-7), and δ H 6.76 (1H, d, J = 8.7 Hz, H-8); a trans-olefin at δ H 7.60 (1H, d, J = 15.9 Hz, H-1′) and δ H 6.36 (1H, d, J = 15.9 Hz, H-2′); a methoxy proton at δ H 3.72 (3H, s, OCH3-3′); and two methyl at δ H 1.45 (3H, s, H-2a) and δ H 1.22 (3H, s, H-2b). Analysis of the 13C NMR (Table 1) and DEPT spectra revealed the presence of one carbonyl group, one methoxy group, two methyls, seven methines, and five quaternary carbons. All protonated carbons were assigned by HMQC analysis. Furthermore, the 1H–1H COSY (Fig. 2) spectrum indicated connectivity between methine protons at δ H 4.55 (H-4) and δ H 3.56 (H-3), H-1′ and H-2′, respectively. HMBC analysis of 1 (Fig. 2) showed long-range correlations between H-4 and δ C 79.8 (C-2) and δ C 75.9 (C-3); H-3 and C-2, δ C 27.1 (C-2a) and δ C 19.7 (C-2b); H-2b and C-2, and C-3; and H-2a and C-2, and C-3, which indicated the presence of a prenyl-type unit. Furthermore, H-5 and δ C 126.1 (C-10) and δ C 69.1 (C-4); H-4 and δ C 129.2 (C-5) and C-10; and H-3 and C-10 indicated that the prenyl-type unit was located on C-4. The degree of unsaturation at seven also indicated that the prenyl-type unit participated in a cyclic structure. The NOESY spectrum of 1 (Fig. 3) showed correlations between H-2a and H-3, and H-2b and H-4. These results suggested a quasi-trans axial. The coupling constant between H-3 and H-4 (J = 8.7 Hz) indicated that these protons were trans diaxial. This analysis and a comparison with published data indicated that 1 was a (3R*,4S*)-3,4-dihydroxy-2,2-dimethyl-chroman derivative [20]. In addition, HMBC correlations between H-5 and C-1′; H-2′ and δ C 167.2 (C-3′); H-2′ and δ C 127.1 (C-6); and δ H 3.72 (OCH3-3′) and C-3′ were observed. Thus, the relative structure of 1 was determined to be scopariachromane.
Table 1.
1H (300 MHz) and13C NMR (75 MHz) data for compound 1 (acetone-d 6 with TMS as the internal standard)
| Position | 1 | |
|---|---|---|
| δ C | δ H | |
| 2 | 79.8 | |
| 2a | 27.1 | 1.45 (3H, s) |
| 2b | 19.7 | 1.22 (3H, s) |
| 3 | 75.9 | 3.56 (1H, d, J = 8.7) |
| 4 | 69.1 | 4.55 (1H, d, J = 8.7) |
| 5 | 129.2 | 7.74 (1H, d, J = 1.8) |
| 6 | 127.1 | |
| 7 | 129.0 | 7.47 (1H, d, J = 8.7, 1.8) |
| 8 | 117.7 | 6.76 (1H, d, J = 8.7) |
| 9 | 154.9 | |
| 10 | 126.1 | |
| 1′ | 144.8 | 7.60 (1H, d, J = 15.9) |
| 2′ | 115.4 | 6.36 (1H, d, J = 15.9) |
| 3′ | 167.2 | |
| OCH3 | 54.4 | 3.72 (3H, s) |
Chemical shifts are given in ppm; coupling constants J (in parentheses) are given in Hz
Fig. 2.
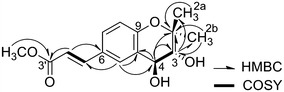
Key COSY and HMBC correlations for 1
Fig. 3.
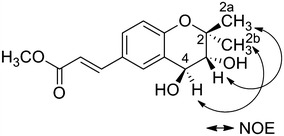
Key NOE correlations for 1
The known isolated compounds were readily identified by comparison of physical and spectral data with published values. These compounds included three p-coumaric acid derivatives, drupanin (2) [21], methyl 3-[4′-hydroxyprenyl]coumarate (3) [22], and methyl 1-(3′,4′-dihydroxyphenyl)propenoate (4) [23]; five flavanes, sakuranetin (5) [24], naringenin (6) [25], blumeatin (7) [26], 3′,5,5′,7-tetrahydroxyflavanone (8) [26], and eriodictyol (9) [27]; four flavones, cirsilineol (10) [28], cirsiliol (11) [28], jaceosidin (12) [29], and 5,7,2′,4′-tetrahydroxy-6,5′-dimethoxyflavone (13) [30]; two flavonols, axillarin (14) [31] and hyperin (15) [32]; a flavanonol, 7-methoxytaxifolin (16) [33]; a coumarin, scopoletin (17) [34]; a benzoic acid derivative, vanillic acid (18) [35]; and a chromone derivative, 6-demethoxycapillarisin (19) [36]. Compounds 2, 3, 5–9, 13, 14–16, and 18 were isolated for the first time from the aerial part of A. scoparia Waldst. et Kit.
The isolated compounds were evaluated for their inhibitory effects against intracellular TG accumulation in 3T3-L1 cells. To determine their nontoxic concentrations, 3T3-L1 cells were treated with various concentrations (3–100 μM) of 1–19, and the cell viability was measured by 3-(4,5-dimethylthiazol-2-yl)-2,5-diphenyltetrazolium bromide (MTT) assay. None of the compounds were cytotoxic at concentrations up to 30 μM. Thus, we used a concentration of at most 30 μM. TG measurements were corrected for the amount of DNA. Quercetin, which has been reported to have inhibitory effects on TG accumulation, was used as a positive control [37]. Treatment with 7, 10, 11, and 16 (30 μM) inhibited TG accumulation (Table 2). In particular, 11 potently inhibited intracellular TG accumulation. Compared with 10, 11 showed a stronger inhibitory effect on TG accumulation. These results suggest that the presence of a hydroxy group at C-3′ could be important. We also examined the effects of 7, 10, 11, and 16 on the uptake of [1-3H]-2-deoxy-d-glucose (Table 3). TG is synthesized from glucose and fatty acid that are incorporated by glucose transporter 4 and fatty acid transporter CD36 [8, 38]. These compounds inhibited glucose uptake for TG synthesis in 3T3-L1 adipocytes. In addition, we have examined the inhibitory effects of 1–19 on NO production in RAW 264.7 cells. As shown in Table 4, compounds 1–14, 16, 17, and 19 showed inhibitory activity. These compounds did not have cytotoxic effects (10–30 μM). In the assay, aminoguanidine (IC50 17.5 μM), which has been reported to have inhibitory effects on NO production in LPS-activated RAW 264.7 macrophages via the downregulation of iNOS, was used as a positive control [39]. Compounds 4, 5, 7–11, 12–14, 16, and 17 showed strong or moderate inhibitory effects on NO production compared with aminoguanidine (Table 4). Of the 19 compounds tested, compound 12 exhibited the highest inhibitory activity against NO production (IC50 5.9 μM).
Table 2.
Effects of compounds 1–19 on TG accumulation in cultured 3T3-L1 adipocytes
| Inhibition (%) | Inhibition (%) | ||
|---|---|---|---|
| 1 | 5.9 ± 3.0 | 11 | 77.0 ± 0.9** |
| 2 | 7.1 ± 3.2 | 12 | 20.1 ± 14.3 |
| 3 | −1.5 ± 5.0 | 13 | 4.0 ± 3.0 |
| 4 | 5.7 ± 7.1 | 14 | 19.1 ± 0.9 |
| 5 | 13.2 ± 3.6 | 15 | −10.6 ± 4.2 |
| 6 | 2.6 ± 11.0 | 16 | 49.8 ± 9.6* |
| 7 | 38.9 ± 3.1* | 17 | 18.5 ± 1.3 |
| 8 | −2.4 ± 4.0 | 18 | −37.8 ± 6.1 |
| 9 | −10.5 ± 3.0 | 19 | −8.8 ± 3.6 |
| 10 | 37.2 ± 3.7* | Quercetin | 38.4 ± 3.4 |
Cells were treated with compounds 1–19 (30 μM) on days 0 and 3. On day 8, the intracellular TG content of the cells was measured
Results are expressed as mean ± SE of 3 individual experiments
*p < 0.05, **p < 0.01 vs. control (Student’s t test)
Table 3.
Effect of compounds 7, 10, 11, and 16 on glucose uptake in 3T3-L1 cells
| Inhibition (%) | Inhibition (%) | ||
|---|---|---|---|
| 7 | 44.4 ± 3.2* | 16 | 19.8 ± 3.2 |
| 10 | 67.4 ± 1.3** | Quercetin | 20.3 ± 1.7 |
| 11 | 63.1 ± 0.2** |
After cell differentiation, the medium was replaced with serum-free DMEM for 2 h, and the cells were washed and incubated in KRH buffer containing insulin (200 nM) for 10 min. After exposure to insulin, they were treated with samples in KRH buffer for 15 min. After incubation, [1-3H]-2-deoxy-d-glucose (0.25 μCi/mL) was added, and incubation was continued for 10 min. The cells were solubilized in 0.1 % SDS. The incorporated radioactivity was measured by liquid scintillation counting
Results are expressed as the mean ± SE of 3 individual experiments
*p < 0.05, **p < 0.01 vs. control (Student’s t test)
Table 4.
Inhibitory effects of the isolated compounds 1–19 on NO production stimulated by LPS and IFN-γ in RAW 264.7 cells
| IC50 (μM) | IC50 (μM) | ||
|---|---|---|---|
| 1 | 73.7 | 11 | 18.0 |
| 2 | 46.4 | 12 | 5.9 |
| 3 | 41.2 | 13 | 13.0 |
| 4 | 21.1 | 14 | 23.1 |
| 5 | 25.1 | 15 | >100 |
| 6 | 55.2 | 16 | 13.7 |
| 7 | 20.6 | 17 | 21.1 |
| 8 | 25.7 | 18 | >100 |
| 9 | 27.3 | 19 | 38.2 |
| 10 | 13.1 | Aminoguanidine | 17.5 |
In brief, the results presented here showed that an 80 % aqueous EtOH extract of the aerial part of A. scoparia Waldst. et Kit. and the isolated compounds may be used to reduce obesity, which is a serious health problem in industrialized countries, by inhibiting NO production by activated macrophages, and intracellular TG accumulation and glucose uptake in mature adipocytes.
Experimental
General experimental procedure
Optical rotation (OR) was measured in MeOH using a JASCO P-1020 polarimeter. The UV spectra were obtained in MeOH using a JASCO V-550 spectrophotometer, and the IR spectra were recorded using a JASCO IR A-2 spectrophotometer. The NMR spectra were recorded using a JEOL ECX-500 spectrometer (1H NMR, 500 MHz; 13C NMR, 125 MHz), with TMS as an internal standard. Mass spectra were obtained using a JEOL GCmate spectrometer. Silica gel 60 N (Kanto Chemical Corp.), YMC GEL ODS-A (YMC Co. Ltd.), and Sephadex LH-20 (GE Healthcare) were used for column chromatography (CC). TLC was performed using TLC plates (thickness 0.25 mm, F254; Merck), and compounds were visualized by spraying with 5 % (v/v) H2SO4 in EtOH and vanillin reagent. HPLC was performed using a JASCO PU-1580 apparatus equipped with a JASCO UV-1575 detector and a Shodex OR-2 OR detector. Cosmosil 5C18-MS-II (10 × 250 mm i. d. and 4.6 × 250 mm i. d.; Nacalai Tesque), Cosmosil Cholester (10 × 250 mm i. d.; Nacalai Tesque), and Cosmosil π nap (10 × 250 mm i. d.; Nacalai tesque) were used for preparative purposes.
Plant materials
The aerial part of A. scoparia Waldst. et Kit. was collected from Inner Mongolia during 2003. An authentic specimen of this plant was deposited in the Laboratory of Pharmacognosy, School of Pharmacy, Nihon University, Japan (NK-03040).
Extraction and isolation
The aerial part of Artemisia scoparia Waldst. et Kit. (5 kg) was extracted 3 times with 80 % aqueous EtOH. Evaporation of the solvent under reduced pressure from the combined extract afforded the EtOH extract (265 g). The extract was suspended in H2O (1:1, v/v) and partitioned with n-hexane (4 × 1:1, v/v), CHCl3 (4 × 1:1, v/v), EtOAc (4 × 1:1, v/v), and n-BuOH (4 × 1:1, v/v), successively. The amounts extracted were 0.543, 4.43, 30.0, and 56.6 g, respectively, and the residual aqueous extract yielded 135.1 g of material. The CHCl3 extract was subjected to silica gel CC, [n-hexane/EtOAc (100:0 → 0:100, v/v)] to yield Fr. C-1–C-16. Fr. C-5 (409 mg) was purified by reversed-phase HPLC with H2O/MeOH (70:30, v/v) to yield 5 (93.6 mg). 7 (44 mg) was crystallized from Fr. C-7 (559 mg) using MeOH. Fr. C-8 (213 mg) was purified by reversed-phase HPLC with H2O/MeOH (43:57, v/v) to yield 2 (2.5 mg).
Fr. C-9 (624 mg) was subjected to ODS CC [H2O/MeOH (90:10 → 0:100, v/v)] to yield Fr. C-9-1–C-9-5. Fr. C-9-2 (416 mg) was purified by reversed-phase HPLC with H2O/MeOH (65:35, v/v) to yield 3 (96 mg), and 12 (9.0 mg). Fr. C-10 was purified by reversed-phase HPLC with H2O/MeOH (35:65, v/v) to yield 1 (7.6 mg), 10 (4.0 mg), and 17 (8.6 mg). The EtOAc extract was subjected to silica gel CC [CHCl3/MeOH (100:0 → 0:100, v/v)] to yield Fr. E-1–E-5. Fr. E-2 (2463 mg) was subjected to ODS CC [H2O/MeOH (90:10 → 0:100, v/v)] to yield Fr. E-2-1–E-2-6. Fr. E-2-1 (329.1 mg) was subjected to Sephadex LH-20 CC [H2O–MeOH (50:50, v/v)] to yield Fr. E-2-1-1–E-2-1-3. Fr. 2-1-2 (28.9 mg) was purified by reversed-phase HPLC with H2O/MeOH (50:50, v/v) to yield 18 (7.7 mg). Fr. E-2-3 (845 mg) was purified by reversed-phase HPLC with H2O/CH3CN (60:40, v/v) to yield 4 (96 mg), 6 (29.3 mg), 8 (15.8 mg), 11 (40.7 mg), 13 (12.3 mg), 16 (39.7 mg), and 19 (12.9 mg). Fr. E-3 (2781 mg) was subjected to ODS CC [H2O/MeOH (90:10 → 0:100, v/v)] to yield Fr. E-3-1–E-3-5. Fr. E-3-3 (518 mg) was purified by reversed-phase HPLC with H2O/CH3CN (60:40, v/v) to yield 9 (98.1 mg). Fr. E-3-4 (701 mg) was subjected to Sephadex LH-20 CC [H2O/MeOH (20:80, v/v)] to yield Fr. E-3-4-1–E-3-4-12. Fr. E-3-4-7 (26.8 mg) was purified by reversed-phase HPLC with H2O/CH3CN (60:40, v/v) to yield 14 (3.8 mg). Fr. E-5 (9206.2 mg) was subjected to ODS CC [H2O/MeOH (90:10 → 0:100, v/v)] to yield Fr. E-5-1–E-5-7. Fr. E-5-4 (1557 mg) was purified by reversed-phase HPLC with H2O/CH3CN (10:90, v/v) to yield Fr. E-5-4-1–E-5-4-3. 15 (47.7 mg) was crystallized from Fr. E-5-4-2 (370.9 mg) using MeOH.
Scopariachromane (1): amorphous colorless powder. –40.3° (c = 1.0, MeOH). UV λ max (MeOH) nm (log ε): 215 (4.00), 232 (3.99), 295 (4.03). IR (KBr) ν max cm−1: 3420 (OH), 1694 (conj. C=O), 1633 (conj. C=C). EI-MS m/z: 232 [M]+. HR-EI-MS m/z: 278.1153 (calcd for C15H18O5, 278.1154). The 1H and 13C NMR spectral data for 1 are presented in Table 1.
Nitrite assay
The cells were seeded at 1.2 × 10⁶ cells/mL onto 96-well flat-bottom plates (Sumitomo Bakelite) and incubated at 37 °C for 2 h. The test sample was then added to the culture simultaneously with Escherichia coli LPS (100 ng/mL) and recombinant mouse IFN-γ (0.33 ng/mL), and the cells were incubated at 37 °C, usually for 16 h. After incubation, the cells were chilled on ice. The culture supernatant (100 μL) was placed in wells in duplicate 96-well flat-bottom plates. A standard solution of NaNO2 was also placed in other wells on the same plates. To quantify nitrite, 50 μL Griess reagent, 1 % sulfanilamide in 5 % H3PO4, and 0.1 % N-(1-naphthyl)ethylenediamide dihydrochloride were added to each well. After 10 min, the reaction products were colorimetrically quantified at 550 nm with subtraction of the background absorbance at 630 nm, using a model 3550 microplate reader (BIO-RAD).
TG assay
3T3-L1 preadipocytes (American Type Culture Collection) were plated in 24-well plates and maintained in DMEM supplemented with 10 % (v/v) fetal calf serum (FCS) and 1 % (v/v) penicillin–streptomycin at 37 °C in a humidified 5 % CO2 incubator. To induce differentiation, 3-day postconfluent 3T3-L1 preadipocytes (day 0) were stimulated by adipogenic agents (500 μM 3-isobutyl-1-methylxanthine, 1 μM dexamethasone, and 10 μg/mL insulin) that were added to DMEM with 10 % (v/v) fetal bovine serum (FBS) culture medium. After 3 days, the medium was replaced with DMEM containing 10 % (v/v) FBS and 5 μg/mL insulin, and it was subsequently replaced every 3 days. The cells were harvested 8 days after the initiation of differentiation. The cells were washed with PBS (−), scraped on ice in 500 μL of sonication buffer (25 mM Tris buffer and 1 mM EDTA; pH 7.5), and sonicated to homogenize the cell suspension. The total TG content of the cells was determined using the LabAssay™ triglyceride kit (Wako Pure Chemical Industries, Ltd., Osaka, Japan). The DNA concentration was determined using the DNA quantity kit (Primary Cell Co., Ltd., Sapporo, Japan). The TG concentration per microgram of DNA in 3T3-L1 cells was expressed as the ratio (%) relative to the control value. The test sample dissolved in DMSO was added.
Glucose uptake assay
3T3-L1 adipocytes were harvested 8 days after the initiation of differentiation. After the differentiation, the medium was replaced with serum-free DMEM for 2 h, and the cells were then washed and incubated in KRH buffer (25 mM HEPES, 120 mM NaCl, 5 mM KCl, 1.2 mM KH2PO4, 1 mM CaCl2, 1 mM MgSO4; pH 7.4) containing insulin (200 nM) for 10 min at 37 °C. After exposure to insulin, the cells were washed and treated with samples in KRH buffer for 15 min. After incubation, [1-3H]-2-deoxy-d-glucose (0.25 μCi/mL) was added, and incubation was continued for 10 min. The cells were washed twice with ice-cold KRH buffer and then solubilized with 0.1 % SDS. The incorporated radioactivity was measured by liquid scintillation counting. Nonspecific uptake was determined in the presence of 20 μM cytochalasin B and was subtracted from the total value. The test sample dissolved in DMSO was added.
Cell viability assay
Cell viability was assessed using MTT. The 3T3-L1 cells (1.0 × 10⁵ cells/mL) were seeded in 96-well plates and incubated for 24 h at 5 % CO2 and 37 °C and then treated with samples. After 24 h of incubation, 20 μL of MTT solution (1 mg/mL) was added to the cell culture, and the cells were further incubated at 37 °C and 5 % CO2 for 4 h. After removing the medium, the MTT formazan crystals were dissolved in DMSO, following which the absorbance in individual wells was determined at 570 nm using a microplate reader and the background absorbance (655 nm) was subtracted. The test sample dissolved in DMSO was added.
Acknowledgments
This work was supported in part by the Grant-in-Aid for Scientific Research from the Ministry of Education, Culture, Sports, Science and Technology (MEXT) of Japan (no. 24590028), and by the Nihon University Multidisciplinary Research Grant (#12-021).
References
- 1.Formiguera X, Canton A. Obesity: epidemiology and clinical aspects. Best Pract Res Clin Gastroenterol. 2004;18:1125–1146. doi: 10.1016/j.bpg.2004.06.030. [DOI] [PubMed] [Google Scholar]
- 2.Kopelman PG. Obesity as a medical problem. Nature. 2000;404:635–643. doi: 10.1038/35007508. [DOI] [PubMed] [Google Scholar]
- 3.Furuyashiki T, Nagayasu H, Aoki Y, Bessho H, Hashimoto T, Kanazawa K, Ashida H. Tea catechin suppresses adipocyte differentiation accompanied by down-regulation of PPARgamma2 and C/EBPalpha in 3T3-L1 cells. Biosci Biotechnol Biochem. 2004;68:2353–2359. doi: 10.1271/bbb.68.2353. [DOI] [PubMed] [Google Scholar]
- 4.Weisberg SP, McCann D, Desai M, Rosenbaum M, Leibel RL, Ferrante AW. Obesity is associated with macrophage accumulation in adipose tissue. J Clin Invest. 2003;112:1796–1808. doi: 10.1172/JCI200319246. [DOI] [PMC free article] [PubMed] [Google Scholar]
- 5.Engeli S, Boschmann M, Admas F, Franke G, Gorzelniak K, Janke J, Luft FC, Jordan J. Dissociation between adipose nitric oxide synthase expression and tissue metabolism. J Clin Endocrinol Metab. 2007;92:2706–2711. doi: 10.1210/jc.2007-0234. [DOI] [PubMed] [Google Scholar]
- 6.Alderton WK, Cooper CE, Knowles RG. Nitric oxide synthases: structure, function and inhibition. Biochem J. 2001;357:593–615. doi: 10.1042/0264-6021:3570593. [DOI] [PMC free article] [PubMed] [Google Scholar]
- 7.Hirai S, Kim YII, Goto T, Kang MS, Yoshimura M, Obata A, Yu R, Kawada T. Inhibitory effect of naringenin chalcone on inflammatory changes in the interaction between adipocytes and macrophages. Life Sci. 2007;81:1272–1279. doi: 10.1016/j.lfs.2007.09.001. [DOI] [PubMed] [Google Scholar]
- 8.Saltiel AR, Kahn CR. Insulin signaling and the regulation of glucose and lipid metabolism. Nature. 2001;414:799–806. doi: 10.1038/414799a. [DOI] [PubMed] [Google Scholar]
- 9.Bell RM, Coleman RA. Enzymes of glycerolipid synthesis in eukaryotes. Ann Rev Biochem. 1980;49:459–487. doi: 10.1146/annurev.bi.49.070180.002331. [DOI] [PubMed] [Google Scholar]
- 10.Yao Y, Li XB, Zhao W, Zeng YY, Shen H, Xiang H, Xiao H. Anti-obesity effect of an isoflavone fatty acid ester on obese mice induced by high fat diet and its potential mechanism. Lipids Health Dis. 2010;9:49–60. doi: 10.1186/1476-511X-9-49. [DOI] [PMC free article] [PubMed] [Google Scholar]
- 11.Ohkura K, Mori M, Terada H, Makino S. Stimulation of insulin action and stabilization of cell membrane in 3T3-L1 cells by glycinin acidic subunit A1a. Biosci Biotechol Biochem. 1995;59:1485–1488. doi: 10.1271/bbb.59.1485. [DOI] [PubMed] [Google Scholar]
- 12.Sul HS, Smas CM, Wang D, Li C. Regulation of fat synthesis and adipose differentiation. Prog Nucleic Acid Res Mol Biol. 1998;60:317–345. doi: 10.1016/S0079-6603(08)60896-X. [DOI] [PubMed] [Google Scholar]
- 13.Kubota H, Kojima-Yuasa A, Morii R, Huang X, Norikura T, Rho SN, Matsui-Yuasa I. Anti-obesity effect of Blumea balsamifera extract in 3T3-L1 preadipocytes and adipocytes. Am J Chin Med. 2009;37:843–854. doi: 10.1142/S0192415X09007326. [DOI] [PubMed] [Google Scholar]
- 14.Dell′Agli M, Bosisio E. Biflavones of Ginkgo biloba stimulate lipolysis in 3T3-L1 adipocytes. Planta Med. 2002;68:76–79. doi: 10.1055/s-2002-19876. [DOI] [PubMed] [Google Scholar]
- 15.Ogawa T, Tabata H, Katsube T, Yukari-Ohta Y, Yamasaki Y, Yamasaki M, Shiwaku K. Suppressive effect of hot water extract of wasabi (Wasabia japonica Matsum.) leaves on the differentiation of 3T3-L1 preadipocytes. Food Chem. 2010;118:239–244. doi: 10.1016/j.foodchem.2009.04.113. [DOI] [Google Scholar]
- 16.Kubota H, Morii R, Kojima-Yuasa A, Huang X, Yano Y, Matsui-Yuasa I. Effect of Zizyphus jujuba extract on the inhibition of adipogenesis in 3T3-L1 preadipocytes. Am J Chin Med. 2009;37:597–608. doi: 10.1142/S0192415X09007089. [DOI] [PubMed] [Google Scholar]
- 17.Yang ZG, Matsuzaki K, Takamatsu S, Kitanaka S. Inhibitory effects of constituents from Morus alba var. multicaulis on differentiation of 3T3-L1 cells and nitric oxide production in RAW264.7 cells. Molecules. 2011;16:6010–6022. doi: 10.3390/molecules16076010. [DOI] [PMC free article] [PubMed] [Google Scholar]
- 18.Yahagi T, Daikonya A, Kitanaka S. Flavonol acylglycosides from flower of Albizia julibrissin and their inhibitory effects on lipid accumulation in 3T3-L1 cells. Chem Pharm Bull. 2012;60:129–136. doi: 10.1248/cpb.60.129. [DOI] [PubMed] [Google Scholar]
- 19.Hu X, Zhang WK, Zhu QS (1999) Zhong Hua Ben Cao. Shanghai Scientific and Technical Publishers, Shanghai, vol 7, p 687
- 20.Boyd DR, Sharma ND, Boyle R, Evans TA, Malone JF, McCombe KM, Dalton H, Chima J. Chemical and enzyme-catalysed syntheses of enantiopure epoxide and diol derivatives of chromene, 2,2-dimethylchromene, and 7-methoxy-2,2-dimethylchromene (precocene-1) J Chem Soc Perkin Trans. 1996;1:1757–1765. doi: 10.1039/p19960001757. [DOI] [Google Scholar]
- 21.Uto Y, Ae S, Koyama D, Sakakibara M, Otomo N, Otsuki M, Nagasawa H, Kirik LK, Hori H. Artepillin C isoprenomics: design and synthesis of artepillin C isoprene analogues as lipid peroxidation inhibitor having low mitochondrial toxicity. Bioorg Med Chem. 2006;14:5721–5728. doi: 10.1016/j.bmc.2006.04.015. [DOI] [PubMed] [Google Scholar]
- 22.Jakupovic J, Tan RX, Bohlmann F, Jia ZJ, Huneck S. Prenylated coumarates from Artemisia xanthochroa. Phytochemistry. 1990;29:3683–3685. doi: 10.1016/0031-9422(90)85307-2. [DOI] [Google Scholar]
- 23.Uwai K, Osanai Y, Imaizumi T, Kanno S, Takeshita M, Ishikawa M. Inhibitory effect of the alkyl side chain of caffeic acid analogues on lipopolysaccharide-induced nitric oxide production in RAW264.7 macrophages. Bioorg Med Chem. 2008;16:7795–7803. doi: 10.1016/j.bmc.2008.07.006. [DOI] [PubMed] [Google Scholar]
- 24.Ibrahim ARS, Galal AM, Ahmed MS, Mossa GS. O-demethylation and sulfation of 7-methoxylated flavanones by Cunninghamella elegans. Chem Pharm Bull. 2003;51:203–206. doi: 10.1248/cpb.51.203. [DOI] [PubMed] [Google Scholar]
- 25.Jeon SH, Chun W, Choi YJ, Kwon YS. Cytotoxic constituents from the bark of Salix hulteni. Arch Pharm Res. 2008;31:978–982. doi: 10.1007/s12272-001-1255-9. [DOI] [PubMed] [Google Scholar]
- 26.Nessa F, Ismail Z, Mohamed N, Mas Rosemal Hakim MH. Free radical-scavenging activity of organic extracts and of pure flavonoids of Blumea balsamifera DC leaves. Food Chem. 2004;88:243–252. doi: 10.1016/j.foodchem.2004.01.041. [DOI] [Google Scholar]
- 27.Salem MM, Werbovetz KA. Antiprotozoal compounds from Psorothamnus polydenius. J Nat Prod. 2005;68:108–111. doi: 10.1021/np049682k. [DOI] [PubMed] [Google Scholar]
- 28.Nagao T, Abe F, Kinjo J, Okabe H. Antiproliferative constituents in plants 10. Flavones from the leaves of Lantana montevidensis BRIQ and consideration of structure-activity relationship. Biol Pharm Bull. 2002;25:875–879. doi: 10.1248/bpb.25.875. [DOI] [PubMed] [Google Scholar]
- 29.Tapia A, Rodriguez J, Theoduloz C, Lopez S, Feresin GE, Schmeda HG. Free radical scavengers and antioxidants from Baccharis grisebachii. J Ethnopharmacol. 2004;95:155–161. doi: 10.1016/j.jep.2004.06.035. [DOI] [PubMed] [Google Scholar]
- 30.Liu YL, Mabry TJ. Flavonoids from Artemisia ludoviciana var. ludoviciana. Phytochemistry. 1982;21:209–214. doi: 10.1016/0031-9422(82)80045-9. [DOI] [Google Scholar]
- 31.Al-Yahya MA, El-Sayed AM, Mossa JS, Kozlowski JF, Antoun MD, Ferin M, Baird WM, Cassady JM. Potential cancer chemopreventive and cytotoxic agents from Pulicaria crispa. J Nat Prod. 1988;51:621–624. doi: 10.1021/np50057a038. [DOI] [PubMed] [Google Scholar]
- 32.Lee S, Shin DS, Oh KB, Shin KH. Antibacterial compounds from the leaves of Acanthopanax senticosus. Arch Pharm Res. 2003;26:40–42. doi: 10.1007/BF03179929. [DOI] [PubMed] [Google Scholar]
- 33.Wollenweber E, Mayer K, Roitman JN. Exudate flavonoids of Inula viscosa. Phytochemistry. 1991;30:2445–2446. doi: 10.1016/0031-9422(91)83681-A. [DOI] [Google Scholar]
- 34.Vasconcelos JMJ, Silva AMS, Cavaleiro JAS. Chromones and flavanones from Artemisia campestris subsp maritime. Phytochemistry. 1998;49:1421–1424. doi: 10.1016/S0031-9422(98)00180-0. [DOI] [Google Scholar]
- 35.Stalin T, Rajendiran N. Photophysical properties of 4-hydroxy-3-methoxy benzoic acid. J Mol Struct. 2006;794:35–45. doi: 10.1016/j.molstruc.2006.01.038. [DOI] [Google Scholar]
- 36.Tong YF, Chen S, Cheng YH, Wu S. A convenient synthesis of 6-demethoxycapillarisin. Chin Chem Lett. 2007;18:407–408. doi: 10.1016/j.cclet.2007.01.049. [DOI] [Google Scholar]
- 37.Ahn JY, Lee HJ, Kim S, Park JH, Ha T. The anti-obesity effect of quercetin is mediated by the AMPK and MAPK signaling pathways. Biochem Biophys Res Commun. 2008;373:545–549. doi: 10.1016/j.bbrc.2008.06.077. [DOI] [PubMed] [Google Scholar]
- 38.Bell RM, Coleman RA. Enzymes of glycerolipid synthesis in eukaryotes. Annu Rev Biochem. 1980;49:459–487. doi: 10.1146/annurev.bi.49.070180.002331. [DOI] [PubMed] [Google Scholar]
- 39.Wolff DJ, Gauld DS, Neulander MJ, Southan G. Inactivation of nitric oxide synthase by substituted aminoguanidines and aminoisothioureas. J Pharmacol Exp Ther. 1997;283:265–273. [PubMed] [Google Scholar]