Abstract
The voltage-sensing phosphatase (VSP) consists of a voltage sensor and a cytoplasmic phosphatase region, and the movement of the voltage sensor is coupled to the phosphatase activity. However, its coupling mechanisms still remain unclear. One possible scenario is that the phosphatase is activated only when the voltage sensor is in a fully activated state. Alternatively, the enzymatic activity of single VSP proteins could be graded in distinct activated states of the voltage sensor, and partial activation of the voltage sensor could lead to partial activation of the phosphatase. To distinguish between these two possibilities, we studied a voltage sensor mutant of zebrafish VSP, where the voltage sensor moves in two steps as evidenced by analyses of charge movements of the voltage sensor and voltage clamp fluorometry. Measurements of the phosphatase activity toward phosphatidylinositol 4,5-bisphosphate revealed that both steps of voltage sensor activation are coupled to the tuning of phosphatase activities, consistent with the idea that the phosphatase activity is graded by the magnitude of the movement of the voltage sensor.
Introduction
Phosphoinositides (PIs) are involved in many cellular events, including proliferation, cell migration, vesicle transport and ion transport. Several types of PI phosphatases and kinases control the concentration and proportion of diverse phosphoinositides within cells. Regulation of the activities of PI phosphatases and kinases is crucial for cell signalling and homeostasis of cellular activities (Sasaki et al. 2009; Liu & Bankaitis, 2010).
The voltage-sensing phosphatase (VSP) is composed of a sensor of transmembrane voltage and a PI phosphatase with high similarity to PTEN (phosphatase and tensin homologue deleted on chromosome 10; Murata et al. 2005; Okamura & Dixon, 2011). PTEN is known as a tumour suppressor that dephosphorylates phosphatidylinositol-3,4,5-trisphosphate (PI(3,4,5)P3) to phosphatidylinositol-4,5-bisphosphate (PI(4,5)P2; Maehama et al. 2001) and plays key roles in signalling through activating the Akt cascade (Liu & Bankaitis, 2010). Despite high amino acid similarity in the active centre of the catalytic domain, VSP shows distinct substrate preferences from PTEN: it dephosphorylates PI(3,4,5)P3 to PI(3,4)P2 and also dephosphorylates PI(3,4)P2 and PI(4,5)P2 to phosphatidylinositol 4-phosphate (PI(4)P) (Iwasaki et al. 2008; Kurokawa et al. 2012).
The PI phosphatase activity of VSP is activated upon membrane depolarization (Murata et al. 2005; Murata & Okamura, 2007). The phosphatase activity of Ciona intestinalis voltage-sensing phosphatase (Ci-VSP) is coupled to the movement of the voltage sensor over the entire voltage range over which the extent of voltage sensor motion increases (Murata & Okamura, 2007; Sakata et al. 2011). Recent intensive studies have provided important clues to understanding molecular mechanisms of coupling between voltage sensor and phosphatase in VSP (Villalba-Galea et al. 2009; Kohout et al. 2010; Matsuda et al. 2011; Hobiger et al. 2012; Liu et al. 2012).
A short linker exists between the voltage sensor and the phosphatase domain and it has been shown to be critical for their functional coupling: mutation in the phosphoinositide binding motif (PBM) in the short linker eliminates coupling between the two domains (Murata et al. 2005; Villalba-Galea et al. 2009; Kohout et al. 2010). Cysteine scanning mutagenesis and computer simulation of conformations of the PBM have suggested that the PBM forms two distinct structures (Hobiger et al. 2012): one is a long α-helix, the other is two short helices connected with a β-turn. It has been claimed that the long α-helix of PBM in the resting state of the voltage sensor is changed into a structure with two short helices in response to membrane depolarization.
Crystal structures of the cytoplasmic domain of VSP have recently been resolved by two groups (Matsuda et al. 2011; Liu et al. 2012). Matsuda et al. have identified glutamate 411 in Ci-VSP, which is replaced by threonine 167 in human PTEN (hPTEN), as a critical site for determining the substrate preference of VSP which is distinct from hPTEN. Glu411 provides a more negative electrostatic environment and a smaller substrate binding pocket than in hPTEN (Matsuda et al. 2011). Liu et al. have revealed several structures in the cytoplasmic region of Ci-VSP (Liu et al. 2012). In some forms (closed forms), the structures were identical to those reported by Matsuda et al. In other forms (open form), the side chain of Glu411 is positioned away from the active centre and makes a larger substrate binding pocket than in the closed forms. They have claimed that the closed and open forms may represent enzyme-silent and enzyme-active forms, respectively. In addition, a conserved loop-like structure, ‘gating loop’, of the phosphatase domain which is missing in PTEN, has been proposed to be essential for regulation of phosphatase activity by the voltage sensor. It has been claimed that the voltage sensor alters the local structures of the substrate binding site by inducing a relatively large conformational change of the ‘gating loop’ which interacts with PBM. However, it remains to be established whether the ‘open’ and ‘closed’ forms correspond to the resting state and activated state of the enzyme domain, respectively. Kurokawa et al. have recently elucidated the substrate specificity of the enzymatic domain and also suggested that the specificity changes with membrane voltage (Kurokawa et al. 2012).
Despite these studies on the structural basis of the regulation of phosphatase activities, how the phosphatase activity is coupled with the voltage sensor still remains elusive. One idea for the coupling mechanism is that the phosphatase is active only when the voltage sensor is in a fully activated state, and the number of VSP molecules in the active state gradually increases as the membrane potential becomes more positive. The other possibility is that the enzymatic activity of single VSP proteins shows graded dependence on the extent of the motion of the voltage sensor.
In this study, we found that a voltage sensor double mutant of zebrafish VSP, Dr-VSP(T156R/I165R) designated as Dr-VSP(DM), exhibits two-stage activation of the voltage sensor, as shown by measurements of the sensing current and voltage clamp fluorometry. This mutant provides us with a good opportunity to test whether partial activation of the voltage sensor can trigger the enzymatic activity. Measurements of the phosphatase activity of Dr-VSP(DM) revealed that both steps of the voltage sensor activation are coupled to the phosphatase activity, indicating that the phosphatase activity of the VSP could be graded according to the extent of activation of the voltage sensor.
Methods
cDNAs and site-directed mutagenesis
The cDNAs of Dr-VSP, Dr-VSP(T156R/I165R) and Dr-VSP(C302S) were identical to those previously described (Hossain et al. 2008). Kir3.4 cDNA was kindly provided by Dr D. E. Logothetis (Virginia Commonwealth University, USA). For expression in cells of the human embryonic kidney cell line HEK293T, cDNA of Kir3.4 was subcloned into pIRES2-EGFP (Biosciences Clontech, CA, USA), and S143T mutation was introduced using QuikChange Site-Directed Mutagenesis Kit (Stratagene, CA, USA) with the primer set: 5′-GCTTTCCTGTTCACCATCGAGACAGAAAC-3′ and 5′-GTTTCTGTCTCGATGGTGAACAGGAAAGC-3′. Mutations I66F, S149C and R192A/R193A were introduced using the primer sets: 5′-GGCCTG GTACTGTTCATCTTGGACATCATTATGG-3′ and 5′-CCATAATGAT GTCCAAGATGAACAGTACCAGGCC-3′, 5′-GATTTCT CAGGAGCCTGTCTGATTCCCAGGG-3′ and 5′-CCCT GGGAATCAGACAGGCTCCTGAGAAA TC-3′, 5′-GGT TTCAGAGAACAAAGCAGCGTACCAAA AAGATGG-3′ and 5′-CCATCTTTTTGGTACGCTGCTTT GTTCTCTG AAACC-3′, respectively. The pleckstrin homology domain from phospholipase Cδ subunit, fused with green fluorescent protein (PHPLC-GFP), was kindly provided by Dr M. Takano (Jichi Medical University).
Preparation of oocytes and in vitro synthesis of cRNA
The preparation of oocytes was performed as described previously (Sakata et al. 2011). Briefly, Xenopus oocytes were collected from frogs anaesthetized in water containing 0.2% ethyl 3-aminobenzoate methanesulfonate salt (Sigma-Aldrich, St Louis, MD, USA). The oocytes were defolliculated using type I collagenase (1.0 mg ml−1, Sigma-Aldrich), and injected with approximately 50 nl of cRNA, which was synthesized using a mMESSAGE mMACHINE transcription kit (Ambion, Inc., Austin, TX, USA). Injected oocytes were incubated for 2–3 days at 18 °C in ND96 solution (5 mm Hepes, 96 mm NaCl, 2 mm KCl, 1.8 mm CaCl2, 1 mm MgCl2, pH 7.5, supplemented with gentamycin and pyruvate; Goldin, 1992). All experiments were carried out following the guidelines of the Animal Research Committees of the Graduate School of Medicine of Osaka University and also complied with the policies and regulations of The Journal of Physiology (Drummond, 2009).
Fluorometry and confocal imaging in Xenopus oocytes
For voltage clamp fluorometry, Dr-VSP(DM/S149C) expressed in Xenopus oocytes was labelled with 10 μm Alexa Fluor 488 C5 maleimide (Invitrogen) in a solution containing 100 mm Hepes, 2 mm KCl, 70 mm NaCl, 1 mm CaCl2, 1 mm MgCl2, 70 mm NaOH (pH 7.0) for 1–2 h in the dark. Alexa-488 was excited by a 488 nm blue laser (FITEL, HPU50101, Furukawa electric, Tokyo, Japan). A ×20/0.75 NA objective lens equipped with an inverted microscope (Olympus, Tokyo, Japan) was used. BP470-495 (Olympus), BA510-550 (Olympus) and DM505 (Olympus) were used for excitation filter, emission filter and dichroic mirror, respectively. The fluorescence was detected with a photomultiplier (H10722-20, Hamamatsu Photonics, Hamamatsu, Japan) while controlling the oocyte membrane potential with a two-electrode voltage clamp (TEVC; AxoClamp 2B amplifier, Molecular Devices, Sunnyvale, CA, USA). ND96 solution was utilized as a bath solution. Bleaching of fluorescence was not subtracted. Data were averaged 25–50 times and digitally filtered at 300 Hz.
Fluorescence of PHPLC-GFP to detect PI(4,5)P2 was measured as previously described (Murata & Okamura, 2007; Sakata et al. 2011). PHPLC-GFP was coexpressed with Dr-VSP(DM) in oocytes and the GFP fluorescence was observed using a FV300 confocal microscope (Olympus) equipped with a ×20/0.5 NA objective under TEVC. The fluorescence intensity of images was calculated by Fluoview software (Olympus) and normalized by Microsoft Excel.
Electrophysiology
On-cell patch clamp recording of the inwardly rectifying potassium (Kir) current coexpressed with Dr-VSP in HEK293T cells was performed using an EPC 9 patch clamp amplifier (HEKA Electronik, Lambrecht, Germany). The output signal was filtered at 2–4 kHz using a 4-pole Bessel filter. The bath solution contained 20 mm Hepes, 100 mm KCl, 3 mm MgCl2, 1 mm CaCl2 (pH 7.2), and the pipette solution contained 20 mm Hepes, 40 mm KCl, 60 mm NaCl, 1 mm CaCl2, 3 mm MgCl2 (pH 7.2). Patch pipettes with 1.2–3.0 MΩ were fabricated from 100 μl Calibrated Micropipets (Drummond Scientific Company, PA, USA) followed by fire-polishing of the tips. The sampling frequency was 14–28 kHz. Measurements of sensing currents (asymmetrical capacitative currents derived from the motion of the voltage sensor) were made in a bath solution containing 180 mm Hepes, 75 mm N-methyl-d-glucamine (NMDG), 1 mm MgCl2, 1 mm CaCl2 (pH 7.0), and a pipette solution contained 183 mm Hepes, 65 mm N-methyl-d-glucamine (NMDG), 3 mm MgCl2, 1 mm EGTA (pH 7.0), with whole-cell patch configuration. The resistances of the microelectrodes were 7–11 MΩ, and the sampling frequency was 20–28 kHz. Data acquisition was done using Patchmaster software (HEKA Electronik). All sensing currents were digitally filtered at 3 or 5 kHz.
Charge–voltage (Q–V) relationships of voltage sensors were fitted by the Boltzmann equation:
| (1) |
(where F is the Faraday constant, R is the gas constant, T is the absolute temperature, z is the effective valency, Vhalf is the voltage at which half of maximum charge moves) or by the sum of two Boltzmann equations:
 |
(2) |
(where z0 and z1 are the effective valencies, and V0 and V1 are the voltages at which half of the maximum charge moves). All fitting parameters are listed in Table 1.
Table 1.
Summary of z and Vhalf values of Q–V and F–V curves of Dr-VSP
| z0(z) | V0(Vhalf) (mV) | z1 | V1 (mV) | |
|---|---|---|---|---|
| Wild-type (n = 5) | 1.6 ± 0.1 | 85.9 ± 1.9 | — | — |
| I66F (n = 3) | 1.5 ± 0.1 | 55.7 ± 4.0 | — | — |
| DM(OFF) (n = 6) | 1.9 ± 0.2 | −22.2 ± 9.0 | 1.1 ± 0.2 | 95.2 ± 16.7 |
| DM(ON) (n = 6) | 2.0 ± 0.2 | −15.4 ± 7.3 | 1.1 ± 0.2 | 122.6 ± 1.0 |
| DM/C302S (n = 6) | 2.0 ± 0.2 | −16.5 ± 7.2 | 1.6 ± 0.2 | 126.3 ± 5.0 |
| DM/PBM (n = 5) | 2.0 ± 0.2 | −22.8 ± 5.6 | 1.5 ± 0.2 | 120.0 ± 10.0 |
| DM(VCF) (n = 5) | 1.1 ± 0.3 | −47.1 ± 7.3 | — | — |
Model simulation
A linear three-state model was used for analysis of voltage sensor movements. The scheme is shown in Fig. 9A. The rates are given by:
Figure 9.
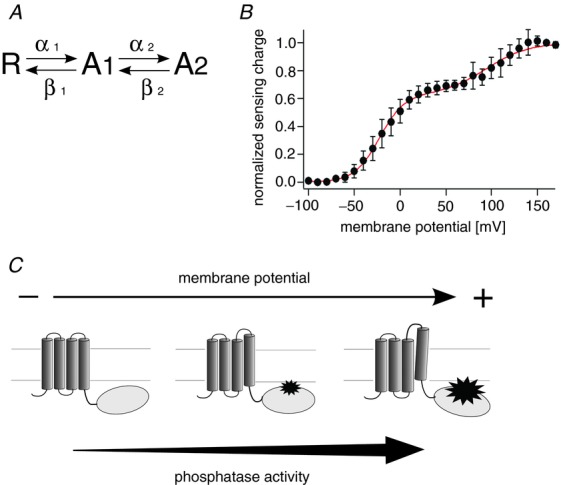
A, scheme of the state model of the voltage sensor movement of Dr-VSP(DM). R, A1 and A2 refer to the resting, intermediate and fully activated state, respectively. See Methods for the definition of the rate. B, fitting of the model to QOFF–V relationship of Dr-VSP(DM). Red curve indicates the model fit to the QOFF–V relationship. Parameters were estimated to be z1 = 1.76, z2 = 1.05, K1 = 0.19, K2 = 61.8. Black filled circles denote QOFF–V relationship of Dr-VSP(DM). C, the phosphatase activity is graded as membrane potential is altered. Distinct levels of phosphatase activity are coupled to distinct activated states of the voltage sensor.
where i = 1 or 2; αi0 and βi0 are the rates at 0 mV; and zia and zib are the charge valencies. F, R and T are Faraday constant, gas constant and absolute temperature, respectively. The charge–voltage relationship calculated in this model is given by:
where Ei, Ki and zi are defined by zi = zia + zib, Ki = βi0/αi0, Ei = Kiexp[–zi(FV/RT)]. zi and Ki were estimated by fitting using IGOR Pro 6.0 software (WaveMetrics, Inc., Lake Oswego, OR 97035, USA).
Results
Relationship between the voltage sensor activation and phosphatase activity of wild-type Dr-VSP measured by Kir3.4 activities
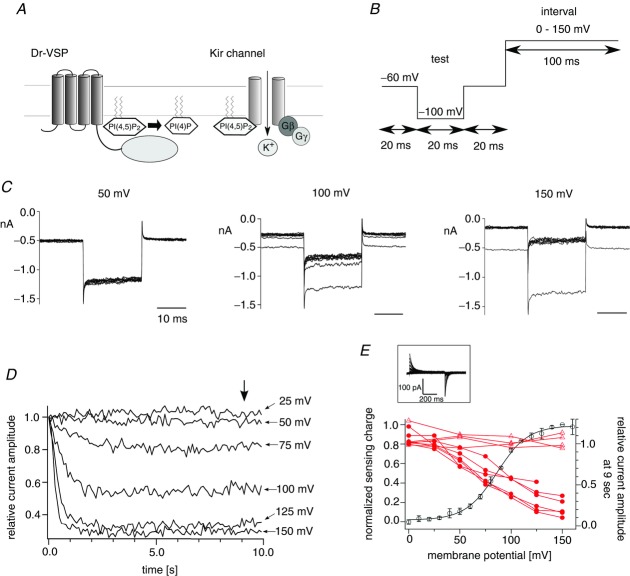
In our previous study, the phosphatase activity of Ci-VSP measured at high membrane potential in Xenopus oocytes showed that the phosphatase activity is coupled to the movement of the voltage sensor over the entire voltage range over which the extent of voltage sensor motion varies (Sakata et al. 2011). To test if the phosphatase activity is also linearly related to the motion of the voltage sensor domain in zebrafish VSP (Dr-VSP), we measured the voltage-dependent phosphatase activity of Dr-VSP. Kir3.4(S143T) was used as the read-out of the phosphatase activity toward PI(4,5)P2 (Fig. 1A). The S143T mutant shows larger currents than wild-type Kir3.4 and its PI(4,5)P2-dependent activities have been studied in detail (Vivaudou et al. 1997; Zhang et al. 1999; Sadja et al. 2001). Kir3.4(S143T) currents were recorded in on-cell patch configuration with a bath solution of 100 mm potassium ions that sets the membrane potential of the entire cell at around 0 mV as in the previous study (Sakata et al. 2011). Test steps to −100 mV were applied next by depolarizing intervals. The test steps were repeated 100 times for each setting of interval voltage (Fig. 1B). Repeated stimulations reduced Kir3.4(S143T) current (Fig. 1C), and the decreases of currents tended to be saturated (Fig. 1D). At higher membrane potentials, steady-state current levels became smaller in the range from 0 mV to 150 mV (Fig. 1E). The potassium current did not decrease in cells expressing only Kir3.4(S143T) (Fig. 1E, and Supplemental Fig. S1 available online).
Figure 1.
A, scheme for measurements of voltage-dependent phosphatase activity of Dr-VSP using the Kir channel. B, pulse protocol used in on-cell patch recordings. C, families of the Kir3.4(S143T) currents elicited when the interval voltage was set to 50, 100 or 150 mV. Pulse protocols shown in B were repeated 100 times. Currents elicited during test pulses to −100 mV repeated every 1 s (10 times each) were superimposed. Data sets were collected from the same patch. Membrane potential was held at −60 mV between repetitive pulses. The next repetitive pulse was started after the Kir current recovered to the initial current amplitude. D, plots of the normalized current amplitudes against the accumulated interval time. The averages of the last 2 ms of the test pulse were taken and normalized to the magnitude at the first episode. Data points were connected by lines. E, superimposition of the voltage-dependent phosphatase activity on the QOFF–V curve of Dr-VSP. Red filled circles indicate the relative current amplitudes at 9 s of the accumulated interval time (arrow in D). Data sets connected by lines are the data from the same patches (n = 6). Red open triangles indicate the normalized current amplitude of Kir3.4(S143T) recorded from cells which did not express VSP. The normalized currents at 9 s of accumulated interval time were plotted (Supplemental Fig. S1 online). Black open symbols indicate the normalized sensing charge of Dr-VSP. Data are shown as mean ± SD (n = 5). The black curve indicates the QOFF–V curve fit by the Boltzmann equation (formula 1). The inset shows the sensing current of Dr-VSP. Voltage steps ranged from 0 to 160 mV in 10 mV increments. Leak currents were subtracted by a P/–10 protocol from a holding potential of −60 mV.
To compare the voltage dependence of the phosphatase activity with that of the voltage sensor, we measured asymmetric displacement currents (sensing currents) derived from the charge movements of the voltage sensor (inset in Fig. 1E). Moved charges were calculated by the integration of OFF-sensing current, and plotted against the membrane potential (charge–voltage (QOFF–V) relationship). Superimposition of the Kir reporting phosphatase activity on the QOFF–V relationship of Dr-VSP showed that voltage dependence of the phosphatase activity is similar to that of the movement of the voltage sensor (Fig. 1E). These results imply that the phosphatase activity is coupled to the movement of the voltage sensor in Dr-VSP as established in Ci-VSP (Sakata et al. 2011).
However, in Dr-VSP, it could not be verified whether the phosphatase activity is saturated over the voltage range where the motion of voltage sensor is saturated, because the magnitude of sensing charge was not completely saturated even at 150 mV in Dr-VSP unlike Ci-VSP. Recently, Lacroix J. et al. have reported that an S1 mutant of Ci-VSP, I126F, shows shifted voltage dependence by around −90 mV (Lacroix & Bezanilla, 2012). I66 of Dr-VSP, corresponding to I126 of Ci-VSP (Fig. 2A), was mutated to phenylalanine (Dr-VSP(I66F)). The QOFF–V relationship of Dr-VSP(I66F) showed a negative shift of about 30 mV as compared with that of wild-type (Fig. 2C). To measure the phosphatase activity of Dr-VSP(I66F), we employed the Kir2.1 channel instead of the Kir3.4(S143T) channel. Since Kir2.1 has higher affinity toward PI(4,5)P2 than Kir3.4(S143T) (Zhang et al. 1999), Kir2.1 is suitable for measuring the robust phosphatase activity at high membrane potentials at which the movements of the voltage sensor of Dr-VSP(I66F) are saturated. The rate of the current decrease did not change in the voltage range from 100 mV to 175 mV (Fig. 2D and E). Decay time constants in single exponential fits of current decreases (Fig. 2E) did not vary among four voltages (Fig. 2F). At voltages lower than 100 mV, the current decrease was milder than that at voltages higher than 100 mV (Supplemental Fig. S2). Furthermore, Kir2.1 currents did not decrease in the cells expressing only the Kir2.1 channel (Supplemental Fig. S3). These results are consistent with the idea that the phosphatase activity of Dr-VSP is tightly coupled to the movement of its voltage sensor over the entire voltage range.
Figure 2.
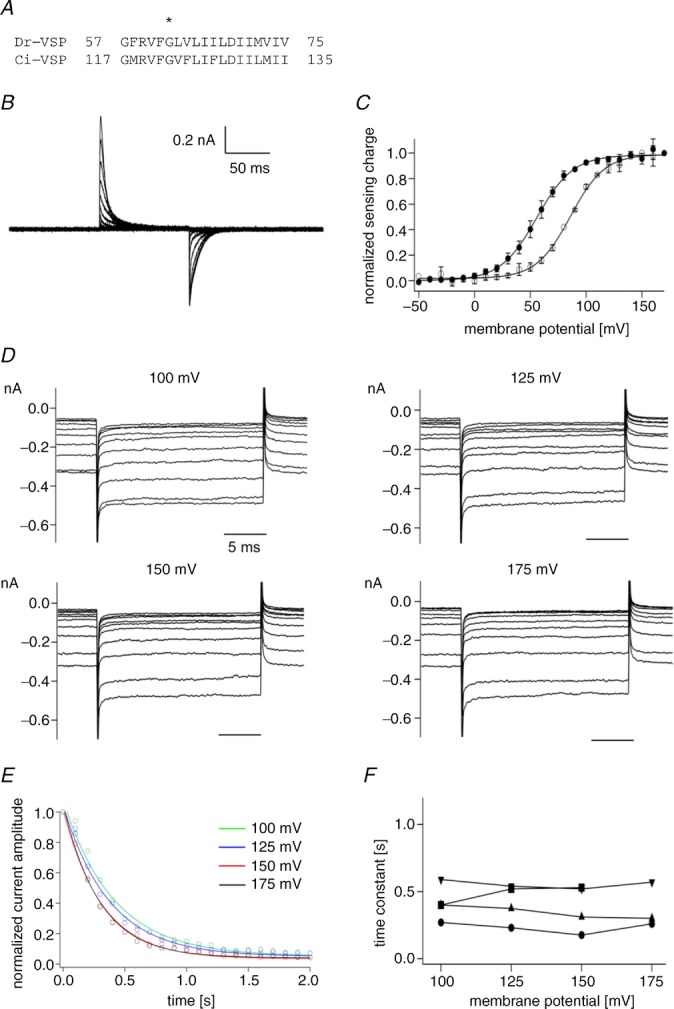
A, amino acid alignment of S1 in Dr-VSP and Ci-VSP. An asterisk indicates the position of I66 in Dr-VSP and I126 in Ci-VSP. Mutating I126F in Ci-VSP is known to shift the QOFF–V curve by about 90 mV leftward (Lacroix & Bezanilla, 2012). B, representative traces of sensing currents of Dr-VSP(I66F). Voltage steps ranged from −80 to 160 mV in 10 mV increments. Traces for every 20 mV are shown. Leak currents were subtracted by a P/–5 protocol from a holding potential of −80 mV. C, QOFF–V relationship of Dr-VSP(I66F). Filled circles represent normalized sensing charge of Dr-VSP(I66F). Data were fitted by the Boltzmann equation (formula 1). Data are shown as mean ± SD (n = 3). Open circles indicate the normalized sensing charge of wild-type Dr-VSP (same data shown in Fig. 1E). D, families of Kir2.1 currents. Currents elicited during test pulses to −100 mV were superimposed. Only the 1st to 10th episodes are shown. The pulse protocol shown in Fig. 1B was repeated 100 times. The membrane potential was held at −60 mV until Kir current was recovered to the initial level as in Fig. 1. E, normalized current amplitudes were plotted against time. Data sets at four distinct voltages were fitted by a single exponential equation, which is shown by the curves. F, time constants from four patches. The same symbols indicate the data from the same patches.
Q–V relationship of Dr-VSP(T156R/I165R) was fitted by the sum of two Boltzmann components
In a previous study, two hydrophobic residues T156 and I165 in S4 of Dr-VSP were substituted by arginines resulting in periodic alignment of six basic amino acid residues (designated as Dr-VSP(DM); Fig. 3A; Hossain et al. 2008). Rapid sensing currents are evoked from Dr-VSP(DM) (Fig. 3B inset). The QOFF–V relationship was fitted by the sum of two Boltzmann equations (Fig. 3B and C black; (2). The plotting of ON-sensing charges (QON) against the membrane potential (QON–V relationship) was also fitted by formula 2 (Fig. 3C, red). For convenience, the charge movements at lower and higher membrane potentials were named the first and second Boltzmann components, respectively. We also noted that the ON-sensing current of Dr-VSP(DM) has fast and slow components at higher membrane potentials than 100 mV (Fig. 3D). This was more clearly demonstrated in the time course of the cumulative charge (Fig. 3E): curves were fitted by a single exponential under 100 mV and by double exponentials over 120 mV. At 0 mV, the time constant was around 4 ms and it became smaller as membrane potential was increased up to 80 mV (Fig. 3F). At voltages higher than 120 mV, the time constants of the fast components were around 0.5 ms and those of the slow components were around 10 ms (Fig. 3F). Unlike ON-sensing currents, charge–time relationships of OFF-sensing currents were fitted by a single exponential equation.
Figure 3.
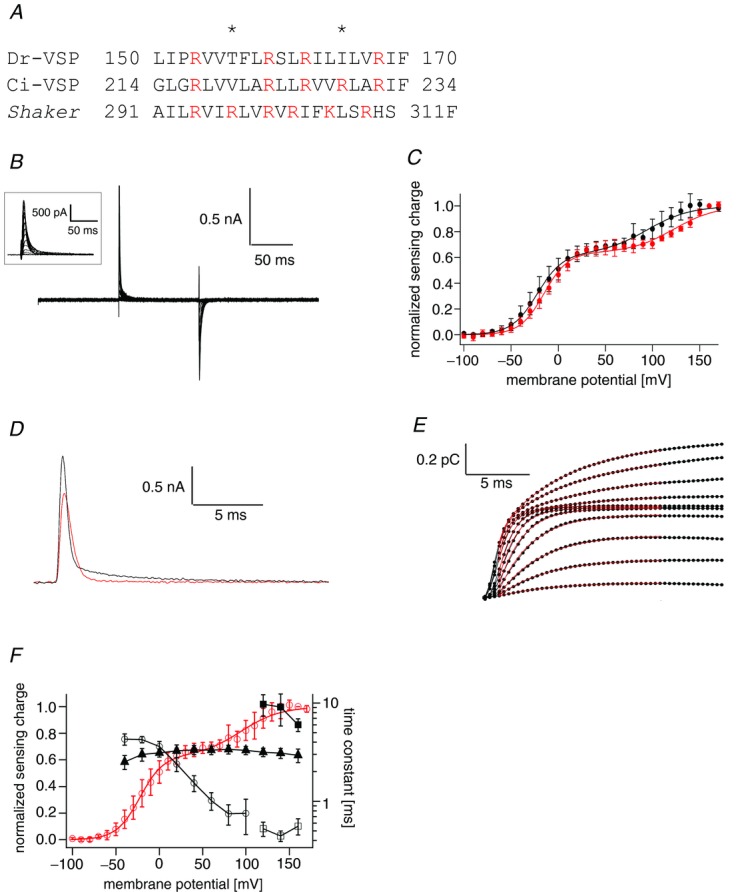
A, amino acid alignment of S4. Basic amino acid residues are shown in red. Asterisks indicate the residues substituted by arginine residues in Dr-VSP(DM). B, representative sensing currents of Dr-VSP(DM). Voltage steps ranged from −100 to 160 mV in 10 mV increments. The holding potential was −100 mV. Traces for every 20 mV were superimposed. The inset is a magnified view of the ON-sensing currents. Leak currents were subtracted by a P/–10 protocol from a holding potential of −100 mV. C, QON–V and QOFF–V relationship of the sensing charge. Red and black circles indicate QON and QOFF relationships of Dr-VSP(DM), respectively. Data are shown as mean ± SD (n = 6). Lines indicate the curve fit by the sum of two Boltzmann equations (formula 2). D, representative ON-sensing currents of Dr-VSP(DM) at 100 mV (red) and 160 mV (black). E, integral of ON-sensing currents plotted against time. Black points indicate charges calculated by integration. Data ranging from −40 mV to 160 mV in 20 mV increments are shown. Red lines indicate the fitting curve by the single (≤100 mV) and double (≥120 mV) exponential equations. Current traces during 15.5 ms of the depolarizing pulse were fitted. Traces for 20 ms are shown to illustrate the time course. F, time constants estimated from the curves in E. Black open circles represent the time constants at less than 100 mV. Black open and filled squares represent the fast and slow components at the voltage over 120 mV, respectively. Black triangles indicate time constants of the OFF-sensing current. Data are shown as mean ± SD (n = 6). The red line represents the QOFF–V curve, which is the same as C.
Effects of the phosphatase activity on the operation of the voltage sensor
We have previously reported that the enzymatic activity influences the movement of the voltage sensor (Hossain et al. 2008). To examine how the phosphatase activity is related to the movement of the voltage sensor in Dr-VSP(DM), the sensing current was also recorded from the enzyme-defective mutant, Dr-VSP(DM/C302S) (Fig. 4A). The QOFF–V relationship was able to be fitted by formula 2 (the sum of two Boltzmann equations; Fig. 4B). At high membrane potential, the ON-sensing current had fast and slow components as shown in Dr-VSP(DM) (Fig. 4C and D).
Figure 4.
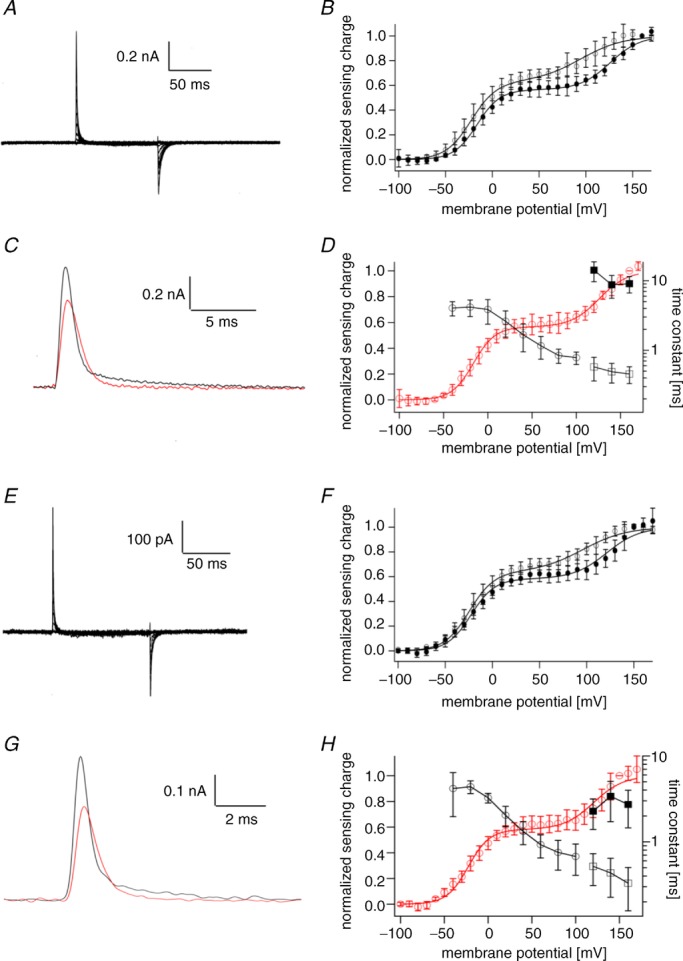
A, representative sensing current traces of Dr-VSP(DM/C302S). Voltage steps ranged from −100 to 160 mV in 10 mV increments. The holding potential was −100 mV. Traces for every 20 mV are shown. Leak currents were subtracted by a P/–10 protocol from a holding potential of −100 mV. B, QOFF–V relationships of Dr-VSP(DM/C302S). Filled and open circles represent the data for Dr-VSP(DM/C302S) and Dr-VSP(DM), respectively. Data for Dr-VSP(DM) are the same as those in Fig. 3C. Data for Dr-VSP(DM/C302S) are shown as mean ± SD. The QOFF–V relationship was fitted by the sum of two Boltzmann equations (formula 2). C, representative ON-sensing current traces of Dr-VSP(DM/C302S) at 100 mV (red) and 160 mV (black) shown on an extended time scale. D, time constant of ON-sensing currents of Dr-VSP(DM/C302S). Time constants were estimated by fitting to the charge–time relationship calculated by the integration of sensing current as in Fig. 3. Black open circles denote time constants of ON-sensing currents. Black open and filled squares represent the fast and slow components, respectively, estimated by fitting double exponential equations. Data are shown as mean ± SD (n = 5). Red open circles represent the QOFF–V relationship of Dr-VSP(DM/C302S), which is the same as in B (black circles). E, representative sensing current of Dr-VSP(DM) PBM mutant. Pulse protocol and the holding potential were the same as in A. F, QOFF–V relationship of Dr-VSP(DM) PBM mutant. Filled and open circles represent data for the Dr-VSP(DM) PBM mutant and Dr-VSP(DM), respectively. Data for the Dr-VSP(DM) PBM mutant are shown as mean ± SD (n = 5). The QOFF–V relationship was fitted by formula 2. G, representative traces of ON-sensing current from Dr-VSP(DM) PBM mutant at 100 mV (red) and 160 mV (black) shown on an extended time scale. H, time constant of ON-sensing current from Dr-VSP(DM) PBM mutant. Black open circles denote time constants of ON-sensing currents lower than 100 mV. Black open and filled squares represent the fast and slow components, respectively, estimated by fitting with double exponential equations. Data are shown as mean ± SD (n = 5). Red circles represent the QOFF–V relationship of Dr-VSP(DM) PBM mutant, which is the same as in F.
It has been reported that the phosphatase activity is not activated upon the movement of the voltage sensor when a mutation in the PBM is introduced (Villalba-Galea et al. 2009; Kohout et al. 2010; Hobiger et al. 2012). We recorded the sensing current of the PBM mutant of Dr-VSP(DM) (Dr-VSP(DM/R192A/R193A)), and the QOFF–V relationship was still able to be fitted by formula 2 (Fig. 4E and F). The ON-sensing current of the Dr-VSP(DM) PBM mutant also has both fast and slow components at high membrane potential (Fig. 4G and H). These findings indicate that Q–V relationships of the mutant without voltage-dependent phosphatase activity also have two Boltzmann components.
Voltage clamp fluorometry of Dr-VSP(DM) also suggests two distinct stages of voltage sensor activation
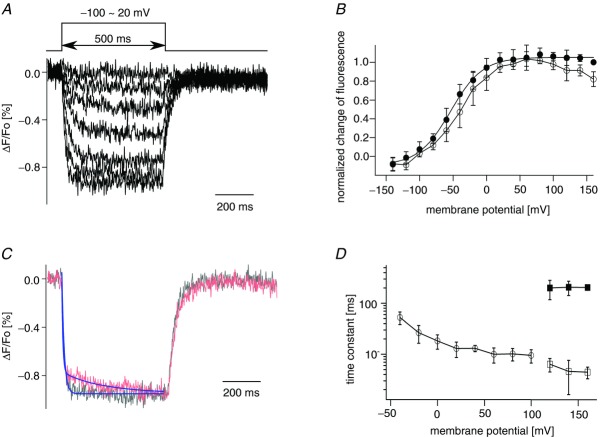
We also used a voltage clamp fluorometry method to examine the motions of the voltage sensor in Dr-VSP(DM) as reported for Ci-VSP (Kohout et al. 2008; Villalba-Galea et al. 2008). Serine 149 in Dr-VSP(DM) located at the extracellular part of S4 was replaced by cysteine and Alexa-488 maleimide was attached to this site. Quenching of the fluorescence upon depolarization in Xenopus oocytes was observed (Fig. 5A). The average of the normalized fluorescence change during the last 10 ms of test pulses was plotted against membrane potential (F–V plot; filled circles, Fig. 5B). The F–V plot was fitted by the single Boltzmann equation (formula 1; Fig. 5B and C). This profile is distinct from the Q–V relationships which were fitted by the sum of two Boltzmann equations (formula 2). However, we found that the slow decay phase of fluorescence quenching appeared at membrane potentials over 100 mV (Fig. 5C) and also found that the magnitudes of the initial fast decay decreased at the high voltage where the slow decays appeared (Fig. 5C, and B (open circles)). Fluorescence decays were fitted with the single exponential at voltages less than 100 mV and with the double exponentials over 100 mV (Fig. 5C and D). The slow decay component of the fluorescence appeared in a similar voltage range to that of the appearance of the slow component of the ON-sensing current. This suggests that the voltage sensor has a different conformation at voltages over 100 mV to that at lower voltages, consistent with the idea that the voltage sensor of Dr-VSP(DM) moves in two steps.
Figure 5.
A, optical recording of the movement of the voltage sensor of Dr-VSP(DM). Fluorescence quenching ranging from −100 mV to 20 mV is shown. Traces every 20 mV are superimposed. Holding potential was −100 mV. B, plot of normalized fluorescence quenching against membrane potential. Filled and open circles represent the average of the normalized change of fluorescence of the last 10 ms of the test pulse and the average between 50 and 55 ms after the beginning of the pulse protocol, respectively. Data are shown as mean ± SD (n = 6). C, time course of fluorescence quenching at 100 mV and 160 mV. Lines represent the curves fitted to the data. Data at voltages of 100 (black) and 160 mV (red) were fitted by the single exponential equation and the double exponential equation, respectively. Each episode was normalized by the individual averaged fluorescence intensity between 50 and 55 ms after the beginning of the pulse protocol. D, time constants of the fluorescence quenching are plotted against membrane potential. Fluorescence quenching elicited during the test pulse was fitted by single (≤100 mV) or double (≥120 mV) exponential equations. At less than 100 mV, open circles indicate the time constants from curves fitting fluorescence quenching by a single exponential equation; at more than 100 mV, open and filled squares denote the time constants of the fast and slow components fitted with double exponential equations. Data are shown as mean ± SD (n = 5).
Phosphatase activity of Dr-VSP(DM) reported by Kir potassium channels
The voltage-dependent phosphatase activity of Dr-VSP(DM) was measured in on-cell patch configuration as shown in the scheme of Fig. 1. Kir currents decreased upon repeated depolarizing intervals with voltages ranging from −75 mV to 0 mV (Fig. 6A). A plot of the normalized current against the cumulative interval time showed that the current decrease became sharper as the membrane potential was increased (Fig. 6B). Normalized current amplitude was fitted by the single exponential equation, and the time constant was plotted against membrane potential (Fig. 6C). Comparison of pooled data of phosphatase activities from six patches with the QOFF–V curve (Fig. 6C) indicates that the first Boltzmann component of the voltage sensor motion is accompanied by the voltage-dependent change of phosphatase activity.
Figure 6.
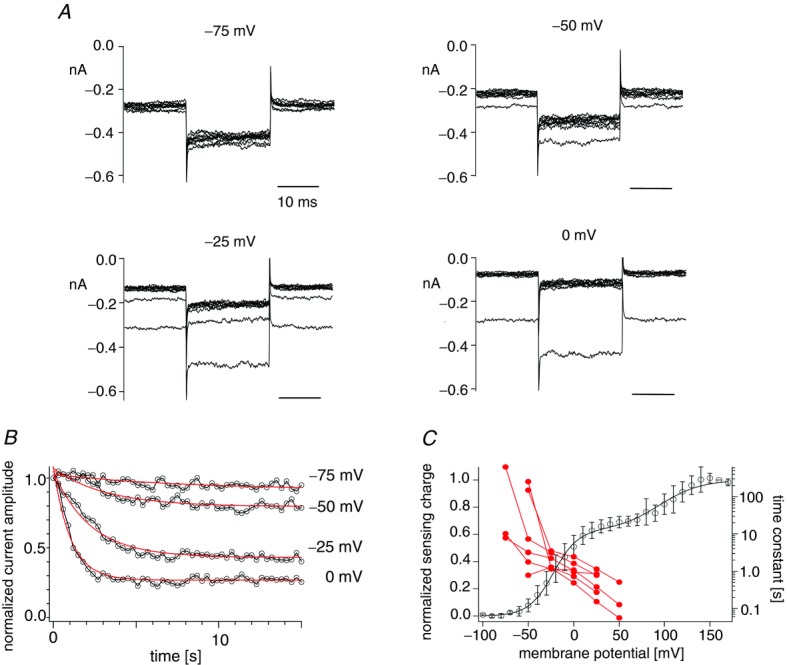
A, families of the Kir3.4(S143T) currents heterologously expressed with Dr-VSP(DM) in HEK293T cells. Currents elicited during repetitive test pulses to −100 mV are superimposed. Currents every 3 s are shown. Time intervals were 0.3 s. Membrane potential was held at −80 mV between repetitive pulses as in Fig. 1. B, plots of the normalized current amplitudes. Currents were normalized in the same way as in Fig. 1. Data series with interval voltages of −75 mV to 0 mV were collected from the same patch. Data points are connected by black lines. Red curves indicate the curves fitted by the exponential equation. C, pooled data of voltage-dependent decrease of the potassium currents. Red filled circles indicate time constants estimated by the exponential fitting. Data sets from the same patches are connected by lines (n = 6). The black line denotes the QOFF–V curve of Dr-VSP(DM) (same data as in Fig. 3C).
For measuring the phosphatase activity at high membrane potential, the Kir2.1 channel instead of the Kir3.4(S143T) channel was utilized as done in Fig. 2, because higher phosphatase activity was expected. Kir2.1 current was decreased by repeated depolarization intervals in cells expressing Dr-VSP(DM) and Kir2.1 channels (Fig. 7A). The normalized current amplitude was plotted against the cumulative interval time (Fig. 7B), and the phosphatase activity was estimated by the single exponential fit (Fig. 7C). Superimposition of the decay time constants on the QOFF–V curve demonstrates that Dr-VSP(DM) exhibits voltage-dependent tuning of the phosphatase activity over the voltage range of the second Boltzmann component of voltage sensor motion. This indicates that both the first and second Boltzmann components are accompanied by a increase of phosphatase activity.
Figure 7.
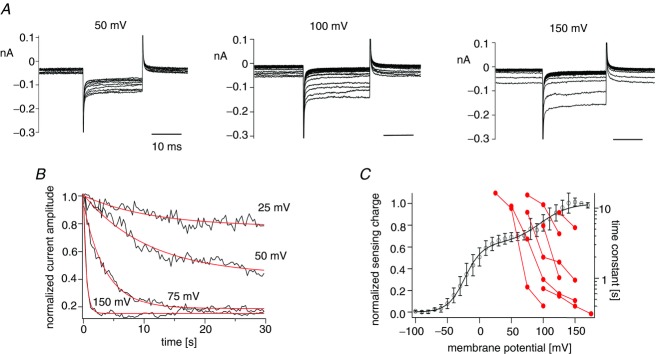
A, families of the Kir2.1 currents. Currents elicited during repetitive test pulses to −100 mV applied every 0.3 s are superimposed. Membrane potential was held at −80 mV until the next repetitive pulse was started. B, normalized current amplitudes were fitted by the single exponential equation. Black indicates normalized Kir2.1 current. Normalization of currents was carried out in the same way as in Fig. 1. Data points were connected by lines. Red lines represent curves fitted by the single exponential equation. The data set for interval voltages of 25–150 mV was collected from the same patch. C, time constants from fitting time courses of current decay with the single exponential equation are plotted against membrane potential. Red filled circles indicate time constants estimated in B. Data sets from the same patches are connected by lines (n = 7). The black line represents the QOFF–V curve of Dr-VSP(DM).
PHPLC-GFP fluorescence changes in oocytes expressing Dr-VSP(DM)
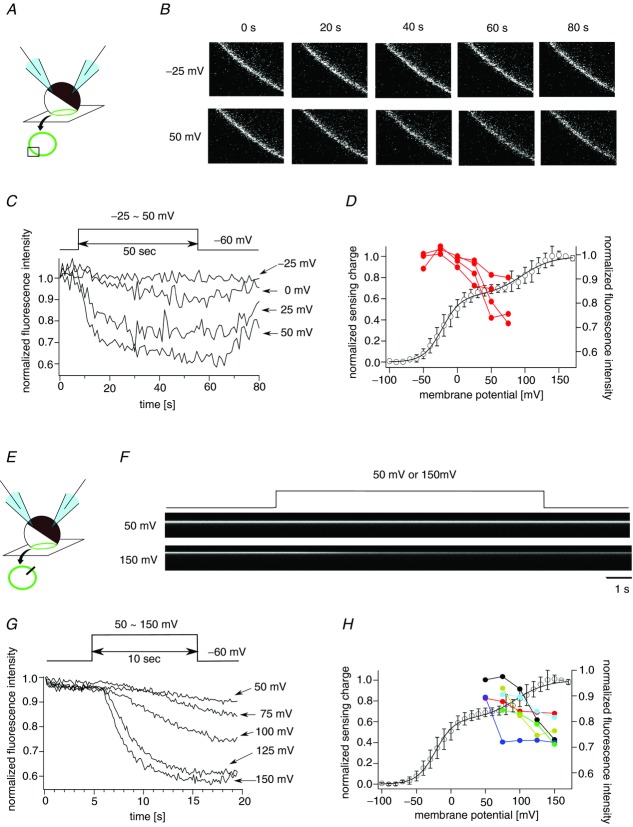
We also assessed the phosphatase activity of Dr-VSP(DM) by visualizing PI(4,5)P2. The pleckstrin homology (PH) domain of phospholipase C (PHPLC) is known to selectively bind to PI(4,5)P2. Coexpression of VSP and PHPLC fused with GFP (PHPLC-GFP) successfully reported the phosphatase activity as a reduction of GFP fluorescence on the plasma membrane (Murata & Okamura, 2007; Sakata et al. 2011). Confocal microscopy used in the XYT mode (Fig. 8A) revealed that the GFP fluorescence decayed in a voltage-dependent manner in oocytes expressing Dr-VSP(DM) and PHPLC-GFP (Fig. 8B and C). The reduction of the fluorescence was observed at 0 mV in most oocytes and the amplitude of the reduction became larger as membrane potential was increased (Fig. 8D). In measuring the phosphatase activity at voltages over 50 mV, the duration of the test pulse was shortened to 10 s because cells deteriorated upon depolarization to over 100 mV for 50 s. The scan mode was also changed from XYT mode to XT mode in order to increase the time resolution (Figs 8E and 7F). The decay kinetics of the fluorescence were clearly voltage dependent over 50 mV in five out of six tested cells (Fig. 8G and H). These results demonstrate that both the first and second Boltzmann components of voltage sensor motion are accompanied by an increase of phosphatase activity.
Figure 8.
A, XYT mode of the confocal microscope. The plasma membrane in the confocal plane is shown as a green circle. Images surrounded by a box on a green circle were collected every 1 s. B, confocal images of an oocyte expressing PHPLC-GFP (XYT mode). PHPLC-GFP was localized at the cell periphery. Images every 20 s are shown. C, the voltage-dependent decay of the GFP fluorescence intensity. Normalized fluorescence intensity of images acquired every 1 s is plotted. Data sets were collected from the same oocytes. D, voltage-dependent decreases of the fluorescence are superimposed on the QOFF–V curve of Dr-VSP(DM). Red filled circles indicate the normalized fluorescence intensities measured at 25 s after the beginning of the depolarization. Data from the same oocyte are connected by a line (n = 4). The black curve denotes the QOFF–V curve of Dr-VSP(DM). E, XT mode of the confocal microscope. Images indicated by a line on a green circle were collected and aligned against time as shown in F. F, representative data of the fluorescence decreases at 50 mV and 150 mV observed by XT mode of the confocal microscope. G, voltage-dependent reductions of the fluorescence measured by XT mode. Data sets were collected from the same oocytes. H, the decays of the fluorescence were superimposed on the QOFF–V curve of Dr-VSP(DM) (black curve). Filled symbols indicate the normalized fluorescence at 3 s after the beginning of the test pulses (n = 6). Colours denote individual oocytes.
Discussion
To gain insight into the coupling mechanism between the voltage sensor and the phosphatase activity of VSP, we analysed a voltage sensor mutant of Dr-VSP. The sensing current and fluorescence quenching in voltage clamp fluorometry suggest that the voltage sensor of Dr-VSP(DM) moves in two stages. Measurements of the phosphatase activity revealed that the phosphatase activity is increased in both of two voltage sensor movements (Figs 6, 7 and 8), suggesting that distinct activated states of the voltage sensor regulate phosphatase activity to distinct degrees.
Operation of the voltage sensor of Dr-VSP(DM)
The operation of the voltage sensor of Dr-VSP(DM) was examined by the sensing currents and voltage clamp fluorometry. Both the cumulative charge of the sensing current and the fluorescence decay at membrane potentials lower than 100 mV were fitted by the single exponential equation and those over 120 mV were fitted by the double exponential equation (3 and 5). On the other hand, the Q–V and F–V relationships of Dr-VSP(DM) were not consistent with each other; the Q–V curve consists of the first and second Boltzmann components (Fig. 3C), while the F–V curve has only the single Boltzmann component (Fig. 5B). In voltage clamp fluorometry, we found that fluorescence decays with fast and slow kinetics at higher voltages than 120 mV and also found that the amplitude of fluorescence reduction by fast kinetics decreases at higher voltages than 120 mV where the second Boltzmann component appeared in the Q–V curve (Fig. 5B and C). This decrease may cancel out the increase of fluorescence decay which corresponds to the second Boltzmann component of the F–V curve.
formula 2 used for fitting to Q–V relationships assumes that the voltage sensor moves sequentially in two stages. Because coefficients of both exponentials are represented by the ratio of the effective valencies of the two Boltzmann equations, z0/(z0 + z1) and z1/(z0 + z1), this equation requires that the increase of the effective valency of the second Boltzmann component (z1) results in an increase of the contribution of the second Boltzmann equation (z1/(z0 + z1)). In all of the PBM mutants and enzyme-defective mutants as well as Dr-VSP(DM), the Q–V relationship was successfully fitted by formula 2. This supports the idea that the voltage sensor of Dr-VSP(DM) goes through the intermediate state to be the fully activated state. Assuming the intermediate state, we built a linear three-state model (Fig. 9A). This model was successfully fitted to the QOFF–V relationship of Dr-VSP(DM) (Fig. 9B). This also indicates that the voltage sensor of Dr-VSP(DM) has a stable intermediate state.
Coupling between the voltage sensor and the phosphatase activity
Our studies of the voltage sensor and the phosphatase activity of Dr-VSP(DM) suggested that full activation of the voltage sensor is not needed for phosphatase activity, and the phosphatase activity at the single protein level could show graded dependence upon the magnitude of the movement of the voltage sensor (Fig. 9C). What kinds of states of the voltage sensor can trigger the phosphatase activity? Tao et al. have suggested that the arginine residue, R1, at the top of S4 is located near the phenylalanine residue of S2 in the resting state, and that R2, R3, R4 and K5 sequentially occupy the resting position of R1 upon upward motion of the voltage sensor from the resting state to the activated state (Tao et al. 2010). If the movement of the voltage sensor of VSP is similar to that of the Kv channel, these individual states of the voltage sensor may lead to distinct magnitudes of the phosphatase activity in VSP. This means that the phosphatase domain can have several distinct states which exhibit different magnitudes of the phosphatase activity.
Recent X-ray crystallographic study has shown several structures of cytoplasmic domain of Ci-VSP (Liu et al. 2012). In some forms (closed forms), the side chain of Glu411 is positioned near the active centre, and in other forms (open forms), the side chain of Glu411 is away from the active centre and makes a larger substrate binding pocket than in the closed forms. This study raises the possibility that the voltage sensor movement regulates the conformational change between open and closed forms of the enzymatic domain. On the other hand, our results suggest that enzymatic activity is graded. The magnitude of the phosphatase activity may be proportional to that of the movement of the voltage sensor. Another idea of the coupling mechanism is that the voltage sensor regulates the accessibility to phosphoinositides by changing the orientation and/or distance of the enzymatic domain toward plasma membrane. Studies on the voltage-dependent conformation changes of enzymatic domain would provide further insight into the coupling mechanisms between the voltage sensor and the phosphatase activity.
Key points
The voltage-sensing phosphatase (VSP) consists of the voltage sensor and the phosphatase domain. The voltage sensor movement is coupled to the phosphatase activity.
To uncover the coupling mechanisms between the two domains, we made a voltage sensor mutant of VSP. Our analyses showed that this voltage sensor moves in two steps.
Measurements revealed that the phosphatase activity of this mutant is associated with both the first and second step of the voltage sensor movements.
Results suggest that the phosphatase activity of VSP shows graded dependence on the extent of activation of the voltage sensor.
Acknowledgments
We thank Dr Diomedes E. Logothetis (Virginia Commonwealth University, USA) for giving us the Kir3.4 plasmid and also thank Dr Yoshihiro Kubo (National Institute for Physiological Sciences, Okazaki, Japan) for providing the Kir2.1 plasmid. We are grateful to lab members for helpful discussion. We appreciate the critical reading of our manuscript by Dr Laurinda Jaffe (University of Connecticut, CT, USA).
Glossary
- Ci-VSP
Ciona intestinalis voltage-sensing phosphatase
- Dr-VSP(DM)
double mutant of zebrafish voltage-sensing phosphatase
- GFP
green fluorescent protein
- PBM
phosphoinositide binding motif
- PH
pleckstrin homology domain
- PI
phosphoinositide
- PI(3,4)P2
phosphatidylinositol-3,4-bisphosphate
- PI(4,5)P2
phosphatidylinositol-4,5-bisphosphate
- PI(3,4,5)P3
phosphatidylinositol-3,4,5-trisphosphate
- PLC
phospholipase C
- PTEN
phosphatase and tensin homologue deleted on chromosome 10
- VSP
voltage-sensing phosphatase
Additional information
Competing interests
None declared.
Author contributions
S.S. and Y.O. designed the experiments and wrote the paper. S.S. performed the experiments.
Funding
This work was supported by grants from the Grant-in-Aid for Scientific Research (S.S. and Y.O.) and the Targeted Proteins Research Program (Y.O.).
References
- Drummond GB. Reporting ethical matters in The Journal of Physiology: standards and advice. J Physiol. 2009;587:713–719. doi: 10.1113/jphysiol.2008.167387. [DOI] [PMC free article] [PubMed] [Google Scholar]
- Goldin AL. Maintenance of Xenopus laevis and oocyte injection. Methods Enzymol. 1992;207:266–279. doi: 10.1016/0076-6879(92)07017-i. [DOI] [PubMed] [Google Scholar]
- Hobiger K, Utesch T, Mroginski MA, Friedrich T. Coupling of Ci-VSP modules requires a combination of structure and electrostatics within the linker. Biophys J. 2012;102:1313–1322. doi: 10.1016/j.bpj.2012.02.027. [DOI] [PMC free article] [PubMed] [Google Scholar]
- Hossain MI, Iwasaki H, Okochi Y, Chahine M, Higashijima S, Nagayama K, Okamura Y. Enzyme domain affects the movement of the voltage sensor in ascidian and zebrafish voltage-sensing phosphatases. J Biol Chem. 2008;283:18248–18259. doi: 10.1074/jbc.M706184200. [DOI] [PubMed] [Google Scholar]
- Iwasaki H, Murata Y, Kim Y, Hossain MI, Worby CA, Dixon JE, McCormack T, Sasaki T, Okamura Y. A voltage-sensing phosphatase, Ci-VSP, which shares sequence identity with PTEN, dephosphorylates phosphatidylinositol 4,5-bisphosphate. Proc Natl Acad Sci U S A. 2008;105:7970–7975. doi: 10.1073/pnas.0803936105. [DOI] [PMC free article] [PubMed] [Google Scholar]
- Kohout SC, Bell SC, Liu L, Xu Q, Minor DL, Jr, Isacoff EY. Electrochemical coupling in the voltage-dependent phosphatase Ci-VSP. Nat Chem Biol. 2010;6:369–375. doi: 10.1038/nchembio.349. [DOI] [PMC free article] [PubMed] [Google Scholar]
- Kohout SC, Ulbrich MH, Bell SC, Isacoff EY. Subunit organization and functional transitions in Ci-VSP. Nat Struct Mol Biol. 2008;15:106–108. doi: 10.1038/nsmb1320. [DOI] [PubMed] [Google Scholar]
- Kurokawa T, Takasuga S, Sakata S, Yamaguchi S, Horie S, Homma KJ, Sasaki T, Okamura Y. 3′ Phosphatase activity toward phosphatidylinositol 3,4-bisphosphate [PI(3,4)P2] by voltage-sensing phosphatase (VSP) Proc Natl Acad Sci U S A. 2012;109:10089–10094. doi: 10.1073/pnas.1203799109. [DOI] [PMC free article] [PubMed] [Google Scholar]
- Lacroix J, Bezanilla F. Tuning the voltage-sensor motion with a single residue. Biophys J. 2012;103:L23–L25. doi: 10.1016/j.bpj.2012.06.030. [DOI] [PMC free article] [PubMed] [Google Scholar]
- Liu L, Kohout SC, Xu Q, Muller S, Kimberlin CR, Isacoff EY, Minor DL., Jr A glutamate switch controls voltage-sensitive phosphatase function. Nat Struct Mol Biol. 2012;19:633–641. doi: 10.1038/nsmb.2289. [DOI] [PMC free article] [PubMed] [Google Scholar]
- Liu Y, Bankaitis VA. Phosphoinositide phosphatases in cell biology and disease. Prog Lipid Res. 2010;49:201–217. doi: 10.1016/j.plipres.2009.12.001. [DOI] [PMC free article] [PubMed] [Google Scholar]
- Maehama T, Taylor GS, Dixon JE. PTEN and myotubularin: novel phosphoinositide phosphatases. Annu Rev Biochem. 2001;70:247–279. doi: 10.1146/annurev.biochem.70.1.247. [DOI] [PubMed] [Google Scholar]
- Matsuda M, Takeshita K, Kurokawa T, Sakata S, Suzuki M, Yamashita E, Okamura Y, Nakagawa A. Crystal structure of the cytoplasmic phosphatase and tensin homolog (PTEN)-like region of Ciona intestinalis voltage-sensing phosphatase provides insight into substrate specificity and redox regulation of the phosphoinositide phosphatase activity. J Biol Chem. 2011;286:23368–23377. doi: 10.1074/jbc.M110.214361. [DOI] [PMC free article] [PubMed] [Google Scholar]
- Murata Y, Iwasaki H, Sasaki M, Inaba K, Okamura Y. Phosphoinositide phosphatase activity coupled to an intrinsic voltage sensor. Nature. 2005;435:1239–1243. doi: 10.1038/nature03650. [DOI] [PubMed] [Google Scholar]
- Murata Y, Okamura Y. Depolarization activates the phosphoinositide phosphatase Ci-VSP, as detected in Xenopus oocytes coexpressing sensors of PIP2. J Physiol. 2007;583:875–889. doi: 10.1113/jphysiol.2007.134775. [DOI] [PMC free article] [PubMed] [Google Scholar]
- Okamura Y, Dixon JE. Voltage-sensing phosphatase: its molecular relationship with PTEN. Physiology (Bethesda) 2011;26:6–13. doi: 10.1152/physiol.00035.2010. [DOI] [PubMed] [Google Scholar]
- Sadja R, Smadja K, Alagem N, Reuveny E. Coupling Gβγ-dependent activation to channel opening via pore elements in inwardly rectifying potassium channels. Neuron. 2001;29:669–680. doi: 10.1016/s0896-6273(01)00242-2. [DOI] [PubMed] [Google Scholar]
- Sakata S, Hossain MI, Okamura Y. Coupling of the phosphatase activity of Ci-VSP to its voltage sensor activity over the entire range of voltage sensitivity. J Physiol. 2011;589:2687–2705. doi: 10.1113/jphysiol.2011.208165. [DOI] [PMC free article] [PubMed] [Google Scholar]
- Sasaki T, Takasuga S, Sasaki J, Kofuji S, Eguchi S, Yamazaki M, Suzuki A. Mammalian phosphoinositide kinases and phosphatases. Prog Lipid Res. 2009;48:307–343. doi: 10.1016/j.plipres.2009.06.001. [DOI] [PubMed] [Google Scholar]
- Tao X, Lee A, Limapichat W, Dougherty DA, MacKinnon R. A gating charge transfer centre in voltage sensors. Science. 2010;328:67–73. doi: 10.1126/science.1185954. [DOI] [PMC free article] [PubMed] [Google Scholar]
- Villalba-Galea CA, Miceli F, Taglialatela M, Bezanilla F. Coupling between the voltage-sensing and phosphatase domains of Ci-VSP. J Gen Physiol. 2009;134:5–14. doi: 10.1085/jgp.200910215. [DOI] [PMC free article] [PubMed] [Google Scholar]
- Villalba-Galea CA, Sandtner W, Starace DM, Bezanilla F. S4-based voltage sensors have three major conformations. Proc Natl Acad Sci U S A. 2008;105:17600–17607. doi: 10.1073/pnas.0807387105. [DOI] [PMC free article] [PubMed] [Google Scholar]
- Vivaudou M, Chan KW, Sui JL, Jan LY, Reuveny E, Logothetis DE. Probing the G-protein regulation of GIRK1 and GIRK4, the two subunits of the KACh channel, using functional homomeric mutants. J Biol Chem. 1997;272:31553–31560. doi: 10.1074/jbc.272.50.31553. [DOI] [PubMed] [Google Scholar]
- Zhang H, He C, Yan X, Mirshahi T, Logothetis DE. Activation of inwardly rectifying K+ channels by distinct PtdIns(4,5)P2 interactions. Nat Cell Biol. 1999;1:183–188. doi: 10.1038/11103. [DOI] [PubMed] [Google Scholar]
Associated Data
This section collects any data citations, data availability statements, or supplementary materials included in this article.


