

Abstract
Natriuretic peptides, including B-type and C-type natriuretic peptide (BNP and CNP), are powerful regulators of the cardiovascular system; however, their electrophysiological effects in the heart, particularly in the sinoatrial node (SAN), are incompletely understood. We have used high-resolution optical mapping to measure the effects of BNP and CNP, and the roles of natriuretic peptide receptors (NPR-A, NPR-B and NPR-C), on electrical conduction within the SAN and atrial myocardium. In basal conditions BNP and CNP (50–500 nm) increased conduction velocity (CV) within the SAN by ∼30% at the high dose and shifted the initial exit site superiorly. These effects sped conduction from the SAN to the surrounding atrial myocardium and were mediated by the NPR-A and NPR-B receptors. In the presence of isoproterenol (1 μm) the NPR-C receptor made a major contribution to the effects of BNP and CNP in the heart. In these conditions BNP, CNP and the NPR-C agonist cANF each decreased SAN CV and shifted the initial exit site inferiorly. The effects of cANF (30% reduction) were larger than BNP or CNP (∼15% reduction), indicating that BNP and CNP activate multiple natriuretic peptide receptors. In support of this, the inhibitory effects of BNP were absent in NPR-C knockout mice, where BNP instead elicited a further increase (∼25%) in CV. Measurements in externally paced atrial preparations demonstrate that the effects of natriuretic peptides on CV are partially independent of changes in cycle length. These data provide detailed novel insight into the complex effects of natriuretic peptides and their receptors on electrical conduction in the heart.
Introduction
Natriuretic peptides (NPs) are powerful and important regulators of the cardiovascular system. These peptide hormones, including atrial (ANP), B-type (BNP) and C-type (CNP) NPs, are best known for their ability to regulate blood volume and blood pressure by causing natriuresis and diuresis as well as by controlling vascular tone (Levin et al. 1998; Kuhn, 2004; Potter et al. 2006). By regulating these critical physiological parameters NPs can importantly regulate cardiac output by affecting loading conditions on the heart. More recently, it has become apparent that NPs can also have direct effects on ion channels in the heart, including in the sinoatrial node (SAN). We have demonstrated that BNP and CNP can potently modulate action potential profiles and ion channels in SAN and atrial myocytes (Rose et al. 2004; Azer et al. 2012; Springer et al. 2012). These direct electrophysiological effects of NPs in the SAN result in changes in heart rate, which is also a critical determinant of cardiac output.
NPs elicit their effects by binding to specific NP receptors denoted NPR-A, NPR-B and NPR-C (Anand-Srivastava & Trachte, 1993; Lucas et al. 2000; Potter et al. 2006). NPR-A is activated by ANP and BNP while NPR-B is activated by CNP. Each of these receptors is associated with a membrane-bound guanylyl cyclase (GC) enzyme that increases the production of cyclic GMP (cGMP) when a peptide is bound. The NPR-C receptor is not directly associated with GC enzymes. Rather, NPR-C, which binds all NPs with similar affinity, activates inhibitory G-proteins (Gi) and reduces intracellular cyclic AMP (cAMP) levels (Anand-Srivastava et al. 1996; Pagano & Anand-Srivastava, 2001; Zhou & Murthy, 2003; Rose & Giles, 2008). We have shown that all three NPRs are expressed in the SAN and atrial myocardium and, depending on experimental conditions, can contribute to the regulation of ion channels in SAN and atrial myocytes. Specifically, we have demonstrated that NPR-A and NPR-B cause increases in heart rate, whereas NPR-C mediates a reduction in heart rate. (Rose et al. 2004; Azer et al. 2012; Springer et al. 2012).
The SAN is a highly specialized and complex structure with a unique physiology compared to the surrounding atrial myocardium (Keith & Flack, 1907; Boyett et al. 2000; James, 2002, 2003; Liu et al. 2007; Fedorov et al. 2012). Pacemaker myocytes are distributed throughout the right atrial posterior wall in the region between the superior vena cava and the inferior vena cava (Boineau et al. 1988; Boyett et al. 2000; Dobrzynski et al. 2005). Changes in heart rate are known to be associated with changes in the region of the SAN exhibiting the dominant frequency of spontaneous activity (Boineau et al. 1988; Fedorov et al. 2012). To study SAN activation patterns and how electrical signals propagate within the SAN and from the SAN to the surrounding atrial myocardium one must use high-resolution optical mapping (Efimov et al. 2004; Herron et al. 2012). A major advantage of this technique is that it permits simultaneous measurement of activation patterns, electrical conduction and action potential morphology in a multicellular preparation.
In the present study we have used optical mapping techniques to study the effects of BNP and CNP on electrical conduction in the SAN and atrial myocardium. By using BNP (which binds NPR-A and NPR-C) and CNP (binds NPR-B and NPR-C) as agonists we were able to determine the roles of all three NPRs in different experimental conditions. Understanding how NPs affect electrical conduction within the specialized SAN and into the working atrial myocardium is essential because NPs are currently in use (Lee & Burnett, 2007) or in development (Rose, 2010) for the treatment of heart failure. Our data provide the first detailed description of how distinct NPRs determine the effects of NPs on activation patterns and electrical conduction within the SAN and atrial myocardium.
Methods
Ethical approval
This study utilized male wild-type C57Bl/6 mice (Charles River, St-Constant, Quebec, Canada) and mice lacking functional NPR-C−/− receptors (NPR-C−/−) (Jaubert et al. 1999) between the ages of 10 and 15 weeks. NPR-C−/− mice were initially obtained from The Jackson Laboratory (Bar Harbor, ME, USA) and are now maintained in a breeding colony at Dalhousie University where they have been backcrossed into the C56Bl/6 line for more than 15 generations. All experiments involving animals were in accordance with the regulations of the Canadian Council on Animal Care and were approved by The Dalhousie University Committee on Laboratory Animals.
Atrial preparation
A typical experimental preparation consisting of the SAN and surrounding atrial tissues is shown in Fig. 1. To isolate this preparation mice were administered a 0.2 ml intraperitoneal injection of heparin (1000 IU ml−1) to prevent blood clotting and were then anaesthetized by isoflurane inhalation and cervically dislocated. Hearts were rapidly excised into Krebs solution (35°C) containing (in mm): 118 NaCl, 4.7 KCl, 1.2 KH2PO4, 12.2 MgSO4, 1 CaCl2, 25 NaHCO3 and 11 glucose. This Krebs solution was bubbled with 95% O2/5% CO2 to maintain a pH of 7.4. The atria were dissected away from the ventricles and pinned in a dish with the endocardial surface facing upwards (towards the imaging equipment). The superior and inferior vena cavae were cut open so that the crista terminalis could be visualized. The SAN area is located in the intercaval region in the right atrial posterior wall adjacent to the crista terminalis (Mangoni & Nargeot, 2001; Verheijck et al. 2001; Liu et al. 2007; Azer et al. 2012; Springer et al. 2012).
Figure 1.
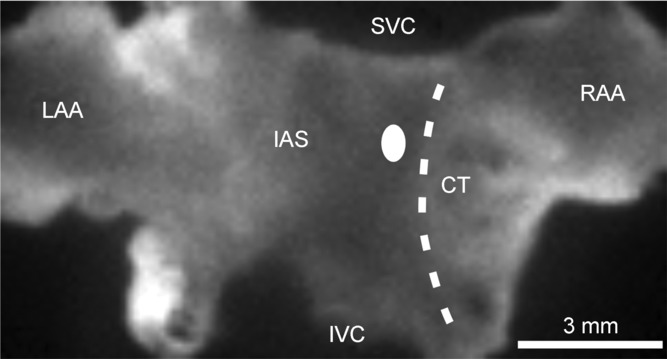
The preparation is orientated so that the right atrium is on the right side of the image. RAA, right atrial appendage; CT, crista terminalis; SVC, opening of superior vena cava; IVC, opening of inferior vena cava; IAS, interatrial septum; LAA, left atrial appendage. The sinoatrial node is located in the intercaval region adjacent to the CT. The white oval on the left side of the CT indicates the typical location of first electrical breakthrough in the sinoatrial node within the right atrial posterior wall.
The SAN/atrial preparation was superfused continuously with Krebs solution (35°C) bubbled with 95% O2/5% CO2 and allowed to equilibrate for at least 30 min. During this time the preparation was treated with the voltage-sensitive dye di-4-ANEPPS (10 μm) for ∼15 min and blebbistatin (10 μm) was added to the superfusate to suppress contractile activity (Fedorov et al. 2007; Farman et al. 2008; Lou et al. 2012). Blebbistatin was present throughout the duration of the experiments to prevent motion artifacts during optical mapping, which is necessary to measure optical action potentials. Most experiments were performed in sinus rhythm so that the cycle length (i.e. heart rate) of the atrial preparation was free to change. In a subset of studies we used a unipolar pacing electrode to pace atrial preparations at a fixed cycle length of 90 ms to study effects of pharmacological compounds on electrical conduction independently of changes in cycle length. This cycle length was chosen so that we would be able effectively to capture the preparations in all conditions, including in isoproterenol, which potently increases heart rate. When used, the pacing electrode was placed near the opening of the superior vena cava.
Optical mapping and data analysis
Optical signals from atrial preparations containing the SAN were measured using procedures similar to those we have described previously (Rose et al. 2011). Specifically, di-4-ANEPPS-loaded atrial preparations were illuminated with light at a wavelength of 520–570 nm using an EXFO X-cite fluorescent light source (Lumen Dynamics, Mississauga, Ontario, Canada). Emitted fluorescent light (590–640 nm) was captured using a high speed EMCCD camera (Evolve 128, Photometrics, Tucson, AZ, USA). This camera contains a 128 × 128 pixel array and, in our experimental setup, each pixel measured 77 × 77 μm, which results in a maximum field of view on the atrial preparation of ∼10 × 10 mm. Magnification was constant in all experiments and no pixel binning was used; thus, this pixel size remained constant in all measurements. Data were captured at a frame rate of ∼1000 frames s–1 using Metamorph software (Molecular Devices, Sunnyvale, CA, USA).
All optical data were analysed using custom software written in Matlab. Analyses included pseudocolour electrical activation maps and isochronal contour plots, which were generated from measurements of activation time at individual pixels. In all cases background fluorescence was subtracted. In some experiments we also generated optical action potential (OAP) data by measuring the change in fluorescence as a function of time at individual pixels at specific locations in the preparation including in the SAN (initial exit site in the intercaval region of the right atrial posterior wall) and in the working right atrial myocardium (measured in the right atrial appendage, RAA). OAP measurements were used to quantify action potential duration in the SAN and right atrium as well as the slope of the diastolic depolarization (DD) in the SAN. Action potential duration and DD slope measurements were averages from 8–10 consecutive OAPs in a given condition at each location. DD slope was measured by fitting this phase with a straight line and determining its slope, which we quantified as a relative change in fluorescence units per ms (ΔF ms–1). No attempt was made to calibrate changes in fluorescence to voltage measurements. Only relative changes in fluorescence were assessed before and after application of pharmacological compounds. OAPs were low pass filtered to reduce noise. Local conduction velocity (CV) was quantified specifically in the SAN (at the site of initial breakthrough), right atrial myocardium (within the RAA), or left atrial myocardium (at the border of left atrial appendage) using an established approach previously described (Morley et al. 1999; Nygren et al. 2004). Briefly, activation times at each pixel from a 7 × 7 pixel array were determined and fit to a plane using the least squares fit method. The direction on this plane that is increasing the fastest represents the direction that is perpendicular to the wavefront of electrical propagation and the maximal slope represents the inverse of the speed of conduction in that direction. Thus, using this method, we computed maximum local CV vectors in the atrial region of interest.
Pharmacological compounds
BNP, CNP, cANF and A71915 were obtained from Bachem (Torrance, CA, USA) while AP-811 was obtained from California Peptide (Napa, CA, USA). Each was dissolved in water and stored at –80°C until added to Krebs solution for experimental use. Isoproterenol (ISO) was obtained from Sigma Chemical Company (St Louis, MO, USA). Di-4-ANEPPS was obtained from Invitrogen (Carlsbad, CA, USA), dissolved in dimethyl sulfoxide (DMSO) and stored at –80°C until it was dissolved in Krebs solution during experiments (final DMSO concentration was 0.1%). Blebbistatin was obtained from Tocris Bioscience (Ellisville, MO, USA), dissolved in DMSO and added to Krebs solution at the time of experimental use (final DMSO concentration was 0.1%).
Statistical analysis
All summary data are presented as means ± SEM. Data were analysed using a paired Student's t-test or one-way analysis of variance (ANOVA) with Tukey's post hoc analysis. P < 0.05 was considered significant.
Results
Optical mapping of atrial preparations containing the SAN
Initially, we sought to confirm the stability of our atrial preparations during optical mapping studies. This was done by first measuring the effects of blebbistatin (10 μm) on electrical conduction and cycle length in atrial preparations stained with di-4-ANNEPS (Supplemental Fig. 1). These data demonstrate that blebbistatin had no effect on activation pattern, SAN CV (5.9 ± 0.2 vs. 5.7 ± 0.2 cm s−1; P = 0.374) or cycle length (142.4 ± 3.9 vs. 142 ± 4.1 ms; P = 0.698) based on measurements in control conditions and after 45 min of blebbistatin treatment. Next, we measured cycle length in the presence of blebbistatin every 5 min for 45 min (Supplemental Fig. 1D). These data show that cycle length (i.e. heart rate) remained very stable (∼140 ms) for at least 45 min.
To study and compare the effects of natriuretic peptides on SAN and atrial conduction it was essential to confirm our ability to optically map the SAN region in our mouse atrial preparations. Representative activation maps in control conditions demonstrate that the site of initial electrical breakthrough in the SAN was located in the right atrial posterior wall adjacent to the crista terminalis. We refer to this site as the ‘initial exit site’ in the SAN (as opposed to ‘leading pacemaker site’) due to the three-dimensional nature of electrical propagation in the SAN and surrounding atrial myocardium as well as the presence of preferential conduction pathways within the heterogeneous SAN region of the heart (Fedorov et al. 2012). In control conditions this initial exit site was somewhat variable. In the majority of preparations it was located towards the superior region of the preparation (e.g. Fig. 2A and D), but in some cases was located in the inferior region of the preparation (see Fig. 4A). This is comparable to previous studies demonstrating that the SAN can extend from the superior vena cava to the inferior cava in mice (Bleeker et al. 1980; Boyett et al. 2000; Liu et al. 2007). Despite the variability in location from superior to inferior the initial exit site was always in the intercaval region of the right atrium adjacent to the crista terminalis, as expected for the mammalian heart (Verheijck et al. 2001; Nygren et al. 2004; Fedorov et al. 2006; Liu et al. 2007; Glukhov et al. 2010). From the initial exit site, electrical activity spread to the rest of the atrial tissues. Propagation into the right atrial appendage was uniform and radial. Conversely, a block zone (Boyett et al. 2000; Fedorov et al. 2012), in which propagation was slowed towards the atrial septum, was typically seen on the left side of the initial exit site (see Fig. 2A and D for examples). This block zone is evident from the crowding of contour lines to the left of the initial exit site in colour maps and resulted in propagation toward the left atrium occurring preferentially via the inferior region of the preparation.
Figure 2.
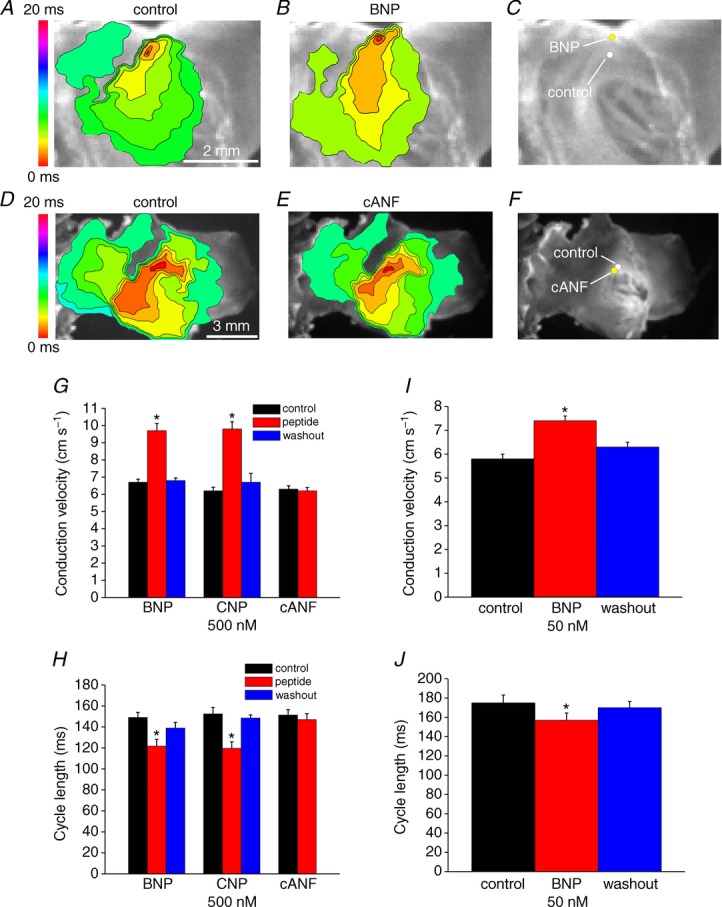
A and B, representative colour maps showing activation patterns in control conditions and after application of BNP (500 nm). In these and all subsequent figures the right atrial appendage is on the right side of the image. Red colour indicates earliest activation time (ms) within the right atrial posterior wall. C, application of BNP caused a superior shift in initial exit site within the SAN. D and E, representative colour maps showing activation patterns in control conditions and after application of the NPR-C agonist cANF (500 nm). F, application of cANF had no effect on initial exit site in basal conditions. G, summary of the effects of BNP, CNP and cANF (500 nm each) on conduction velocity in the leading pacemaker site. H, summary of the effects of BNP, CNP and cANF (500 nm) on cycle length. I, summary of the effect of BNP (50 nm) on conduction velocity in the leading pacemaker site. J, summary of the effects of BNP (50 nm) on cycle length. Time interval between isochrones in activation maps is 1.1 ms. *P < 0.05 vs. control by one-way ANOVA with Tukey's post hoc test; n = 7 hearts each for the BNP and CNP groups and n = 5 hearts for the cANF group.
Figure 4.

A and B, representative colour maps showing the pattern of electrical conduction into the right atrial appendage in control conditions and after application of BNP (500 nm). Time interval between isochrones is 1.2 ms. C and D, representative colour maps showing activation pattern in the right atrial appendage in control conditions and after application of cANF (500 nm). Time interval between isochrones is 1.1 ms. E, summary of the effects of BNP, CNP and cANF (500 nm each) on conduction velocity in the right atrial appendage. F, summary of the effect of BNP (50 nm) on right atrial conduction velocity. G, representative optical action potentials from the right atrial appendage in control conditions and after application of BNP (500 nm). Horizontal dotted line is shown through the resting membrane potential. H and I, summary data illustrating the effects of BNP, CNP and cANF (500 nm each) on right atrial APD50 and APD90. *P < 0.05 vs. control by one-way ANOVA with Tukey's post hoc test (E and F) or paired Student's t-test (H and I); n = 5–7 hearts in each group.
Effects of NPs on electrical activity in basal conditions
Initial NP experiments measured the effects of BNP, CNP and cANF (50–500 nm) on electrical conduction in the right atrial posterior wall, including the SAN region, in basal conditions. These measurements were performed in atrial preparations in sinus rhythm. The partially ring-deleted peptide cANF is a selective agonist of NPR-C (Anand-Srivastava et al. 1990; Rose & Giles, 2008). Representative activation maps (Fig. 2A and B) demonstrate that BNP sped conduction (note fewer isochrones and increased distance between isochrones in the presence of BNP) in association with a superior shift in the initial exit site (Fig. 2C). On average BNP increased (P < 0.05) CV in the initial exit site from 6.7 ± 0.2 to 9.7 ± 0.4 cm s−1 (Fig. 2G). BNP also shortened (P < 0.05) cycle length from 149 ± 4.8 to 121.7 ± 6.5 ms (Fig. 2H). CNP (500 nm) elicited very similar increases (P < 0.05) in CV in the initial exit site (6.2 ± 0.2 cm s−1 in control vs. 9.8 ± 0.4 cm s−1; Fig. 2G) and decreases (P < 0.05) in cycle length (152.4 ± 6.2 ms in control vs. 119.6 ± 6.3 ms in CNP; Fig. 2H). The superior shift in initial exit site was observed in all hearts treated with BNP or CNP (14 hearts in total). Furthermore, we did not observe beat to beat variations in initial exit site in control conditions or after application of NPs. We also measured the effects of a lower dose of BNP (50 nm) on SAN CV and cycle length. At this dose BNP was nearly as effective as the higher dose, whereby CV was increased (P < 0.05) from 5.8 ± 0.2 to 7.4 ± 0.1 cm s−1 (Fig. 2I) and cycle length was decreased (P < 0.05) from 175 ± 8.1 to 157 ± 7.5 ms (Fig. 2J). The effects of BNP and CNP on SAN activation patterns, initial exit site and CV were fully reversible on washout (Fig. 2G–J).
In contrast to BNP and CNP, cANF (500 nm) had no effect on activation pattern (Fig. 2D and E) or location of the initial exit site in the right atrial posterior wall (Fig. 2F). Average CVs were 6.3 ± 0.2 cm s−1 in control and 6.2 ± 0.2 cm s−1 after application of cANF (Fig. 2G; P = 0.85) while cycle length was 151.3 ± 5.2 ms in control and 147 ± 5.7 ms in cANF (Fig. 2J; P = 0.99). Note that the CVs measured in the SAN (Fig. 2) are relatively low, as expected, and very comparable in magnitude to those reported by others (Bleeker et al. 1980; Verheijck et al. 2001; Fedorov et al. 2006).
To further evaluate the effects of NPs on SAN activity in basal conditions we measured OAPs from the leading activation site following application of BNP, CNP and cANF (500 nm). Representative spontaneous OAPs from the SAN are illustrated in control conditions and following application of BNP (500 nm; Fig. 3A) or cANF (500 nm; Fig. 3B). As expected for the SAN, action potentials from this location were always characterized by the presence of a DD phase between successive spontaneous action potentials (see Methods). BNP increased (P < 0.05) the DD slope from 0.03 ± 0.001 to 0.06 ± 0.003 ΔF ms−1 (Fig. 3C), which resulted in a shortening of the diastolic interval between successive OAPs (Fig. 3A). Similarly, CNP increased (P < 0.05) the DD slope from 0.04 ± 0.002 to 0.07 ± 0.003 ΔF ms−1 (Fig. 3C). The NPR-C agonist cANF, on the other hand, had no effect (P = 0.74) on DD slope (0.032 ± 0.002 ΔF ms−1 vs. 0.031 ± 0.002 ΔF ms−1; Fig. 3C) and OAPs overlapped (Fig. 3B).
Figure 3.
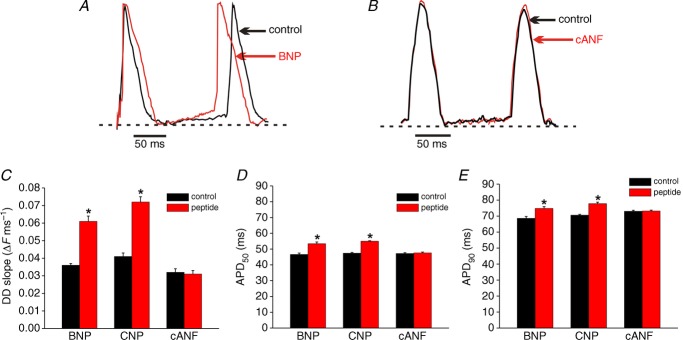
Representative spontaneous optical action potentials from the initial exit site in the SAN are presented in control conditions and after application of BNP (500 nm, A) or the NPR-C agonist cANF (500 nm, B). Dotted horizontal lines are shown through the maximum diastolic potential. Summary data illustrate the effects of BNP, CNP and cANF (each at 500 nm) on DD slope (C), APD50 (D) and APD90 (E) in the SAN. *P < 0.05 vs. control by paired Student's t-test; n = 5 hearts in each group.
We also analysed the effects of BNP, CNP and cANF on OAP duration at 50% (APD50) and 90% (APD90) repolarization in basal conditions (Fig. 3D and E). BNP and CNP each increased (P < 0.05) APD50 (46.6 ± 0.9 ms in control vs. 53.4 ± 1.1 ms in BNP; 47.4 ± 0.5 ms in control vs. 55 ± 0.3 ms in CNP) and APD90 (68.6 ± 1.2 ms in control vs. 74.8 ± 1.1 ms in BNP; 70.6 ms in control vs. 77.8 ± 0.9 ms in CNP). Conversely, cANF had no effect (P = 0.18) on APD50 (47.2 ± 0.5 vs. 47.6 ± 0.5 ms) or APD90 (73 ± 0.6 vs. 73.2 ± 0.5 ms).
Next, the effects of BNP, CNP and cANF (50–500 nm) on conduction into the right atrial appendage in basal conditions were measured in atrial preparations in sinus rhythm (Fig. 4). Representative activation maps (Fig. 4A and B) illustrate the pattern of electrical propagation from initial exit site into the right atrial appendage in control conditions and after application of BNP. In this example, the initial exit site in control conditions was located on the inferior side of the preparation. BNP again shifted the initial exit site in the superior direction and sped conduction into the right atrium. On average, BNP (500 nm) increased (P < 0.05) CV in the right atrial appendage from 35.3 ± 0.4 to 42.5 ± 1.4 cm s−1. CNP (500 nm) had very similar effects to BNP and increased (P < 0.05) atrial CV from 36.3 ± 0.8 to 41.3 ± 0.7 cm s−1 (Fig. 4E). The lower dose of BNP (50 nm) increased (P < 0.05) atrial CV from 37.2 ± 1.9 to 43 ± 1.1 cm s−1, further demonstrating that the low dose of BNP is almost as effective as the higher dose.
Representative activation maps illustrating the effects of cANF on conduction in the right atrial appendage are shown in Fig. 4C and D. These examples focused specifically on the atrial appendage, and the initial exit site within the right atrial posterior wall is outside the field of view. Consistent with the absence of effects of cANF in the SAN in basal conditions (Fig. 2) activation pattern and conduction time into the right atrial appendage were unaffected by cANF. Right atrial CV was unaltered (P = 0.94) following application of cANF (38 ± 0.2 vs. 38.1 ± 0.2 cm s−1). Note that these right atrial CVs are consistent with prior studies (Nygren et al. 2004; Swaminathan et al. 2011) and are much faster than those measured in the SAN.
The effects of BNP, CNP and cANF on action potential duration in basal conditions in the right atrium were also measured. Representative recordings from the right atrial appendage (Fig. 4G) demonstrate that, in contrast to the SAN, atrial OAPs have stable resting membrane potentials. Furthermore, summary data demonstrate that APD50 (Fig. 4H) and APD90 (Fig. 4J) values in the right atrium in control conditions are shorter than those in the SAN (compare to Fig. 3D and E). These observations are consistent with prior studies (Boyett et al. 2000; Nygren et al. 2004; Fedorov et al. 2006; Springer et al. 2012) and further confirm our ability to accurately and distinctly map the SAN and atrial myocardium. On average, neither BNP (P = 0.38), CNP (P = 0.18) nor cANF (P = 0.37) had any effect on right atrial action potential duration in these conditions.
Effects of NPs on electrical conduction in basal conditions in paced atrial preparations
The above experiments demonstrate that, in basal conditions, BNP and CNP potently decrease cycle length (i.e. increase heart rate), which is consistent with our recent findings in isolated hearts and SAN myocytes (Azer et al. 2012; Springer et al. 2012). To determine if the effects of NPs on activation patterns and electrical conduction are independent of changes in cycle length we measured the effects of CNP (50 nm) in atrial preparations paced at a fixed cycle length of 90 ms (see Methods). These data (Fig. 5) demonstrate that CNP increased (P < 0.05) SAN CV from 6.1 ± 0.2 to 7.2 ± 0.2 cm s−1, independently of a change in cycle length. The magnitude of this increase (∼15%) was smaller than that seen with application of the same dose of BNP (50 nm) in atrial preparations in sinus rhythm (∼30%) where cycle length was free to change, indicating that the effects of NPs on SAN CV in basal conditions are partially independent of cycle length. In contrast, although there was a trend toward a small increase in right atrial CV following application of CNP in paced atrial preparations (40.1 ± 1.7 cm s−1 in control vs. 43 ± 1.4 cm s−1 after CNP) this did not reach statistical significance (P = 0.1). In these experiments using paced atrial preparations we also measured left atrial CV. Similarly to the right atrium, there was a trend towards a small increase in left atrial CV (42.6 ± 1.6 cm s−1 in control vs. 46.1 ± 2 cm s−1 in CNP) that did not reach statistical significance (P = 0.13). These data suggest that the increases in right atrial CV seen in atrial preparations in sinus rhythm (in basal conditions) are primarily rate dependent.
Figure 5.
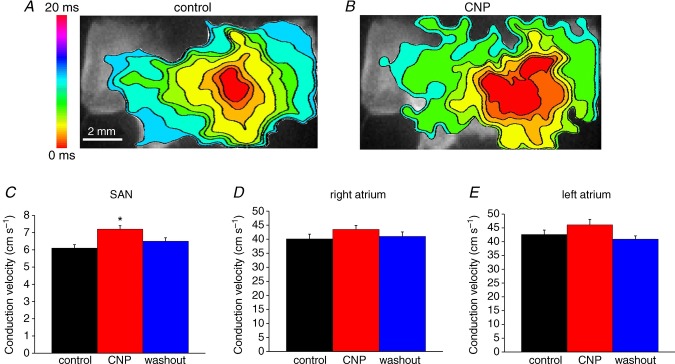
In this experiment atrial preparations were mapped from initial electrical breakthrough in the right atrial posterior wall into the right atrial appendage and into the left atrial appendage. Atrial preparations were paced at a fixed cycle length of 90 ms. A and B, representative colour maps showing activation patterns in control conditions and after application of CNP (50 nm). Time interval between isochrones is 1 ms. C and D, summary of the effects of CNP on conduction velocity in the SAN, right atrium and left atrium. *P < 0.05 vs. control by one-way ANOVA with Tukey's post hoc test; n = 5 hearts.
Effects of BNP on electrical conduction in the SAN and right atrium following NPR-A blockade
The observations that BNP and CNP increase conduction in the SAN and right atrium in basal conditions, but that the NPR-C agonist cANF has no effect on conduction in these conditions, suggests that the effects of BNP and CNP are mediated by NPR-A and NPR-B, respectively. To evaluate this hypothesis we measured the effects of BNP (500 nm) in the presence of the NPR-A antagonist A71915 (500 nm) (Delporte et al. 1992). Representative activation maps (Fig. 6A) illustrate the effects of A71915 and BNP on electrical conduction in the right atrial posterior wall and into the right atrial appendage. Neither A71915 nor BNP elicited any alterations in conduction time or initial exit site within the right atrial posterior wall. Average SAN CVs were 6.4 ± 0.1 cm s−1 in control, 6.6 ± 0.1 cm s−1 after application of A71915 and 6.5 ± 0.1 cm s−1 after application of BNP in the presence of A71915 (Fig. 6B). These data demonstrate that A71915 itself has no effect (P = 0.56) on SAN conduction velocity and, furthermore, the effects of BNP were completely antagonized (P = 0.56) following NPR-A blockade. Similar findings were observed in the right atrium. Specifically, CV in the right atrial appendage was 39 ± 0.6 cm s−1 in control conditions, 39 ± 1.1 cm s−1 in the presence of A71915 and 39.5 ± 1.1 cm s−1 after application of BNP in the presence of A71915 (Fig. 6C). These data demonstrate that the stimulatory effects of BNP on CV in the SAN and right atrium are NPR-A dependent (see Discussion).
Figure 6.
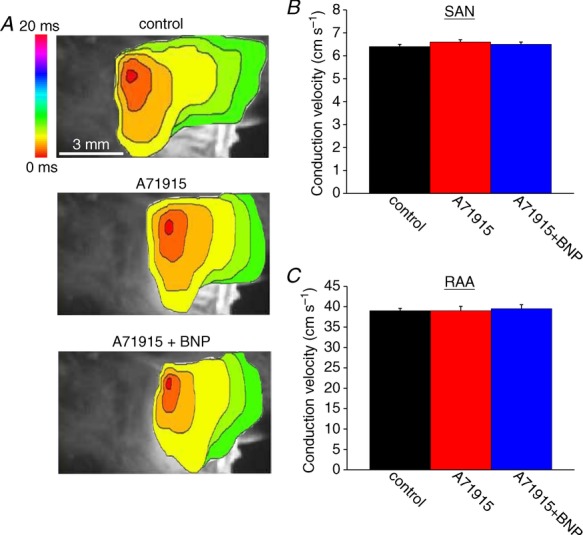
A, representative colour maps showing sinoatrial node and atrial activation patterns in control conditions, in the presence of the NPR-A antagonist A71915 (500 nm), and following application of BNP (500 nm) in the presence of A71915. Time interval between isochrones is 1 ms. Summary figures illustrate the effects of A71915 and BNP on conduction velocity in the SAN (B) and the right atrial myocardium (C). BNP had no effect on conduction velocity in the SAN or right atrium following NPR-A blockade with A71915. Data analysed by one-way ANOVA with Tukey's post hoc test; n = 5 hearts.
Effects of NPs on electrical activity in the SAN and right atrium in the presence of the β-adrenergic receptor agonist ISO
We have previously shown that NPR-C can mediate effects of NPs following activation of the β-adrenergic receptors (β-ARs) with ISO (Rose et al. 2004; Azer et al. 2012); therefore, the next series of experiments compared the effects of BNP, CNP and cANF (50–500 nm) on activation patterns and electrical conduction in the SAN and right atrium in the presence of ISO (1 μm). Representative activation maps (Fig. 7A–C) illustrate the patterns of electrical conduction in the right atrial posterior wall in control conditions, in the presence of ISO and after application of CNP in the presence of ISO. ISO consistently shifted the initial exit site in the superior direction (Fig. 7D) and sped conduction from this site through the right atrial posterior wall. Subsequent application of CNP counteracted the effects of ISO by slowing conduction and shifting the initial exit site in the inferior direction back toward that seen in control conditions (Fig. 7D). On average, SAN CV was increased (P < 0.05) from 5.8 ± 0.1 cm s−1 in control to 8.9 ± 0.2 cm s−1 in ISO. Application of BNP (500 nm) in the presence of ISO reduced (P < 0.05) SAN CV to 7.3 ± 0.2 cm s−1 (Fig. 7I). CNP (500 nm) had very comparable effects on SAN CV (4.9 ± 0.2 cm s−1 in control, 9.1 ± 0.4 cm s−1 in ISO, 7.8 ± 0.1 cm s−1 in ISO + CNP; P < 0.05; Fig. 7I). These changes in SAN CV occurred in association with changes in cycle length (Fig. 7J). ISO shortened cycle length (P < 0.05), as expected. Subsequent application of BNP or CNP opposed the effects of ISO and resulted in comparable increases (P < 0.05) in cycle length.
Figure 7.

Representative colour maps are shown in control conditions (A), in the presence of ISO (1 μm; B), and following application of CNP (500 nm) in the presence of ISO (C). Time interval between isochrones is 1 ms. D, location of the initial exit site in the right atrial posterior wall in control, ISO and ISO + CNP. E–H, representative colour maps and shifts in initial exit site within the SAN are illustrated in control conditions, in the presence of ISO (1 μm), and following application of cANF in the presence of ISO. Time interval between isochrones is 1 ms. I, summary of the effects of BNP, CNP and cANF (500 nm each) on conduction velocity in the SAN leading pacemaker site in the presence of ISO. J, summary of the effects of BNP, CNP and cANF (500 nm) on cycle length in the presence of ISO. K, summary of the effects of the NPR-C agonist cANF (50 nm) on conduction velocity in the SAN in the presence of ISO. L, summary of the effects of cANF (50 nm) on cycle length in the presence of ISO. *P < 0.05 vs. control; +P < 0.05 vs. ISO by one-way ANOVA with a Tukey post hoc test; n = 6 hearts for BNP, n = 7 hearts for CNP and n = 7 hearts for cANF.
Representative activation maps illustrating the effects of selective NPR-C activation with cANF in the presence of ISO in the right atrial posterior wall are presented in Fig. 7E–G. Again, ISO shifted the initial exit site in the superior direction (Fig. 7H) and sped electrical conduction out of this site. cANF opposed this ISO effect by shifting the initial exit site back in the inferior direction and slowing conduction. Summary data (Fig. 7J) demonstrate that SAN CV was increased (P < 0.05) from 6.0 ± 0.2 cm s−1 in control to 9.0 ± 0.1 cm s−1 in the presence of ISO. Subsequent application of cANF decreased (P < 0.05) SAN CV to 6.3 ± 0.2 cm s−1. On average, BNP and CNP (in the presence of ISO) similarly reduced SAN CV by 18 and 14%, respectively. In contrast, the reduction in SAN CV following selective activation of NPR-C with cANF in the presence of ISO was 30%, an effect that was larger (P < 0.05) than the effects of BNP and CNP. ISO and cANF also induced changes in cycle length. Specifically, ISO shortened cycle length from 144.1 ± 8.2 to 105.2 ± 3.9 ms. Subsequent application of cANF increased cycle length to 139.5 ± 8.2 ms. The increase in cycle length (in the presence of ISO) elicited by cANF (∼25%) was larger (P < 0.05) than the increases elicited by BNP (∼11%) and CNP (∼10%).
Finally, we measured the effects of lower 50 nm doses of cANF on SAN CV (Fig. 7K) and cycle length (Fig. 7L). On average, SAN CV was increased (P < 0.05) from 5.5 ± 0.1 cm s−1 in control to 8.2 ± 0.1 cm s−1 in ISO. Subsequent application of cANF (50 nM) reduced (P < 0.05) CV to 7.1 ± 0.2 cm s−1. Cycle length was reduced (P < 0.05) from 143 ± 15.5 ms in control to 92 ± 7.7 ms in ISO. Application of cANF (50 nm) in the presence of ISO increased (P < 0.05) cycle length to 106 ± 6.2 ms.
The effects of BNP, CNP and cANF (500 nm) on OAPs from the SAN in the presence of ISO (1 μm) are presented in Fig. 8. Representative SAN OAPs (Fig. 8A) in control conditions, in ISO and following application of CNP in the presence of ISO demonstrate changes in DD slope and action potential duration following treatment with these compounds, which resulted in clear changes in the diastolic interval between subsequent action potentials. Summary data (Fig. 8B) demonstrate that DD slope was increased (P < 0.05) from 0.05 ± 0.003 ΔF ms−1 in control conditions to 0.12 ± 0.006 ΔF ms−1. Application of CNP (in the presence of ISO) reduced (P < 0.05) DD slope to 0.1 ± 0.003 ΔF ms−1. BNP had very similar effects on DD slope in SAN OAPs (0.048 ± 0.002 ΔF ms−1 in control conditions, 0.098 ± 0.002 ΔF ms−1 in ISO, 0.077 ± 0.003 ΔF ms−1 after BNP; P < 0.05, Fig. 8B). Selective activation of NPR-C with cANF in the presence of ISO reduced (P < 0.05) DD slope from 0.11 ± 0.004 to 0.06 ± 0.003 ΔF ms−1. The average reductions in DD slope (in the presence of ISO) were 21 and 17% for BNP and CNP, respectively. In contrast, cANF caused a larger (P < 0.05) reduction in DD slope of 45%.
Figure 8.
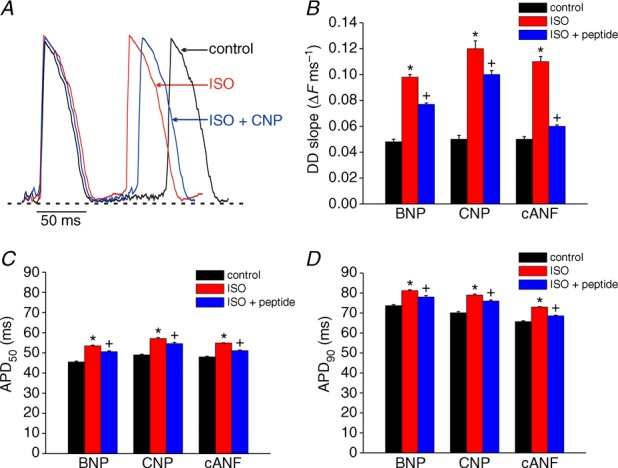
A, representative spontaneous OAPs from the initial exit site in the SAN are shown in control conditions, in the presence of ISO (1 μm) and following application of CNP (500 nm) in the presence of ISO. Summary data illustrate the effects of BNP, CNP and cANF (500 nm each) on DD slope (B), APD50 (C) and APD90 (D) in the SAN. *P < 0.05 vs. control; +P < 0.05 vs. ISO by one-way ANOVA with a Tukey post hoc test; n = 6 hearts for BNP, n = 7 hearts for CNP and n = 7 hearts for cANF.
The effects of BNP, CNP and cANF on APD50 and APD90 are illustrated in Fig. 8C and D. As expected, ISO increased APD50 and APD90 in the SAN. Summary data further demonstrate that BNP, CNP and cANF all opposed this effect of ISO and decreased (P < 0.05) APD50 and APD90. The percentage reductions in AP duration were similar (P = 0.37) for all three peptides.
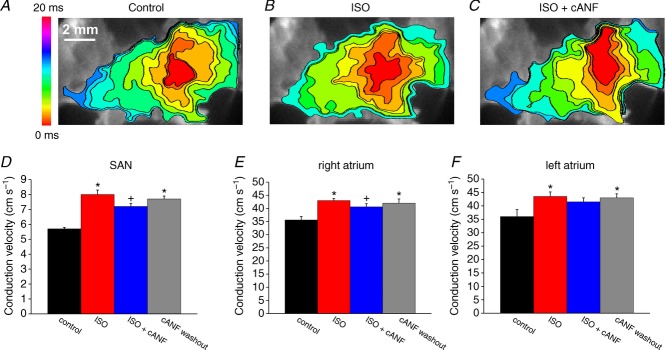
Figure 9 demonstrates the effects of BNP, CNP and cANF (50–500 nM) on electrical conduction into the right atrial appendage in the presence of ISO (1 μm). Representative activation maps (Fig. 9A–C) illustrate that ISO speeds conduction from the initial exit site into the right atrial appendage and that subsequent application of CNP opposes this effect of ISO. Consistent with our earlier findings (Fig. 7), ISO shifted the initial exit site in the superior direction while CNP (in the presence of ISO) shifted the initial exit site inferiorly. Average CVs in the right atrial appendage were increased (P < 0.05) from 37.5 ± 0.6 cm s−1 in control to 44.2 ± 0.8 cm s−1 in ISO. Application of CNP in the presence of ISO reduced (P < 0.05) right atrial CV to 39.4 ± 0.6 cm s−1 (Fig. 9G). BNP elicited very similar changes in right atrial conduction velocity (Fig. 9G).
Figure 9.

Representative colour maps showing patterns of electrical conduction into the right atrial appendage in control conditions (A), in the presence of ISO (1 μm; B), and following application of CNP (500 nm) in the presence of ISO (C). Time interval between isochrones is 1 ms. D–F, representative colour maps showing electrical conduction in the right atrial appendage in control conditions, in ISO, and following application of cANF (500 nM) in the presence of ISO. Time interval between isochrones is 1 ms. G, summary of the effects of BNP, CNP and cANF (500 nm each) on right atrial conduction velocity in the presence of ISO. H, summary of the effects of cANF (50 nm) on right atrial conduction velocity in the presence of ISO. I, representative optical action potentials in the right atrial appendage in control conditions, in the presence of ISO (1 μm) and after application of CNP (500 nm) in the presence of ISO. J and K, summary data illustrating the effects of BNP, CNP and cANF (500 nm each) on APD50 and APD90. *P < 0.05 vs. control; +P < 0.05 vs. ISO by one-way ANOVA with a Tukey post hoc test; n = 6 hearts for BNP, n = 7 hearts for CNP and n = 7 hearts for cANF.
Representative activation maps showing the effects of ISO and cANF specifically in the right atrial appendage (initial exit site not shown) are presented in Fig. 9D–F. In these experiments right atrial CV was increased (P < 0.05) from 36.9 ± 0.4 cm s−1 in control to 45.4 ± 0.5 cm s−1 in ISO. Subsequent application of cANF decreased (P < 0.05) CV to 37.9 ± 0.4 cm s−1 (Fig. 9G). Average reductions in right atrial CV elicited by BNP and CNP were 7 and 11%, respectively. Selective activation of NPR-C with cANF elicited a larger (P < 0.05) 17% reduction in right atrial CV. We also measured the effects of a lower dose of cANF (50 nm) on right atrial CV in the presence of ISO (Fig. 9H). At this dose cANF reduced (P < 0.05) ISO stimulated CV from 45.4 ± 1.0 to 42 ± 0.7 cm s−1.
The effects of BNP, CNP and cANF (500 nm) on right atrial action potential duration are presented in Fig. 9I–K. Representative right atrial OAPs (Fig. 9I) demonstrate APs with stable resting membrane potentials in control conditions, in the presence of ISO and following application of CNP in the presence of ISO. Summary data in Fig. 9J and K illustrate that ISO increased (P < 0.05) APD50 and APD90 in the right atrium. In contrast to basal conditions (Fig. 4) BNP, CNP and cANF each elicited reductions (P < 0.05) in APD50 and APD90 in the presence of ISO. The magnitude of the reductions in AP duration were similar (P = 0.83) for all three peptides.
Effects of NPs on electrical activity in the presence of ISO in paced atrial preparations
Next, we measured the effects cANF (50 nm) on electrical conduction in atrial preparations paced at a fixed cycle length (90 ms) to assess the effects of selective NPR-C activation independently of changes in cycle length. In these experiments (Fig. 10A) ISO increased (P < 0.05) SAN CV from 5.7 ± 0.1 to 8 cm s−1. Subsequent application of cANF decreased SAN CV to 7.2 ± 0.2 cm s−1. Right atrial CV (Fig. 10B) was increased (P < 0.05) from 35.6 ± 1.3 to 43 ± 0.8 cm s−1 in ISO. Application of cANF in the presence of ISO decreased (P < 0.05) right atrial CV to 40.6 ± 1.2 cm s−1. Together, these data demonstrate that, in the presence of ISO, NPs can decrease SAN and right atrial CV independently of changes in cycle length. We also measured changes in left atrial CV in these experiments. Similarly to the right atrium, ISO increased (P < 0.05) left atrial CV in paced atrial preparation from 36 ± 2.6 to 43.5 ± 1.7 cm s−1. Subsequent application of cANF modestly reduced (P = 0.41) left atrial CV to 41.5 ± 1.5 cm s−1.
Figure 10.
Atrial preparations were mapped from initial electrical breakthrough in the right atrial posterior wall into the right atrial appendage and into the left atrial appendage. Atrial preparations were paced at a fixed cycle length of 90 ms. A–C, representative colour maps showing activation patterns in control conditions (A), in the presence of ISO (B) and after application of cANF (50 nm) in the presence of ISO (C). Time interval between isochrones is 1 ms. D–E, summary of the effects of ISO and cANF on conduction velocity in the SAN, right atrium and left atrium. *P < 0.05 vs. control; +P < 0.05 vs. ISO by one-way ANOVA with Tukey's post hoc test; n = 5 hearts.
The inhibitory effects of cANF on SAN and right atrial conduction are blocked by the NPR-C antagonist AP-811
Our data clearly demonstrate that cANF causes a slowing of conduction in the SAN and right atrium when applied in the presence of ISO. To definitively prove the role of NPR-C in mediating this effect we utilized a potent peptide inhibitor of NPR-C, AP-811 (Veale et al. 2000; William et al. 2008). Figure 11A illustrates representative activation maps (from initial exit site through the right atrial posterior wall and into the right atrial appendage) in control conditions, in the presence of ISO (1 μm), after application of AP-811 (100 nm), and finally upon application of cANF (500 nm) in the presence of ISO and AP-811. Summary data (Fig. 11B) demonstrate that, as expected, ISO increased (P < 0.05) SAN CV from 4.9 ± 0.2 to 9.2 ± 0.2 cm s−1. Application of AP-811 to block NPR-C had no effect (P = 0.99) on its own on SAN CV (9.2 ± 0.2 cm s−1). Subsequent application of cANF in the presence of AP-811 also had no effect (P = 0.98) on SAN CV, which remained at 9.1 ± 0.2 cm s−1. Similar effects were observed in the right atrial appendage whereby the effects of cANF on right atrial CV were complete blocked by AP-811 (Fig. 11C). These findings demonstrate that cANF slows CV in the SAN and atrial myocardium by activating NPR-C.
Figure 11.
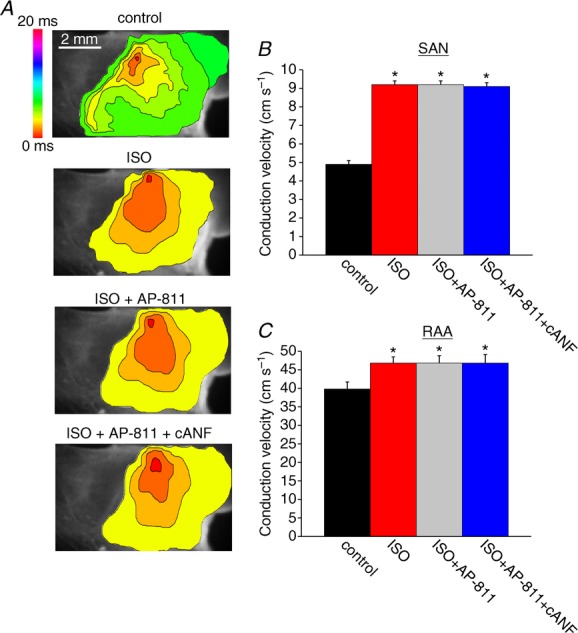
A, representative colour maps showing sinoatrial node and right atrial activation patterns in control conditions, in ISO (1 μm), in ISO with the NPR-C antagonist AP-811 (100 nm) and following application of cANF (500 nm) in the presence of ISO and AP-811. Time interval between isochrones is 1 ms. Summary data illustrate the effects of ISO, AP-811 and cANF on conduction velocity in the SAN (B) and right atrial myocardium (C). *P < 0.05 vs. control by one-way ANOVA with a Tukey post hoc test; n = 5 hearts. The effects of cANF on conduction velocity were completely antagonized by AP-811.
Effects of BNP on SAN and right atrial conduction in NPR-C−/− hearts
Native NPs, including BNP and CNP, are able to bind their guanylyl cyclase-linked NPR-A and NPR-B receptors as well as NPR-C (Potter et al. 2006). Our data demonstrate that in basal conditions, BNP and CNP increase conduction in the SAN and atria via the NPR-A/B receptors. In contrast, in the presence of ISO, BNP and CNP switch to eliciting decreases in conduction; however, the magnitude of these decreases is not as large as those observed when NPR-C is selectively activated with cANF. Accordingly, we hypothesized that, in the presence of ISO, BNP and CNP activate multiple receptors simultaneously and that NPR-C activation opposes the effects mediated by NPR-A and NPR-B. To test this hypothesis we measured the effects of ISO (1 μm) and BNP (500 nm) on SAN and right atrial conduction in NPR-C−/− hearts (Fig. 12). Without functional NPR-C receptors we hypothesized that BNP would only be able to activate NPR-A and would elicit a further increase (rather than a decrease) in conduction in the presence of ISO.
Figure 12.
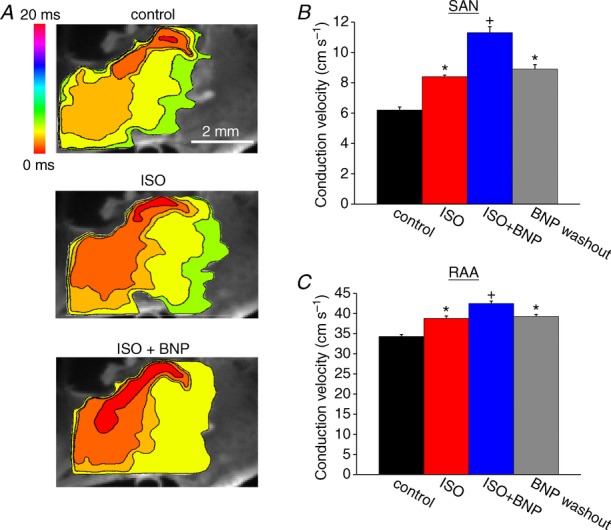
A, representative colour maps showing activation patterns in control conditions, in the presence of ISO (1 μm), and following application of BNP (500 nm) in the presence of ISO in NPR-C−/− hearts. Time interval between isochrones is 1.1 ms. Summary data illustrate the effects of ISO and BNP on conduction velocity in the SAN (B) and right atrial myocardium (C). *P < 0.05 vs. control; +P < 0.05 vs. ISO by one-way ANOVA with a Tukey post hoc test; n = 5 hearts.
Representative activation maps (Fig. 12A) and summary data (Fig. 12B and C) demonstrate that, in NPR-C−/− hearts, BNP speeds, rather than slows, conduction in the presence of ISO. ISO increased (P < 0.05) SAN CV from 6.2 ± 0.2 to 8.4 ± 0.1 cm s−1. Subsequent application of BNP further increased (P < 0.05) SAN CV to 11.3 ± 0.4 cm s−1 (Fig. 12B). Similar observations were made in the right atrial appendage of NPR-C−/− hearts, where CV was increased (P < 0.05) from 34.3 ± 0.5 to 38.8 ± 0.6 cm s−1 by ISO and further increased (P < 0.05) to 42.5 ± 0.6 cm s−1 upon application of BNP in the presence of ISO (Fig. 12C). These data demonstrate that NPR-C is responsible for the inhibitory effects of NPs in the presence of ISO and that the GC-linked NPRs as well as NPR-C contribute to the effects of NPs during β-AR activation.
Discussion
We have used high-resolution optical mapping to study the effects of NPs on electrical conduction in the specialized pacemaker tissues of the SAN as well as in the atrial myocardium. Using this approach we were able to precisely and definitively map electrical activation in the SAN and distinguish it from the surrounding atrial myocardium. Specifically, we consistently observed the first electrical activation was located in the intercaval region of the right atrial posterior wall, adjacent to the crista terminalis, which corresponds to the SAN region as described anatomically in the mouse heart (Liu et al. 2007; Fedorov et al. 2012). Baseline CVs in the SAN were low (i.e. <10 cm s−1) in comparison to the surrounding working atrial myocardium. OAPs measured in the leading pacemaker site always displayed DDs between successive action potentials and were characterized by their relatively long duration in comparison to working atrial OAPs, which always had stable resting membrane potentials and relatively short durations. All of these observations are consistent with prior studies from several other groups using a number of mammalian species including mice, rabbits, dogs and humans (Bleeker et al. 1980; Boyett et al. 2000; Verheijck et al. 2001; Nygren et al. 2004; Fedorov et al. 2006, 2009; 2010a; 2010b).
The experiments performed in this study have generated highly novel insight into the complex effects of NPs in the heart, including in the SAN. Our data demonstrate that NPs have potent, condition-specific effects on the location of initial exit site in right atrial posterior wall, CV and action potential morphology in the SAN and atria. These NP effects on electrical conduction involve multiple NPRs. Consistent with this, we have recently demonstrated that all three NPRs are expressed in the SAN and atrial myocardium (Springer et al. 2012). In basal conditions, the effects of BNP and CNP were mediated exclusively by NPR-A and NPR-B (i.e. the GC-linked NPRs). Evidence for this conclusion includes the findings that the effects of BNP were completely antagonized by the NPR-A antagonist A71915 (Delporte et al. 1992) and that the NPR-C selective agonist cANF has no effect on electrical conduction in basal conditions. Thus, NPR-C does not appear to play a functional role in basal conditions, which is consistent with our prior studies in isolated hearts and myocytes (Azer et al. 2012; Springer et al. 2012).
In the presence of ISO, which increased CV as expected (Fedorov et al. 2010a), BNP and CNP decreased, rather than increased, conduction in the SAN and atrial myocardium. Application of cANF, which only activates NPR-C, also reduced SAN and atrial conduction in the presence of ISO indicating that NPR-C is responsible for these inhibitory effects of NPs. This was confirmed with the use of AP-811, an NPR-C antagonist (Veale et al. 2000) that completely blocked the inhibitory effects of cANF on activation pattern and conduction in the SAN and atrial myocardium. The inhibitory effects of cANF on CV in the SAN and right atrium were significantly larger than those of the native peptides BNP and CNP. We hypothesized that this was because BNP and CNP can simultaneously activate their GC-linked NPRs (which mediate an increase in CV) as well as NPR-C (which mediates a decrease in CV), resulting in opposing effects mediated by these distinct NPRs. Accordingly, we measured the effects of BNP in hearts from NPR-C−/− mice in the presence of ISO. We found that the inhibitory effects of BNP on CV were absent in NPR-C−/− hearts and, in fact, BNP elicited a further increase in CV presumably mediated by NPR-A (the only remaining receptor sensitive to BNP). Taken together, our data demonstrate that NPs increase CV in the SAN and atrial myocardium via the NPR-A and NPR-B receptors while NPR-C mediates decreases in CV, particularly in the presence of enhanced β-AR signalling. In the presence of ISO both of these pathways contribute to the effects of NPs with the overall effect being a decrease in CV.
The effects of BNP and CNP on electrical conduction in basal conditions and in the presence of ISO were associated with respective increases or decreases in cycle length. These changes in cycle length were highly consistent with changes in heart rate (measured via electrogram recordings in isolated hearts) and spontaneous action potential frequency (measured in isolated SAN myocytes) that we have recently described (Rose et al. 2004; Azer et al. 2012; Springer et al. 2012). Our present experiments clearly demonstrate that these effects are associated with shifts in the initial exit site in the right atrial posterior wall, suggesting that this is an important mechanism by which NPs affect heart rate and SAN function. We also measured the effects of NPs in externally paced atrial preparations to determine their effects on electrical conduction independently of changes in heart rate. These novel experiments demonstrate that NPs affect SAN CV even without a change in cycle length, although the effects were not as large as those observed when cycle length also changed. This suggests that the effects of NPs on SAN CV are partially independent of heart rate. Interestingly, in basal conditions, atrial CVs were increased by BNP and CNP in atrial preparations in sinus rhythm, but not in paced preparations. This indicates that, in these conditions, the effects of NPs on atrial CV are largely rate dependent. In contrast, right atrial CV was reduced by NPs in the presence of ISO in paced preparations. Together, these studies indicate that NPs require adenylyl cyclase activation to elicit direct effects on electrical conduction in the working atrial myocardium, as we have previously shown for ion channels in isolated atrial myocytes (Springer et al. 2012). The SAN, on the other hand, has been shown to have a high level of constitutive adenylyl cyclase activity (Vinogradova et al. 2006), which could partly explain the potent effects of NPs in the SAN in basal conditions. The ways in which the three NPRs work together to determine the overall effects of NPs have been very poorly understood; however, the experiments in the present study along with our prior work in isolated hearts and myocytes (Azer et al. 2012; Springer et al. 2012) provide important new insight into this complex issue.
Numerous studies have shown that the autonomic nervous system controls heart rate and SAN function in association with changes in initial exit site (or leading pacemaker site as it is often denoted) (Bouman et al. 1968; Mackaay et al. 1980; Schuessler et al. 1986; Kodama et al. 1996; Beaulieu et al. 1997; Vinogradova et al. 1998; Fedorov et al. 2006, 2010a; Glukhov et al. 2010). Specifically, the parasympathetic nervous system slows spontaneous activity in the SAN and shifts the initial exit site inferiorly while the sympathetic nervous system speeds spontaneous activity in the SAN and shifts the initial exit site in the superior direction. It is interesting that changes in electrical conduction following application of NPs were also associated with shifts in the location of the initial exit site in the right atrial posterior wall. In basal conditions, BNP and CNP consistently shifted the initial exit site in the superior direction; this effect is analogous to the effects of ISO (i.e. sympathetic nervous system activation) in the SAN (Fedorov et al. 2010a; Glukhov et al. 2010). Consistent with this, we have previously shown that the effects of NPs on heart rate and ionic currents in the SAN in basal conditions, which are mediated by NPR-A and NPR-B, involve a downstream inhibition of phosphodiesterase 3 (PDE3) (Azer et al. 2012; Springer et al. 2012). Like ISO, inhibition of PDE3 would be expected to result in an increase in cAMP-dependent signalling. On the other hand, in the presence of ISO (which induced the expected superior shift in leading pacemaker site), BNP, CNP and cANF slow electrical conduction in association with inferior shifts in leading pacemaker site. These inhibitory effects of NPs are mediated by NPR-C. The parasympathetic nervous system also inhibits SAN function in association with inferior shifts in leading pacemaker site (Vinogradova et al. 1998; Fedorov et al. 2006; Glukhov et al. 2010) via activation of muscarinic (M2) receptors. Interestingly, both M2 receptors and NPR-C signal in the heart via pertussis toxin-sensitive Gi proteins that lead to a reduction in cAMP levels (Anand-Srivastava et al. 1996; Pagano & Anand-Srivastava, 2001; Zhou & Murthy, 2003; Rose et al. 2004). A previous study (Beaulieu et al. 1997) did show that CNP can elicit positive chronotropic effects in canines; however, using electrode mapping, this study did not detect a change in leading pacemaker site after application of CNP. This may be related to differences in experimental approach (i.e. using electrodes to map activation in comparison to the high-resolution optical approach we have employed in our study). Thus, our data show, for the first time, that depending on which NPRs are activated in different conditions, NPs can affect spontaneous SAN activation and location of the initial exit site in ways similar to the sympathetic or parasympathetic branches of the autonomic nervous system.
CV is affected by a number of parameters, including action potential upstroke velocity and cell to cell communication via gap junctions (Boyett et al. 2000; Kleber & Rudy, 2004). Action potential upstroke velocity, and thus CV, is heavily dependent on Na+ current (INa) density in working cardiomyocytes. Recently, it has been demonstrated that INa is also present (at much lower densities) in SAN myocytes and that the NaV1.5 isoform in particular plays an important role in conduction of electrical signals from the SAN to the atrial myocardium (Lei et al. 2004, 2007). We have previously demonstrated that NPs elicit effects on ion channels in SAN myocytes via effects on cAMP (Rose et al. 2004; Azer et al. 2012; Springer et al. 2012). Na+ channels have been reported to be modulated by cAMP (Matsuda et al. 1992; Cantrell et al. 2002); however, the effects of NPs on INa in SAN myocytes have not been studied. Future studies will assess this possibility and whether effects of NPs on INa could explain changes in conduction velocity in SAN and atrial myocardium. In SAN myocytes, L-type Ca2+ current (ICa,L) plays an important role in determining the action potential upstroke and thus may be a contributing factor to the slow conduction velocities typical of SAN myocytes (Kleber & Rudy, 2004). We have previously shown that ICa,L is a critical target of NP signalling downstream of NPR-A/B and NPR-C in SAN and working cardiomyocytes (Rose et al. 2003, 2004; Rose & Giles, 2008; Springer et al. 2012); thus, effects on ICa,L probably play an important role in the effects of NPs on conduction in the SAN. The effects of NPs and their receptors on gap junction function have not been investigated.
ANP, the third member of the NP family, also plays a critical role in cardiovascular physiology and homeostasis (Levin et al. 1998; Potter et al. 2006). ANP binds to NPR-A and NPR-C, similarly to BNP (Potter et al. 2006). Based on this, it seems reasonable to hypothesize that ANP would have comparable effects on electrical conduction in the SAN and atria to those we have demonstrated for BNP. Very little is known about the direct effects of ANP on SAN function; however, some studies have demonstrated that ANP can increase the beating rate of isolated atrial preparations (Herring et al. 2001) while other studies report no effect of ANP on heart rate (Beaulieu et al. 1996; Hirose et al. 1998). Future studies will be needed to clarify the specific effects of ANP on SAN function and determine how they compare to the effects of BNP and CNP we have measured in the present study.
Some limitations should be considered when interpreting the results of our study. We have used di-4-ANEPPS to measure changes in voltage. di-4-ANEPPS can have some direct transient effects on the heart (Fedorov et al. 2006); however, it is widely used for the kinds of applications used in our study (Herron et al. 2012). Blebbistatin was used to suppress motion, which is necessary to accurately assess action potential morphology optically. Several studies have demonstrated that blebbistatin is highly effective at preventing contraction without disrupting ion channels, action potential morphology or activation patterns (Fedorov et al. 2007; Lou et al. 2012). Consistent with these reports, our present experiments also show that blebbistatin has no effect on activation pattern, SAN CV or cycle length. One recent report, however, does suggest that blebbistatin may have direct effects on cardiac electrophysiology, including action potential duration (Brack et al. 2013). This indicates there may be a need to further evaluate the use of blebbistatin as a mechanical uncoupler in optical mapping experiments. We have measured CVs using a well-established method that produces a local maximum CV measurement (Morley et al. 1999; Nygren et al. 2004). Recent studies, however, have demonstrated that CV in the SAN is heterogeneous and anisotropic (Fedorov et al. 2006; Fedorov et al. 2012). Our measurements do not account for the anisotropic nature of CV in the SAN. Nevertheless, our method very effectively enables assessment of changes in local CV before and after application of pharmacological compounds. Finally, our assessment of DD slope from OAPs can only be quantified as a relative change in fluorescence. Because OAPs represent measurements from more than one cell, changes in AP morphology must be interpreted cautiously. Nevertheless, numerous studies have demonstrated that changes in AP morphology can be assessed optically, particularly when measuring the acute effects of pharmacological compounds in the same preparation (Nygren et al. 2004; Fedorov et al. 2010a). Importantly, the relative changes in DD slope and AP duration we have observed following application of NPs in our optical mapping studies are very comparable to those we have measured quantitatively in isolated SAN and atrial myocytes (Azer et al. 2012; Springer et al. 2012).
In summary we have used high-resolution optical mapping to study the effects of NPs and the roles of their distinct receptors on activation patterns, electrical conduction and action potential morphology in atrial preparations containing the SAN. Our data provide novel insight into the potent effects of NPs on SAN function and demonstrate that these effects involve multiple receptor subtypes. Few studies have considered how the GC-linked NPRs (NPR-A and NPR-B) and NPR-C can each contribute to the overall effect of NPs in the heart in different physiological conditions. Our data demonstrate that, depending on experimental conditions, these different classes of receptors can simultaneously contribute to the effects of BNP and CNP and this must be considered when interpreting the effects of NPs on cardiac function.
Key points
Natriuretic peptides are powerful regulators of the cardiovascular system, but their direct electrophysiological effects in the heart are poorly understood.
We have used optical mapping techniques to determine the effects of B-type and C-type natriuretic peptide (BNP and CNP) as well as their receptors (NPR-A, NPR-B and NPR-C) on electrical conduction in the sinoatrial node and atrial myocardium.
In basal conditions, BNP and CNP speed conduction within the sinoatrial node (SAN) and into the atrial myocardium in association with shifts in the initial exit site by activating NPR-A and NPR-B.
In the presence of isoproterenol, BNP and CNP have the opposite effect whereby conduction in the SAN and atria is slowed. These inhibitory effects are due to the activation of NPR-C as well as NPR-A/B.
We conclude that natriuretic peptides have potent effects on electrical conduction in the heart. These effects are complex and can involve multiple natriuretic peptide receptors.
Acknowledgments
We thank Dr Gibanananda Ray for excellent technical support.
Glossary
- ANP
atrial natriuretic peptide
- APD
action potential duration
- β-AR
β-adrenergic receptor
- BNP
B-type natriuretic peptide
- cAMP
cyclic adenosine monophosphate
- cGMP
cyclic guanosine monophosphate
- CNP
C-type natriuretic peptide
- CV
conduction velocity
- DD slope
diastolic depolarization slope
- DMSO
dimethyl sulfoxide
- GC
guanylyl cyclase
- Gi
inhibitory G protein
- INa
Na+ current
- ISO
isoproterenol
- NP
natriuretic peptide
- NPR
natriuretic peptide receptor
- OAP
optical action potential
- PDE3
phosphodiesterase 3
- RAA
right atrial appendage
- SAN
sinoatrial node
Additional information
Competing interests
None declared.
Author contributions
All experiments were performed at Dalhousie University. Conception and design of experiments: J.A., R.H., R.A.R.; collection, analysis and interpretation of data: J.A., R.H., P.S.K., R.A.R.; drafting the article or revising it critically for important intellectual content: J.A., R.H., P.S.K., R.A.R. All authors approved the final version of the manuscript.
Funding
This work was supported by grants from the Canadian Institutes of Health Research (MOP 93718), the Heart and Stroke Foundation of Nova Scotia, the Canada Foundation for Innovation and the Dalhousie Medical Research Foundation to R.A.R., who is a CIHR New Investigator. R.H. holds a postdoctoral fellowship award from the Heart and Stroke Foundation of Canada.
References
- Anand-Srivastava MB, Sairam MR, Cantin M. Ring-deleted analogs of atrial natriuretic factor inhibit adenylate cyclase/cAMP system. Possible coupling of clearance atrial natriuretic factor receptors to adenylate cyclase/cAMP signal transduction system. J Biol Chem. 1990;265:8566–8572. [PubMed] [Google Scholar]
- Anand-Srivastava MB, Sehl PD, Lowe DG. Cytoplasmic domain of natriuretic peptide receptor-C inhibits adenylyl cyclase. Involvement of a pertussis toxin-sensitive G protein. J Biol Chem. 1996;271:19324–19329. doi: 10.1074/jbc.271.32.19324. [DOI] [PubMed] [Google Scholar]
- Anand-Srivastava MB, Trachte GJ. Atrial natriuretic factor receptors and signal transduction mechanisms. Pharmacol Rev. 1993;45:455–497. [PubMed] [Google Scholar]
- Azer J, Hua R, Vella K, Rose RA. Natriuretic peptides regulate heart rate and sinoatrial node function by activating multiple natriuretic peptide receptors. J Mol Cell Cardiol. 2012;53:715–724. doi: 10.1016/j.yjmcc.2012.08.020. [DOI] [PubMed] [Google Scholar]
- Beaulieu P, Cardinal R, De Lean A, Lambert C. Direct chronotropic effects of atrial and C-type natriuretic peptides in anaesthetized dogs. Br J Pharmacol. 1996;118:1790–1796. doi: 10.1111/j.1476-5381.1996.tb15605.x. [DOI] [PMC free article] [PubMed] [Google Scholar]
- Beaulieu P, Cardinal R, Page P, Francoeur F, Tremblay J, Lambert C. Positive chronotropic and inotropic effects of C-type natriuretic peptide in dogs. Am J Physiol. 1997;273:H1933–1940. doi: 10.1152/ajpheart.1997.273.4.H1933. [DOI] [PubMed] [Google Scholar]
- Bleeker WK, Mackaay AJ, Masson-Pevet M, Bouman LN, Becker AE. Functional and morphological organization of the rabbit sinus node. Circ Res. 1980;46:11–22. doi: 10.1161/01.res.46.1.11. [DOI] [PubMed] [Google Scholar]
- Boineau JP, Canavan TE, Schuessler RB, Cain ME, Corr PB, Cox JL. Demonstration of a widely distributed atrial pacemaker complex in the human heart. Circulation. 1988;77:1221–1237. doi: 10.1161/01.cir.77.6.1221. [DOI] [PubMed] [Google Scholar]
- Bouman LN, Gerlings ED, Biersteker PA, Bonke FI. Pacemaker shift in the sino-atrial node during vagal stimulation. Pflugers Arch. 1968;302:255–267. doi: 10.1007/BF00586730. [DOI] [PubMed] [Google Scholar]
- Boyett MR, Honjo H, Kodama I. The sinoatrial node, a heterogeneous pacemaker structure. Cardiovasc Res. 2000;47:658–687. doi: 10.1016/s0008-6363(00)00135-8. [DOI] [PubMed] [Google Scholar]
- Brack KE, Narang R, Winter J, Ng GA. The mechanical uncoupler blebbistatin is associated with significant electrophysiological effects in the isolated rabbit heart. Exp Physiol. 2013;98:1009–1027. doi: 10.1113/expphysiol.2012.069369. [DOI] [PMC free article] [PubMed] [Google Scholar]
- Cantrell AR, Tibbs VC, Yu FH, Murphy BJ, Sharp EM, Qu Y, Catterall WA, Scheuer T. Molecular mechanism of convergent regulation of brain Na+ channels by protein kinase C and protein kinase A anchored to AKAP-15. Mol Cell Neurosci. 2002;21:63–80. doi: 10.1006/mcne.2002.1162. [DOI] [PubMed] [Google Scholar]
- Delporte C, Winand J, Poloczek P, Von Geldern T, Christophe J. Discovery of a potent atrial natriuretic peptide antagonist for ANPA receptors in the human neuroblastoma NB-OK-1 cell line. Eur J Pharmacol. 1992;224:183–188. doi: 10.1016/0014-2999(92)90803-c. [DOI] [PubMed] [Google Scholar]
- Dobrzynski H, Li J, Tellez J, Greener ID, Nikolski VP, Wright SE, Parson SH, Jones SA, Lancaster MK, Yamamoto M, Honjo H, Takagishi Y, Kodama I, Efimov IR, Billeter R, Boyett MR. Computer three-dimensional reconstruction of the sinoatrial node. Circulation. 2005;111:846–854. doi: 10.1161/01.CIR.0000152100.04087.DB. [DOI] [PubMed] [Google Scholar]
- Efimov IR, Nikolski VP, Salama G. Optical imaging of the heart. Circ Res. 2004;95:21–33. doi: 10.1161/01.RES.0000130529.18016.35. [DOI] [PubMed] [Google Scholar]
- Farman GP, Tachampa K, Mateja R, Cazorla O, Lacampagne A, de Tombe PP. Blebbistatin: use as inhibitor of muscle contraction. Pflugers Arch. 2008;455:995–1005. doi: 10.1007/s00424-007-0375-3. [DOI] [PubMed] [Google Scholar]
- Fedorov VV, Chang R, Glukhov AV, Kostecki G, Janks D, Schuessler RB, Efimov IR. Complex interactions between the sinoatrial node and atrium during reentrant arrhythmias in the canine heart. Circulation. 2010a;122:782–789. doi: 10.1161/CIRCULATIONAHA.109.935288. [DOI] [PMC free article] [PubMed] [Google Scholar]
- Fedorov VV, Glukhov AV, Chang R. Conduction barriers and pathways of the sinoatrial pacemaker complex: their role in normal rhythm and atrial arrhythmias. Am J Physiol Heart Circ Physiol. 2012;302:H1773–1783. doi: 10.1152/ajpheart.00892.2011. [DOI] [PubMed] [Google Scholar]
- Fedorov VV, Glukhov AV, Chang R, Kostecki G, Aferol H, Hucker WJ, Wuskell JP, Loew LM, Schuessler RB, Moazami N, Efimov IR. Optical mapping of the isolated coronary-perfused human sinus node. J Am Coll Cardiol. 2010b;56:1386–1394. doi: 10.1016/j.jacc.2010.03.098. [DOI] [PMC free article] [PubMed] [Google Scholar]
- Fedorov VV, Hucker WJ, Dobrzynski H, Rosenshtraukh LV, Efimov IR. Postganglionic nerve stimulation induces temporal inhibition of excitability in rabbit sinoatrial node. Am J Physiol Heart Circ Physiol. 2006;291:H612–H623. doi: 10.1152/ajpheart.00022.2006. [DOI] [PubMed] [Google Scholar]
- Fedorov VV, Lozinsky IT, Sosunov EA, Anyukhovsky EP, Rosen MR, Balke CW, Efimov IR. Application of blebbistatin as an excitation–contraction uncoupler for electrophysiologic study of rat and rabbit hearts. Heart Rhythm. 2007;4:619–626. doi: 10.1016/j.hrthm.2006.12.047. [DOI] [PubMed] [Google Scholar]
- Fedorov VV, Schuessler RB, Hemphill M, Ambrosi CM, Chang R, Voloshina AS, Brown K, Hucker WJ, Efimov IR. Structural and functional evidence for discrete exit pathways that connect the canine sinoatrial node and atria. Circ Res. 2009;104:915–923. doi: 10.1161/CIRCRESAHA.108.193193. [DOI] [PMC free article] [PubMed] [Google Scholar]
- Glukhov AV, Fedorov VV, Anderson ME, Mohler PJ, Efimov IR. Functional anatomy of the murine sinus node: high-resolution optical mapping of ankyrin-B heterozygous mice. Am J Physiol Heart Circ Physiol. 2010;299:H482–H491. doi: 10.1152/ajpheart.00756.2009. [DOI] [PMC free article] [PubMed] [Google Scholar]
- Herring N, Zaman JA, Paterson DJ. Natriuretic peptides like NO facilitate cardiac vagal neurotransmission and bradycardia via a cGMP pathway. Am J Physiol Heart Circ Physiol. 2001;281:H2318–H2327. doi: 10.1152/ajpheart.2001.281.6.H2318. [DOI] [PubMed] [Google Scholar]
- Herron TJ, Lee P, Jalife J. Optical imaging of voltage and calcium in cardiac cells & tissues. Circ Res. 2012;110:609–623. doi: 10.1161/CIRCRESAHA.111.247494. [DOI] [PMC free article] [PubMed] [Google Scholar]
- Hirose M, Furukawa Y, Kurogouchi F, Nakajima K, Miyashita Y, Chiba S. C-type natriuretic peptide increases myocardial contractility and sinus rate mediated by guanylyl cyclase-linked natriuretic peptide receptors in isolated, blood-perfused dog heart preparations. J Pharmacol Exp Ther. 1998;286:70–76. [PubMed] [Google Scholar]
- James TN. Structure and function of the sinus node, AV node and His bundle of the human heart: part I – structure. Prog Cardiovasc Dis. 2002;45:235–267. doi: 10.1053/pcad.2002.130388. [DOI] [PubMed] [Google Scholar]
- James TN. Structure and function of the sinus node, AV node and his bundle of the human heart: part II – function. Prog Cardiovasc Dis. 2003;45:327–360. doi: 10.1053/pcad.2003.1. [DOI] [PubMed] [Google Scholar]
- Jaubert J, Jaubert F, Martin N, Washburn LL, Lee BK, Eicher EM, Guenet JL. Three new allelic mouse mutations that cause skeletal overgrowth involve the natriuretic peptide receptor C gene (Npr3. Proc Natl Acad Sci U S A. 1999;96:10278–10283. doi: 10.1073/pnas.96.18.10278. [DOI] [PMC free article] [PubMed] [Google Scholar]
- Keith A, Flack M. The form and nature of the muscular connections between the primary divisions of the vertebrate heart. J Anat Physiol. 1907;41:172–189. [PMC free article] [PubMed] [Google Scholar]
- Kleber AG, Rudy Y. Basic mechanisms of cardiac impulse propagation and associated arrhythmias. Physiol Rev. 2004;84:431–488. doi: 10.1152/physrev.00025.2003. [DOI] [PubMed] [Google Scholar]
- Kodama I, Boyett MR, Suzuki R, Honjo H, Toyama J. Regional differences in the response of the isolated sino-atrial node of the rabbit to vagal stimulation. J Physiol. 1996;495:785–801. doi: 10.1113/jphysiol.1996.sp021633. [DOI] [PMC free article] [PubMed] [Google Scholar]
- Kuhn M. Molecular physiology of natriuretic peptide signalling. Basic Res Cardiol. 2004;99:76–82. doi: 10.1007/s00395-004-0460-0. [DOI] [PubMed] [Google Scholar]
- Lee CY, Burnett JC., Jr Natriuretic peptides and therapeutic applications. Heart Fail Rev. 2007;12:131–142. doi: 10.1007/s10741-007-9016-3. [DOI] [PubMed] [Google Scholar]
- Lei M, Jones SA, Liu J, Lancaster MK, Fung SS, Dobrzynski H, Camelliti P, Maier SK, Noble D, Boyett MR. Requirement of neuronal-and cardiac-type sodium channels for murine sinoatrial node pacemaking. J Physiol. 2004;559:835–848. doi: 10.1113/jphysiol.2004.068643. [DOI] [PMC free article] [PubMed] [Google Scholar]
- Lei M, Zhang H, Grace AA, Huang CL. SCN5A and sinoatrial node pacemaker function. Cardiovasc Res. 2007;74:356–365. doi: 10.1016/j.cardiores.2007.01.009. [DOI] [PubMed] [Google Scholar]
- Levin ER, Gardner DG, Samson WK. Natriuretic peptides. N Engl J Med. 1998;339:321–328. doi: 10.1056/NEJM199807303390507. [DOI] [PubMed] [Google Scholar]
- Liu J, Dobrzynski H, Yanni J, Boyett MR, Lei M. Organisation of the mouse sinoatrial node: structure and expression of HCN channels. Cardiovasc Res. 2007;73:729–738. doi: 10.1016/j.cardiores.2006.11.016. [DOI] [PubMed] [Google Scholar]
- Lou Q, Li W, Efimov IR. The role of dynamic instability and wavelength in arrhythmia maintenance as revealed by panoramic imaging with blebbistatin vs. 2,3-butanedione monoxime. Am J Physiol Heart Circ Physiol. 2012;302:H262–H269. doi: 10.1152/ajpheart.00711.2011. [DOI] [PMC free article] [PubMed] [Google Scholar]
- Lucas KA, Pitari GM, Kazerounian S, Ruiz-Stewart I, Park J, Schulz S, Chepenik KP, Waldman SA. Guanylyl cyclases and signaling by cyclic GMP. Pharmacol Rev. 2000;52:375–414. [PubMed] [Google Scholar]
- Mackaay AJ, Op't Hof T, Bleeker WK, Jongsma HJ, Bouman LN. Interaction of adrenaline and acetylcholine on cardiac pacemaker function. Functional inhomogeneity of the rabbit sinus node. J Pharmacol Exp Ther. 1980;214:417–422. [PubMed] [Google Scholar]
- Mangoni ME, Nargeot J. Properties of the hyperpolarization-activated current (If) in isolated mouse sino-atrial cells. Cardiovasc Res. 2001;52:51–64. doi: 10.1016/s0008-6363(01)00370-4. [DOI] [PubMed] [Google Scholar]
- Matsuda JJ, Lee H, Shibata EF. Enhancement of rabbit cardiac sodium channels by β-adrenergic stimulation. Circ Res. 1992;70:199–207. doi: 10.1161/01.res.70.1.199. [DOI] [PubMed] [Google Scholar]
- Morley GE, Vaidya D, Samie FH, Lo C, Delmar M, Jalife J. Characterization of conduction in the ventricles of normal and heterozygous Cx43 knockout mice using optical mapping. J Cardiovasc Electrophysiol. 1999;10:1361–1375. doi: 10.1111/j.1540-8167.1999.tb00192.x. [DOI] [PubMed] [Google Scholar]
- Nygren A, Lomax AE, Giles WR. Heterogeneity of action potential durations in isolated mouse left and right atria recorded using voltage-sensitive dye mapping. Am J Physiol Heart Circ Physiol. 2004;287:H2634–H2643. doi: 10.1152/ajpheart.00380.2004. [DOI] [PubMed] [Google Scholar]
- Pagano M, Anand-Srivastava MB. Cytoplasmic domain of natriuretic peptide receptor C constitutes Gi activator sequences that inhibit adenylyl cyclase activity. J Biol Chem. 2001;276:22064–22070. doi: 10.1074/jbc.M101587200. [DOI] [PubMed] [Google Scholar]
- Potter LR, Abbey-Hosch S, Dickey DM. Natriuretic peptides, their receptors, and cyclic guanosine monophosphate-dependent signaling functions. Endocr Rev. 2006;27:47–72. doi: 10.1210/er.2005-0014. [DOI] [PubMed] [Google Scholar]
- Rose RA. CD-NP, a chimeric natriuretic peptide for the treatment of heart failure. Curr Opin Investig Drugs. 2010;11:349–356. [PubMed] [Google Scholar]
- Rose RA, Giles WR. Natriuretic peptide C receptor signalling in the heart and vasculature. J Physiol. 2008;586:353–366. doi: 10.1113/jphysiol.2007.144253. [DOI] [PMC free article] [PubMed] [Google Scholar]
- Rose RA, Lomax AE, Giles WR. Inhibition of L-type Ca2+ current by C-type natriuretic peptide in bullfrog atrial myocytes: an NPR-C-mediated effect. Am J Physiol Heart Circ Physiol. 2003;285:H2454–H2462. doi: 10.1152/ajpheart.00388.2003. [DOI] [PubMed] [Google Scholar]
- Rose RA, Lomax AE, Kondo CS, Anand-Srivastava MB, Giles WR. Effects of C-type natriuretic peptide on ionic currents in mouse sinoatrial node: a role for the NPR-C receptor. Am J Physiol Heart Circ Physiol. 2004;286:H1970–H1977. doi: 10.1152/ajpheart.00893.2003. [DOI] [PubMed] [Google Scholar]
- Rose RA, Sellan M, Simpson JA, Izaddoustdar F, Cifelli C, Panama BK, Davis M, Zhao D, Markhani M, Murphy GG, Striessnig J, Liu PP, Heximer SP, Backx PH. Iron overload decreases CaV1.3-dependent L-type Ca2+ currents leading to bradycardia, altered electrical conduction, and atrial fibrillation. Circ Arrhythm Electrophysiol. 2011;4:733–742. doi: 10.1161/CIRCEP.110.960401. [DOI] [PMC free article] [PubMed] [Google Scholar]
- Schuessler RB, Boineau JP, Wylds AC, Hill DA, Miller CB, Roeske WR. Effect of canine cardiac nerves on heart rate, rhythm, and pacemaker location. Am J Physiol. 1986;250:H630–644. doi: 10.1152/ajpheart.1986.250.4.H630. [DOI] [PubMed] [Google Scholar]
- Springer J, Azer J, Hua R, Robbins C, Adamczyk A, McBoyle S, Bissell MB, Rose RA. The natriuretic peptides BNP and CNP increase heart rate and electrical conduction by stimulating ionic currents in the sinoatrial node and atrial myocardium following activation of guanylyl cyclase-linked natriuretic peptide receptors. J Mol Cell Cardiol. 2012;52:1122–1134. doi: 10.1016/j.yjmcc.2012.01.018. [DOI] [PubMed] [Google Scholar]
- Swaminathan PD, Purohit A, Soni S, Voigt N, Singh MV, Glukhov AV, Gao Z, He BJ, Luczak ED, Joiner ML, Kutschke W, Yang J, Donahue JK, Weiss RM, Grumbach IM, Ogawa M, Chen PS, Efimov I, Dobrev D, Mohler PJ, Hund TJ, Anderson ME. Oxidized CaMKII causes cardiac sinus node dysfunction in mice. J Clin Invest. 2011;121:3277–3288. doi: 10.1172/JCI57833. [DOI] [PMC free article] [PubMed] [Google Scholar]
- Veale CA, Alford VC, Aharony D, Banville DL, Bialecki RA, Brown FJ, Damewood JR, Jr, Dantzman CL, Edwards PD, Jacobs RT, Mauger RC, Murphy MM, Palmer W, Pine KK, Rumsey WL, Garcia-Davenport LE, Shaw A, Steelman GB, Surian JM, Vacek EP. The discovery of non-basic atrial natriuretic peptide clearance receptor antagonists. Part 1. Bioorg Med Chem Lett. 2000;10:1949–1952. doi: 10.1016/s0960-894x(00)00387-5. [DOI] [PubMed] [Google Scholar]
- Verheijck EE, van Kempen MJ, Veereschild M, Lurvink J, Jongsma HJ, Bouman LN. Electrophysiological features of the mouse sinoatrial node in relation to connexin distribution. Cardiovasc Res. 2001;52:40–50. doi: 10.1016/s0008-6363(01)00364-9. [DOI] [PubMed] [Google Scholar]
- Vinogradova TM, Fedorov VV, Yuzyuk TN, Zaitsev AV, Rosenshtraukh LV. Local cholinergic suppression of pacemaker activity in the rabbit sinoatrial node. J Cardiovasc Pharmacol. 1998;32:413–424. doi: 10.1097/00005344-199809000-00012. [DOI] [PubMed] [Google Scholar]
- Vinogradova TM, Lyashkov AE, Zhu W, Ruknudin AM, Sirenko S, Yang D, Deo S, Barlow M, Johnson S, Caffrey JL, Zhou YY, Xiao RP, Cheng H, Stern MD, Maltsev VA, Lakatta EG. High basal protein kinase A-dependent phosphorylation drives rhythmic internal Ca2+ store oscillations and spontaneous beating of cardiac pacemaker cells. Circ Res. 2006;98:505–514. doi: 10.1161/01.RES.0000204575.94040.d1. [DOI] [PubMed] [Google Scholar]
- William M, Hamilton EJ, Garcia A, Bundgaard H, Chia KK, Figtree GA, Rasmussen HH. Natriuretic peptides stimulate the cardiac sodium pump via NPR-C-coupled NOS activation. Am J Physiol Cell Physiol. 2008;294:C1067–C1073. doi: 10.1152/ajpcell.00243.2007. [DOI] [PubMed] [Google Scholar]
- Zhou H, Murthy KS. Identification of the G protein-activating sequence of the single-transmembrane natriuretic peptide receptor C (NPR-C) Am J Physiol Cell Physiol. 2003;284:C1255–C1261. doi: 10.1152/ajpcell.00520.2002. [DOI] [PubMed] [Google Scholar]
Associated Data
This section collects any data citations, data availability statements, or supplementary materials included in this article.