

Abstract
A transwall gradient in resting membrane potential (RMP) exists across the circular muscle layer in the mouse colon. This gradient is dependent on endogenous generation of CO. H2S is also generated in muscle layers of the mouse colon. The effect of endogenously generated H2S on the transwall gradient is not known. The aim was to investigate the role of endogenous H2S. Our results showed that the CSE inhibitor dl-propargylglycine (PAG, 500 μm) had no effect on the transwall gradient. However, in preparations pretreated with the nitric oxide synthase inhibitor N-nitro-l-arginine (l-NNA, 200 μm) and in nNOS-knockout (KO) mouse preparations, PAG shifted the transwall gradient in the depolarizing direction. In CSE-KO–nNOS-KO mice, the gradient was shifted in the depolarizing direction. Endogenous generation of NO was significantly higher in muscle preparations of CSE-KO mice compared to wild-type (WT) mice. The amplitude of NO-mediated slow inhibitory junction potentials (S-IJPs) evoked by electric field stimulation was significantly higher in CSE-KO mouse preparations compared to the amplitude of S-IJPs in wild-type mouse preparations. CSE was present in all submucosal ganglion neurons and in almost all myenteric ganglion neurons. Eleven per cent of CSE positive neurons in the submucosal plexus and 50% of CSE positive neurons in the myenteric plexus also contained nNOS. Our results suggest that endogenously generated H2S acts as a stealth hyperpolarizing factor on smooth muscle cells to maintain the CO-dependent transwall gradient and inhibits NO production from nNOS.
Introduction
A transwall gradient in resting membrane potential (RMP) exists across the circular muscle layer of the gastrointestinal tract in a number of species including humans (Hara et al. 1986), dogs (Bauer et al. 1985; Hara et al. 1986; Smith et al. 1987), cats (Suzuki et al. 1986) and mice (Farrugia et al. 2003; Sha et al. 2007; 2010). In the stomach and small intestine, the RMP of circular smooth muscle cells in the myenteric region is more hyperpolarized compared to the RMP of muscle cells adjacent to the submucosa. In sharp contrast, the transwall gradient in the colon is reversed with muscle cells adjacent to the submucosa more hyperpolarized compared to muscle cells adjacent to the myenteric plexus. The transwall gradients throughout the gastrointestinal tract enable the circular muscle layer to produce a range of contractile activity from weak contractions that only involve a portion of the circular muscle layer to strong propulsive contractions that involve the entire circular muscle layer to gradations in strengths between these two extremes (Szurszewski, 1987). The transwall gradient may be considered to function as a biological rheostat regulating how much of the thickness of the circular muscle contracts during each electrical slow wave (Szurszewski & Farrugia, 2004). In the mouse and human stomach and small intestine, the transwall gradient depends on the generation and focal release of carbon monoxide (CO) by interstitial cells of Cajal located in the myenteric region (Farrugia et al. 2003; Sha et al. 2007). In sharp contrast, the transwall gradient in RMP across the circular muscle layer in the mouse colon is due to a tetrodotoxin-sensitive constitutive release of endogenously generated CO from submucosal ganglion neurons (Sha et al. 2010).
Hydrogen sulfide (H2S) has been proposed as a signalling molecular regulating smooth muscle contraction. H2S hyperpolarizes smooth muscle cells and is a smooth muscle relaxant (Hosoki et al. 1997; Zhao et al. 2001; Tang et al. 2005; 2010; Zhong et al. 2010; Mustafa et al. 2011; Wang, 2012; Linden, 2013). H2S has been suggested to be an endothelium-derived hyperpolarizing factor in the cardiovascular system (Mustafa et al. 2011; Wang, 2011; Giles et al. 2012). In rat colon, exogenous NaHS, a donor of H2S, hyperpolarizes the RMP of smooth muscle cells (Gil et al. 2013). Our recent study showed that living colonic tissue of the mouse comprising the external muscle layers generates H2S and that the production of endogenous H2S is strongly inhibited by H2S synthesizing enzyme inhibitors (Linden et al. 2008) and enhanced by inhibition of H2S degradation (Linden et al. 2012). Both H2S synthesizing enzymes cystathionine-γ-lyase (CSE) and cystathionine-β-synthase (CBS) are expressed in the mouse colon, with CSE expression levels about twice as high as CBS expression (Linden et al. 2008), and intense immunoreactivity for CSE but not CBS is present in the enteric plexus (Linden et al. 2008), suggesting that CSE is the predominant enzyme for H2S production. Although the importance of endogenous generation of H2S on the transwall gradient of RMP in the colon wall is not known, all the evidence suggests that endogenously generated H2S in the mouse colon might be involved in contributing, modulating or maintaining the RMP gradient. The purpose of this study was to determine the role of endogenous generation of H2S in the transwall gradient of the mouse colon. In this study, we made two novel findings. Firstly, endogenously generated H2S functions physiologically as a stealth hyperpolarizing factor that shifts the RMP gradient in the hyperpolarizing direction, and secondly, endogenously generated H2S inhibits NO production for nNOS.
Methods
Ethical approval
The use of mouse tissue was approved by the Institutional Animal Care and Use Committee of the Mayo Clinic.
Adult (8-to 15-week-old) wild-type (WT) mice (SJL/J, C57BL/6 Jackson Laboratory, Bar Harbor, Maine, USA), nNOS knockout (nNOS–KO) mice (B6;129S4-Nos1tm1Plh/J, Jackson Laboratory), CSE knockout (CSE-KO) mice (from Rui Wang, Lakehead University, Thunder Bay, Ontario, Canada) and double CSE and nNOS knockout (CSE-KO–nNOS-KO) colony mice were used. CSE-KO–nNOS-KO mouse colony was obtained by using nNOS-KO mice (B6;129S4-Nos1tm1Plh/J) and CSE-KO mice backcrossed 10 generations with C57BL/6J mice and interbred. Founders were heterozygous for both null mutations. Founders were bred to obtain double homozygous mutant mice as well as CSE-KO, nNOS-KO and WT controls.
Immunohistochemistry
Mouse colon was dissected immediately after the animal was killed with CO2 gas. After the mucosa was carefully dissected away, a piece of colonic muscle wall (∼10 mm × 8 mm) was fixed with 4% paraformaldehyde at 4°C for 3 h. After fixation, the whole mount preparation was doubly stained for CSE and nNOS (Sha et al. 2010) using mouse anti-CSE (monoclonal, Abnova, Walnut, CA, USA; 1:500 dilution), goat anti mouse FITC (Chemicon International Inc., Temecula, CA, USA; 1:200 dilution), rabbit anti-nNOS (Santa Cruz Biotechnology Inc., Santa Cruz, CA, USA; 1:600 dilution) and goat anti-rabbit CY3 (Jackson ImmunoResearch Laboratories Inc., West Grove, PA, USA; 1:800 dilution). The preparations were then mounted onto slides with Slowfade antifade reagent with DAPI (Life Technologies, Carlsbad, CA USA) and examined under a fluorescence microscope. The specificity of the monoclonal mouse anti-CSE antibody we used had been determined and validated in our previous report (Linden et al. 2008) by testing it with preabsorption of the immunosera with recombinant proteins, and by comparing the immunostaining in various tissues using this antibody to the immunostaining using an already-validated rabbit polyclonal anti-CSE antibody (Yang et al. 2008). The total number of neurons in a ganglion was determined by counting the large round nuclei of neurons with DAPI fluorescence.
Electrophysiology
After a mouse was killed with CO2 gas, a segment of colon approximately 3 cm from the caecum was removed and placed in oxygenated normal Krebs solution (NKS) at room temperature. A segment of colon approximately 8 mm long was opened along the mesenteric border and transferred to a Petri dish filled with fresh oxygenated NKS. The mucosa was carefully removed under direct visualization using a binocular microscope leaving the submucosal nerve plexus intact as previously described (Sha et al. 2010). Then, a 6 mm × 6 mm piece of the colon wall without mucosa was pinned down flat to the recording chamber with serosal side down. The chamber had a volume of 3 ml and was perfused continuously with oxygenized NKS at 36°C at a rate of 3 ml min–1. The preparations were incubated in the recording chamber for at least 1 h before recording. The composition of the solution was (in mm): 137.4 Na+, 5.9 K+, 2.5 Ca2+, 1.2 Mg2+, 124 Cl−, 15.5 HCO3−, 1.2 H2PO4−, and 11.5 glucose. For more stabilized intracellular recording, nifedipine (1 μm) was applied in the bathing fluid to block muscle contractions. The solution was continuously bubbled with 97% O2–3% CO2, and maintained at pH 7.4.
Sharp glass microelectrodes filled with 3 m KCl (with input resistances ranging from 40–70 MΩ) were used to record intracellularly the membrane potential of smooth muscle cells. Recorded signals were amplified through an amplifier (Intra 767, WPI), digitized (Digidata 1322A, Axon Instruments), analysed, and stored in a computer.
A microelectrode manipulator (LSS-8000, EXFO Burleigh) was used to advance the recording microelectrode at a 90 deg angle against the plane of the smooth muscle wall. The read-out meter of the Burleigh manipulator was set at 0 when the tip of recording microelectrode touched the tissue surface. The distance of a recorded cell from the surface of the tissue was obtained by the read-out from the meter. In some experiments, the distance of the recorded cell from the surface of the tissue was verified and validated as previously described (Sha et al. 2007). Values for RMPs at different depths of the circular muscle layer are reported in the Results section in two ways. In the first, RMP values were placed in three groups based on whether the recorded cell's location was in the anatomic inner region, middle region or outer region of the circular muscle layer. Each group represented one-third of the measured thickness of the circular muscle layer. The inner group of cells was closest to the submucosal border and submucosal ganglion plexus whereas the outer group of cells was closest to the myenteric plexus. For each preparation (animal) and experimental condition, multiple impalements were made within each group. The mean (± SEM) RMP for each of the three groups of cells from all experiments was obtained. In the second method of analysis, RMPs were plotted against the cell location from which the recordings were made (Fig. 1A). Because the thickness of the circular muscle layer varied from 60 μm to 110 μm between animals of the same strain and between strains, and with age, we normalized the gradient by setting the maximum depth at 100%. The surface of the circular muscle layer adjacent to the submucosal plexus (inner group) is at 0% and the surface of the circular muscle layer adjacent to the myenteric plexus (outer group) is at 100% (cf. Figure 1B). A random effect model was used to model RMPs of recorded cells versus the location of the cell in the circular muscle layer (Diggle et al. 1994). This method of analysis accounts for the linear correlation of RMPs and their related locations. This analysis also tested whether the slope of the regression line was significantly different from zero slope. Using this analysis method, the regression slopes (RMPs across the thickness of the circular muscle layer) were plotted without individual data points.
Figure 1.
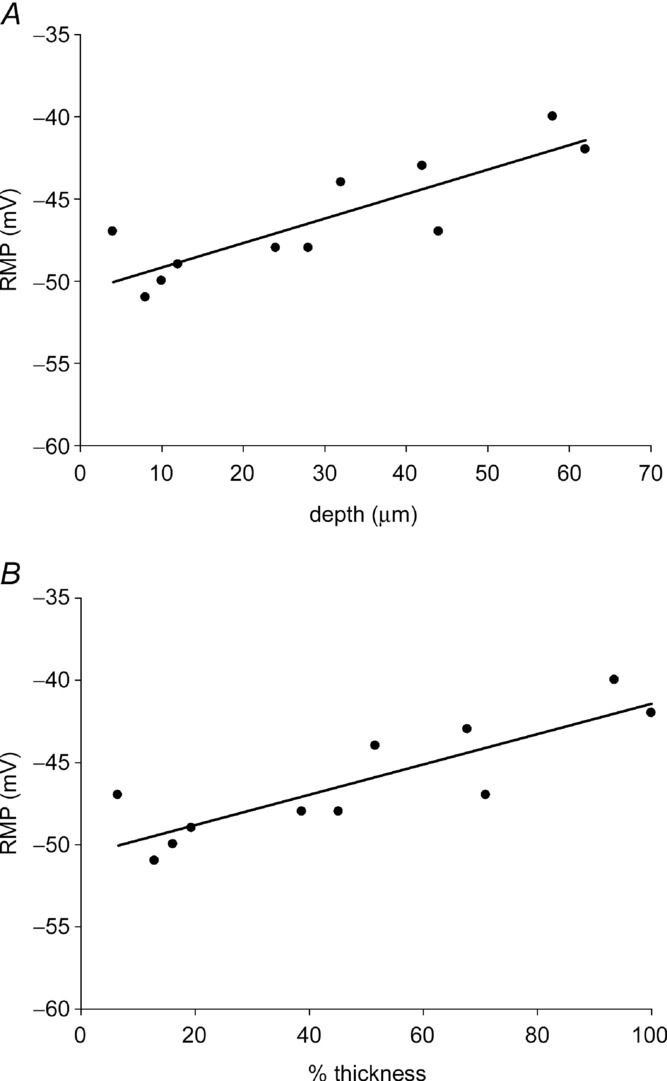
A, each dot represents the RMP recorded from a smooth muscle cell. The line is the regression line for all cells recorded from the same preparation. B, the plot was made using the data in A. The depth of each recorded cell was normalized with the maximum thickness of the preparation set at 100%. The submucosal surface of the circular muscle layer was at 0% and the circular muscle at the myenteric plexus region set at 100%. The slopes of the regression lines were 1.49 mV per 10 μm in A and 0.91 mV per 10% thickness in B. The slopes were significantly different (P < 0.05) when compared to zero slope. Recordings made from SJL/J mice.
In some experiments, slow inhibitory junction potentials (S-IJPs) were evoked by a bipolar stimulating electrode. Two polar wires of the stimulating electrode were placed parallel around the preparation. Stimuli were applied at 80 V, 0.5 ms duration, 20 Hz frequency and at a train duration of 400 ms.
NO measurement
Four CSE-KO mice and four littermate WT control mice were used. After a mouse was killed with CO2 gas, a segment of colon approximately 3 cm from the caecum was removed and placed in oxygenated normal Krebs solution (NKS) at room temperature. A segment of colon approximately 8–12 mm long was opened along the mesenteric border and transferred to a Petri dish filled with fresh oxygenated NKS. The mucosa was carefully removed under direct vision by using a binocular microscope. Two to three pieces of the colon wall (6 mm × 4 mm) without mucosa were dissected from each animal. Each preparation was pinned down flat to a Sylgard-coated well with 0.5 ml NKS in a 24 well plate at room temperature. 4,5-Diaminofluorescein diacetate (DAF-2 DA) was added to each well (10 μm) 10 min before measurement. Fluorescence was measured with a microplate reader (Synergy Mx Microplate Reader, BioTek Instruments). The wavelengths of excitation and emission were set at 495 and 515 nm, respectively. After measurement at room temperature, the plate was placed in a CO2 incubator at 37°C for 20 min. After incubation, the preparations were measured again with the microplate reader. The raw readings of fluorescence from CSE-KO preparations were compared with those from WT preparations. Wells without tissue were used as blank control.
Drugs
Nifedipine, l-NNA and PAG (all dissolved in NKS) were applied to the recording chamber through superfusion. Stable intracellular recordings were made 30 min after adding a drug or making a change in the bath solution. DAF-2 DA was purchased from Enzo Life Sciences (Farmingdale, NY, USA) and all other chemicals used in this study were from Sigma.
Statistics
Values are given as means ± SEM. Student's t test was used in statistical comparisons between the value in test group and the value in control group. A P value of 0.05 or less was considered significant.
Results
Effect of PAG on the transwall RMP gradient
As CSE is the predominant enzyme for endogenous H2S production in mouse colon (Linden et al. 2008), we tested the effect of inhibiting the endogenous production of H2S on the RMP gradient with the CSE blocker PAG.
Intracellular recordings were made from 39 circular smooth muscle cells from five wild-type mouse preparations in NKS. The RMP of cells close to the submucosal border (inner group) was −52.1 ± 1.9 mV whereas the RMP of cells close to the myenteric region (outer group) was −42.7 ± 0.8 mV (P < 0.01 compared to the inner group (Table 1). The RMP for cells in the middle group were more depolarized than cells in the inner group and more hyperpolarized than those in the outer group (−46.7 ± 1.0; Table 1). The slope of the mean regression line using a random effect model for all preparations recorded from in NKS was 2.2 ± 0.8 mV per 10 μm. The slope after normalization was 1.25 ± 0.42 per 10% thickness. The slopes were significantly different from 0 slope, indicating the presence of a RMP gradient. These data confirm our previous results (Sha et al. 2010). In the same five preparations, recordings were made from 35 cells in the presence of PAG (500 μm). Circular smooth muscle cells had a mean RMPs of −50.2 ± 1.3 mV in the inner group, −47.7 ± 0.8 mV in the middle group and −44.0 ± 0.9 mV in the outer group (Table 1). There was no significant difference in the RMPs in all three groups between PAG-treated preparations and the controls. The slope of the mean regression line of the transwall gradient was 0.87 ± 0.19 mV per 10% thickness (1.2 ± 0.02 mV per 10 μm; Fig. 2A). The slope was significantly (P < 0.05) different compared to 0 slope, and although the slope was less steep compared to control, it was not significantly different (P > 0.05) compared to the slope in the control group (Fig. 2A). Thus, the CO-dependent gradient (Sha et al. 2010) was not significantly altered when CSE was blocked by PAG.
Table 1.
RMPs in inner, middle and outer groups
| RMP (mV) |
||||
|---|---|---|---|---|
| Mouse strain | Group | Inner | Middle | Outer |
| SJL/J | NKS (n = 5) | −52.1 ± 1.9 | −46.7 ± 1.0 | −42.7 ± 0.8 |
| NKS + PAG (n = 5) | −50.2 ± 1.3 | −47.7 ± 0.8 | −44.0 ± 0.9 | |
| NKS + l-NNA (n = 4) | −51.6 ± 1.2 | −46.8 ± 0.5 | −42.8 ± 0.7 | |
| (NKS + l-NNA) + PAG (n = 4) | −46.3 ± 0.8** | −42.4 ± 0.7*** | −41.0 ± 0.3* | |
| B6;129S4-Nos1tm1Plh/J | nNOS-KO (n = 5) | −62.3 ± 1.4‡ | −57.3 ± 0.6‡ | −53.6 ± 0.9‡ |
| nNOS-KO + PAG (n = 5) | −57.2 ± 0.8† | −53.4 ± 0.6† | −48.7 ± 0.6† | |
| C57BL/6J | Wild type (n = 6) | −51.7 ± 1.6 | −48.0 ± 1.8 | −43.9 ± 1.0 |
| CSE-KO (n = 6) | −50.1 ± 1.4 | −45.0 ± 0.9 | −42.7 ± 0.6 | |
| nNOS-KO (n = 3) | −52.2 ± 1.6 | −50.5 ± 2.1 | −45.9 ± 0.7 | |
| CSE-KO–nNOS−KO (n = 6) | −47.9 ± 0.5∇Δ | −45.4 ± 0.8Δ | −44.2 ± 0.5 | |
P < 0.05,
P < 0.01 compared to the WT + l-NNA;
P < 0.01 compared to its nNOS-KO control; ∇P < 0.05 compared to the wild-type group;
P < 0.05 compared to the nNOS-KO group in the same set of experiments;
P < 0.01 compared to the SJL/J (NKS) and C57BL/6J (wild-type) groups.
Figure 2.

A, the CSE inhibitor PAG had no significant effect on the transwall gradient (continuous line, control; dashed line, in PAG). B, the NOS inhibitor l-NNA had no effect on the transwall gradient (continuous line, control; dashed line, in l-NNA). C, PAG shifted the entire RMP gradient in the depolarizing direction in preparations pretreated with l-NNA (continuous line, l-NNA pretreated; dashed line, l-NNA pretreated + PAG). In panels A–C, SJL/J mice were used. D, in nNOS-KO preparations (B6;129S4-Nos1tm1Plh/J), PAG shifted the RMP gradient in the depolarizing direction throughout the thickness of circular muscle wall.
Although endogenous H2S is produced in the mouse colon muscle (Linden et al. 2008; 2012) and H2S is a hyperpolarizing factor in smooth muscle cells (Wang, 2012; Gil et al. 2013), surprisingly, the pharmacological inhibition of H2S production by PAG did not induce any membrane potential depolarization. There were likely to be two possible reasons for PAG's inability to depolarize the membrane potential: (1) the amount of endogenously generated H2S produced in the tissue was not high enough to constitutively hyperpolarize the membrane potential; or (2) there were other factor(s) that compensated for the effect of blocking H2S production on membrane potential. The NO-producing enzymes nNOS (neuronal), eNOS (endothelial) and iNOS (inducible) are present in mouse colon and NO produced by nNOS is known to hyperpolarize membrane potential of smooth muscle cells (Rae et al. 1998; Storr et al. 2002; Gallego et al. 2008). Therefore, we devised experiments to test the hypothesis that there was interaction between the H2S-and NO-generating systems and that endogenously generated NO maintained the RMP gradient in the absence of endogenously generated H2S. We used the NOS blocker l-NNA, nNOS-KO mice, CSE-KO mice and CSE-KO–nNOS-KO mice to determine if there was any interaction between the H2S system and NO system.
Effect of PAG on the transwall RMP gradient in l-NNA pretreated preparations
The NO synthase blocker l-NNA was used to inhibit NO production. During inhibition of NO, we tested the effect of PAG on the RMP gradient. In four preparations, tissues were pretreated with l-NNA (200 μm) for 30 min before recordings were made and maintained throughout the recording period, eliminating any possible transient/short-term changes in RMP. We recorded from 37 cells in four preparations. In the presence of l-NNA, smooth muscle cells had RMPs of –51.6 ± 1.2 mV in the inner group, −46.8 ± 0.5 mV in the middle group and −42.8 ± 0.7 mV in the outer group. None of these values was significantly different (P > 0.05) when compared to values obtained from tissue in NKS, indicating that l-NNA had no effect on RMPs and no effect on the transwall RMP gradient, confirming previous observations (Sha et al. 2010; Table 1). The slope of the mean regression line of the transwall gradient in l-NNA pretreated tissues was 1.33 ± 0.22 mV per 10% thickness (2.4 ± 0.3 mV per 10 μm; Fig. 2B), which was significantly (P < 0.05) different from 0 slope indicating the presence of a transwall RMP gradient. We then tested the effect of PAG. Thirty minutes after adding PAG (500 μm) to the l-NNA-containing solution, we recorded from 27 cells from the same four preparations. The mean RMP was −46.3 ± 0.8 mV for cells in the inner group, −42.4 ± 0.7 mV in the middle group and −41.0 ± 0.3 mV in the outer group (Table 1). The RMPs of all three groups were significantly (P < 0.05) depolarized when compared to the RMPs recorded from cells in the same preparations pretreated with l-NNA (Fig. 2C; Table 1). The slope of the mean regression line of the transwall gradient was 0.74 ± 0.09 mV per 10% thickness (1.2 ± 0.2 mV per 10 μm) which was significantly (P < 0.05) different from 0 slope but was not significantly different (P > 0.05) when compared with the slope in preparations pretreated with l-NNA. Thus, inhibiting CSE activity during inhibition of NOS activity caused a significant depolarization of muscle cells throughout the thickness of the circular muscle layer and shifted the transwall RMP gradient in the depolarizing direction (Fig. 2C). These results suggested that there was an interaction between the H2S-and NO-generating systems. H2S is known to inhibit the activity of iNOS, eNOS and nNOS (Kubo et al. 2007b; Kimura, 2010). We hypothesized that under control conditions, endogenously generated H2S acted on circular smooth muscle cells to hyperpolarize the RMP and, at the same time, inhibited NOS activity. Thus, adding the nNOS inhibitor l-NNA would have no effect because NO generation by nNOS was constitutively inhibited by endogenously generated H2S. Thus, we hypothesized that when CSE activity was inhibited by PAG, nNOS activity was disinhibited, generating NO which in turn acted on smooth muscle cells to hyperpolarize the RMPs of cells in the circular muscle layer and maintain the RMP in the absence of H2S. We tested this hypothesis by examining the effect of PAG in nNOS-KO mouse preparations.
Effect of PAG on the transwall RMP gradient in nNOS-KO mouse preparations
Forty-three cells were recorded from in five preparations from nNOS-KO mice (B6;129S4-Nos1tm1Plh/J) in NKS. The RMPs were −62.3 ± 1.4 mV for cells in the inner group, −57.3 ± 0.6 mV for cells in the middle group and −53.6 ± 0.9 mV for cells in the outer group (n = 5, Table 1). Thirty minutes after adding PAG (500 μm), we recorded from 44 cells in the same five preparations. Mean RMPs were −57.2 ± 0.8 mV for muscle cells in the inner group, −53.4 ± 0.6 mV for cells in the middle group and −48.7 ± 0.6 mV for cells in the outer group (Table 1). The RMPs in all three groups were significantly (P < 0.05) depolarized when compared to the RMPs recorded from cells in the absence of PAG, indicating a depolarizing shift of the entire gradient, similar to the finding in preparations from wild-type mice treated with l-NNA and PAG. The slope of the mean regression line of the transwall gradient was 1.26 ± 0.22 mV per 10% thickness (1.2 ± 0.30 mV per 10 μm) which was significantly different from 0 slope, indicating the presence of a transwall RMP gradient. Although the transwall gradient was shifted in the depolarizing direction, the slope was not significantly different from the slope found in the absence of PAG (Fig. 2D). The depolarizing shift in the gradient across the entire thickness of the circular muscle layer further supported our observations made in l-NNA-pretreated preparations. It is of interest to note here that the RMP values throughout the thickness of the circular muscle layer in nNOS-KO (B6;129S4-Nos1tml/Plh/J) mice were significantly (P < 0.01) more hyperpolarized (Table 1; Fig. 2D) than the RMPs recorded from C57BL/6J mice (Table 1; Fig. 3B and C). The reason(s) for the differences between the two strains is not known at the present time. The slope of the mean regression line of the transwall gradient in B6;129S4-Nos1tmlPlh/J mice was 1.48 ± 0.31 mV per 10% thickness (1.3 ± 0.2 mV per 10 μm), which was significantly (P < 0.05) different compared to 0 slope (Fig. 2D). The slopes of the mean regression lines of the transwall gradient after normalization in C57BL/6J and SJL/J mice were 1.29 mV per 10% thickness and 1.25 mV per 10% thickness, respectively. Both were significantly different from the slope of the regression line observed in the B6;129S4-Nos1tm1Plh/J (P < 0.05).
Figure 3.
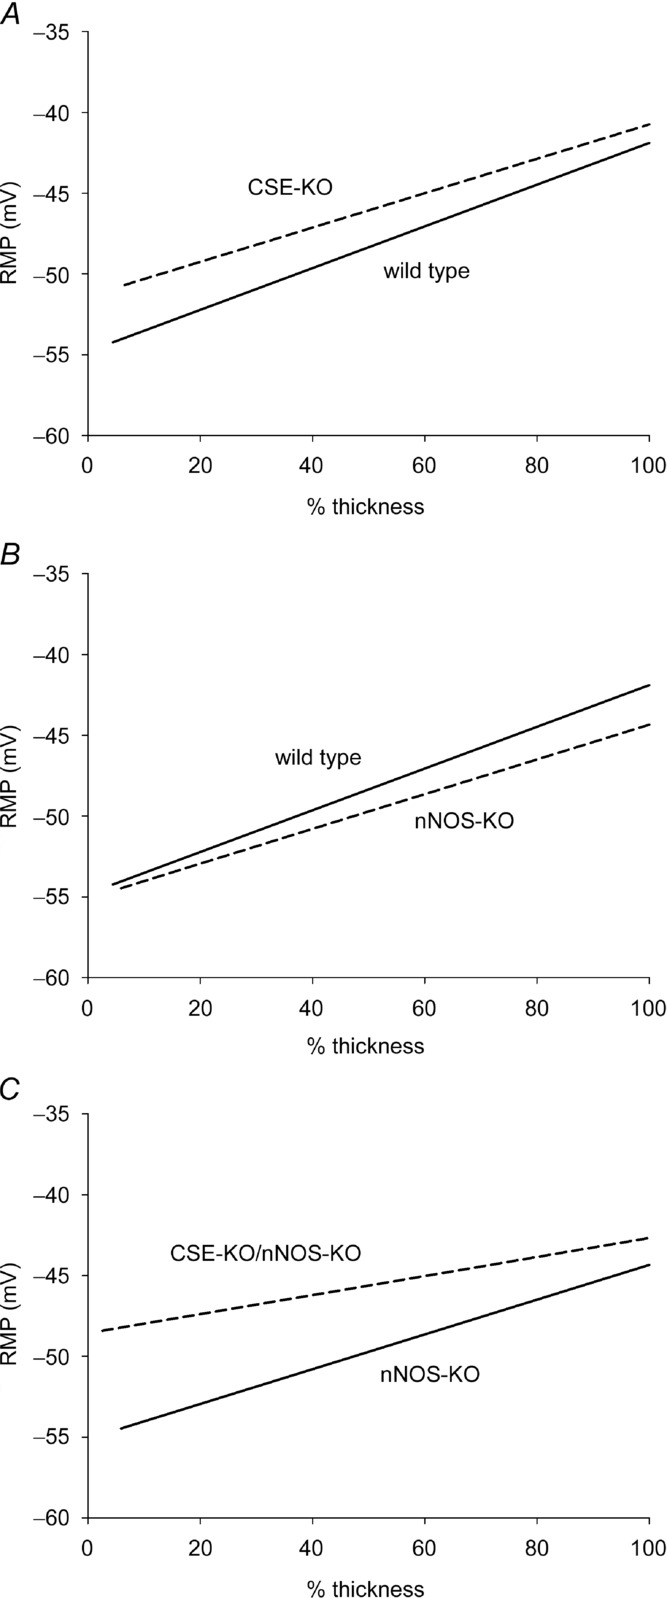
A, the transwall gradient in CSE-KO mice (dashed line) had no significant difference from wild-type littermate mice (continuous line). B, in nNOS-KO mice (dashed line), the RMP gradient was not significantly different compared to wild-type littermate mice (continuous line). C, the RMP gradient was shifted in the depolarizing direction in CSE-KO–nNOS-KO mice (dashed line) compared to littermate nNOS-KO mice (continuous line). In panels A–C, C57BL/6J mice were used.
Transwall RMP gradient in CSE-KO and CSE-KO–nNOS-KO mice
In this set of experiments, we examined the transwall gradient in CSE-KO mice. In littermate wild-type mice, the mean RMPs of circular smooth muscle cells in NKS were −51.7 ± 1.6 mV in the inner group, −48.0 ± 1.8 mV in the middle group and −43.9 ± 1.0 mV in the outer group (66 cells from six preparations; Table 1). The slope of the mean regression line was 1.29 ± 0.32 mV per 10% thickness (2.0 ± 0.6 mV per 10 μm) which was significantly (P < 0.05) different compared to 0 slope, indicating a transwall RMP gradient (Fig. 3A). In CSE-KO mice, the mean RMPs were −50.1 ± 1.4 mV in the inner group, −45.0 ± 0.9 mV in the middle group and −42.7 ± 0.6 mV in the outer group of cells (86 cells from 6 preparations; Table). The RMPs in muscle cells in the inner, middle and outer group were not significantly different (P > 0.05) compared to wild type. The slope of the mean regression line in CSE-KO mice was 1.07 ± 0.25 mV per 10% thickness (1.7 ± 0.6 mV per 10 μm) which was significantly (P < 0.05) different compared to 0 slope, indicating the presence of a transwall RMP gradient. However, the slope was not significantly different (P > 0.05) when compared to the slope in littermate wild-type mice. Thus, the gradient was maintained. Next, we examined the transwall RMP gradient in littermate nNOS-KO mice and in CSE-KO–nNOS-KO mice. In littermate nNOS-KO mice (33 cells from three preparations), the mean RMPs were −52.2 ± 1.6 mV for cells in the inner group, −50.5 ± 2.1 mV for cells in the middle group and −45.9 ± 0.7 mV for cells in the outer group (Table 1). Compared to wild-type mice, the RMPs were not significantly different in the inner, middle, and outer groups. The slope of the mean regression line was 1.08 ± 0.28 mV per 10% thickness (1.3 ± 0.2 mV per 10 μm) which was significantly (P < 0.05) different compared to 0 slope, indicating a RMP gradient (Fig. 3B). In CSE-KO–nNOS-KO mice (72 cells from six preparations), the gradient was shifted in the depolarizing direction. The RMPs were −47.9 ± 0.5 mV in the inner group, −45.4 ± 0.8 mV in the middle group, and −44.2 ± 0.5 mV in the outer group (n = 6 preparations; Table 1). Compared to the wild-type group, the RMP in the inner group was significantly (P < 0.05) depolarized (Fig. 3C; Table 1). Although the RMP in the middle group was also shifted in the depolarized direction, it did not reach significance (P > 0.05, Table 1). Compared to the nNOS-KO group, the RMPs in the inner and middle groups were significantly depolarized (P < 0.05). Although the RMP in the outer group was depolarized, the difference was not significant (P > 0.05). The slope of the mean transwall regression line in the double knockout mouse preparations was 0.59 ± 0.07 mV per 10% thickness (1.3 ± 0.02 mV per 10 μm), which was significantly (P < 0.05) different compared to 0 slope, indicating that, even though the transwall gradient was shifted in the depolarizing direction, the RMP gradient was still maintained. The results from preparations from CSE-KO mice support our results from preparations when CSE was blocked pharmacologically. When considered together, the data suggest that the absence of endogenously generated H2S production when endogenous production of NO also was absent shifted the transwall gradient in the depolarizing direction. The hyperpolarizing effect of endogenously generated H2S of RMPs on cells throughout the circular muscle layer could only be detected when the nNOS/NO pathway was blocked or deleted.
NO production was elevated in CSE-KO mouse preparations
To obtain direct evidence for the interaction between the NO-generating system and the H2S-generating system in the muscle layer of the mouse colon muscle, we evaluated NO production in CSE-KO mouse preparations and WT control mouse preparations using fluorescent DAF-2 probes. DAF-2 is nitrosated with an oxidation product of NO to form the highly fluorescent triazolofluorescein DAF-2T (Uhlenhut & Hogger, 2012). DAF-2 probes are widely used to evaluate NO production in living tissue (Sutherland et al. 2001; Brack et al. 2009; Kalinchuk et al. 2010). In CSE-KO mouse preparations, the average fluorescence intensity at room temperature was 732 ± 216 (n = 10). In WT control mouse preparations, the average fluorescence intensity was 454 ± 150 (n = 10), which was significantly (P < 0.01) lower compared to the CSE-KO mouse preparations (Fig. 4). As a comparison, blank controls without tissue had a fluorescence intensity of 86 ± 13 (n = 10). At 37°C, preparations from CSE-KO mice had a fluorescence intensity of 2533 ± 1147 whereas preparations from WT mice had a fluorescence intensity of 1351 ± 575. The difference was significant (P < 0.05; Fig. 5). The blank control had a fluorescence intensity of 133 ± 21 (n = 10) at 37°C. These results suggest that NO was generated in mouse colon preparations and that NO production was significantly elevated in the circular muscle layer in CSE-KO mice than in WT mice.
Figure 4.
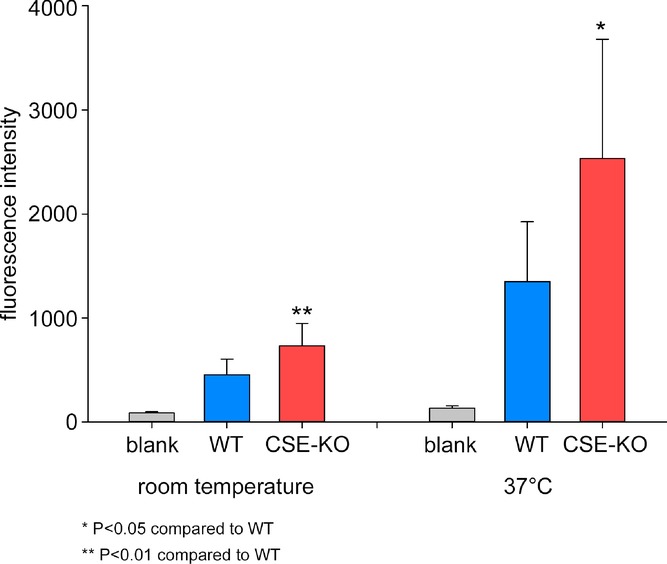
At room temperature and at 37°C, preparations from CSE-KO mice had significantly higher fluorescence intensity (red bars), suggesting that there was more NO released in CSE-KO mouse preparations compared to WT mouse preparations.
Figure 5.
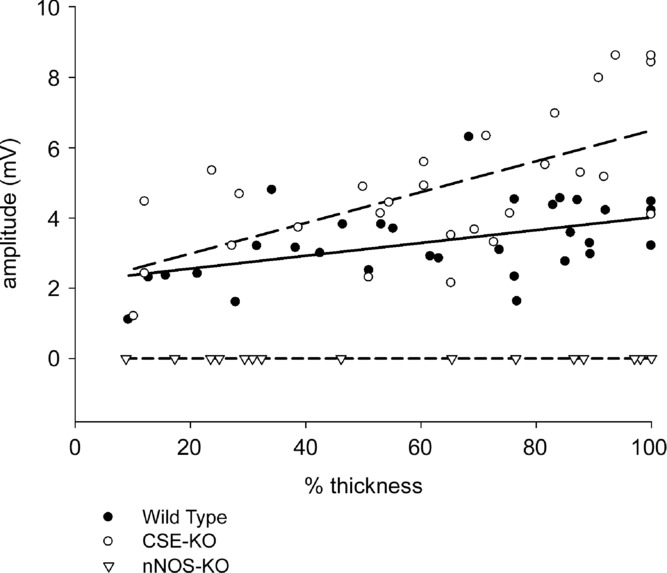
Each symbol represents the amplitude of the slow IJP recorded from a circular smooth muscle cell. Filled circles are S-IJP amplitudes recorded in wild-type mouse preparations, open circles in CSE-KO mouse preparation and triangles from nNOS-KO mouse preparations. The continuous line is the regression line for cells recorded in wild-type mouse preparations and the upper dashed line is the regression line for cells recorded in CSE-KO mouse preparations. The mouse strain used was C57BL/6J.
nNOS-dependent S-IJPs were potentiated in CSE-KO preparations
To further test the hypothesis that there was interaction between the H2S-and NO-generating systems, we measured the amplitudes of the S-IJP in wild-type and CSE-KO preparations. The S-IJP in the mouse colon is NO dependent (Storr et al. 2002; Sibaev et al. 2003). First, we tested and confirmed that S-IJPs in the mouse colonic muscle cells are nNOS dependent. Sixteen circular smooth muscle cells were recorded throughout the thickness of circular muscle layer from two preparations of nNOS-KO mice. In all 16 cells, S-IJPs were not observed during electric field stimulation (Fig. 5). This result indicated that S-IJPs in mouse colon are nNOS dependent. We reasoned that if H2S inhibits NO production from nNOS, the amplitude of the S-IJP would be increased in preparations with reduced H2S production. Therefore, we measured the amplitude of the S-IJP in CSE-KO mice and in WT mice to determine whether the S-IJP was potentiated in CSE-KO preparations when H2S production from CSE was absent. We recorded from 28 circular smooth muscle cells throughout the thickness of circular muscle layer from three preparations of wild-type mice. IJPs were evoked in each cell with electrical field stimulation. S-IJP recorded in different locations of the circular muscle layer had an average amplitude of 3.34 ± 0.20 mV. In the region close to submucosal border, the S-IJP amplitude was 2.08 ± 0.26 mV (n = 7). In the region close to myenteric border, the S-IJP amplitude was 3.81 ± 0.21 mV (n = 14). We recorded from 31 circular smooth muscle cells throughout the thickness of circular muscle layer from three preparations of CSE-KO mice. The S-IJPs evoked by electric field stimulation with the same stimulating parameters had an average amplitude of 4.78 ± 0.38 mV which was significantly greater than the amplitude of S-IJPs in WT mice (P < 0.01). Cells in the region close to submucosal border (n = 7) had a S-IJP amplitude of 3.55 ± 0.64 mV which was significantly (P < 0.05) greater than those in WT mice. Cells in the region close to myenteric border (n = 13) had a S-IJP amplitude of 6.20 ± 0.55 mV which was significantly higher (P < 0.01) than those from WT mice. These data are summarized in Fig. 5. In this figure, all cells recorded from in preparations of WT and CSE-KO mice were plotted with the cell's S-IJP amplitude plotted on the y-axis and the depth of the cell from the mucosal border in circular muscle layer on the x-axis. These results show that NO production by nNOS during electric field stimulation was potentiated when H2S production by CSE was absent, suggesting that H2S inhibited NO production from nNOS.
CSE and nNOS immunoreactivity
Since there was interaction between the H2S-and NO-generated systems, we used fluorescence immunohistochemistry to determine the distribution of nNOS and CSE. Double immunostaining for CSE and nNOS was done in four preparations from four animals. CSE-immunoreactivity (IR) was observed only in neuronal cell bodies of submucosal and myenteric ganglia. No other structure in the submucosal and myenteric ganglia was positive for CSE-IR. No CSE-IR was observed in muscle cells, ICC or nerve fibres. nNOS-IR was found in neuronal cell bodies of both plexuses, in nerve fibres in both plexuses and between muscle cells in both muscle layers. We quantitated the number of CSE positive enteric ganglion neurons, the number of nNOS positive enteric ganglion neurons and the number of neurons that were positive for both enzymes in the myenteric and submucous plexuses. In the four preparations from four animals, the average number of neurons in a submucosal ganglion was 6.1 ± 0.6 and the number in a myenteric ganglion was 27.6 ± 1.5. All submucosal neurons and nearly all myenteric neurons were CSE-IR positive (Fig. 6A and D). There were 6.1 ± 0.6 CSE-IR-positive neurons per ganglion in the submucosal plexus and 27.0 ± 1.5 CSE-IR-positive neurons per ganglion in myenteric plexus. nNOS-IR was observed in a few submucosal neurons and in about 50% of myenteric neurons (Fig. 6B and E). In the submucosal plexus, there were 0.7 ± 0.2 nNOS-IR-positive neurons per ganglion and 13.6 ± 1.6 nNOS-IR-positive neurons per ganglion in the myenteric plexus. All nNOS-IR-positive neurons in both plexuses were CSE positive. Interestingly, the ratio between nNOS-IR-positive neurons and CSE-IR-positive neurons was only 11.4:100 in submucosal ganglia while the ratio between nNOS-IR-positive neurons and CSE-IR-positive neurons was much higher at 50.4:100 in myenteric ganglia, which suggested that there was less NO-producing capacity in the submucosal plexus than in myenteric plexus. These immunostaining results show that both enzymes were co-localized in many of the same neurons and suggest that both H2S and NO could be generated and released from the same neuronal cell bodies in both plexuses.
Figure 6.
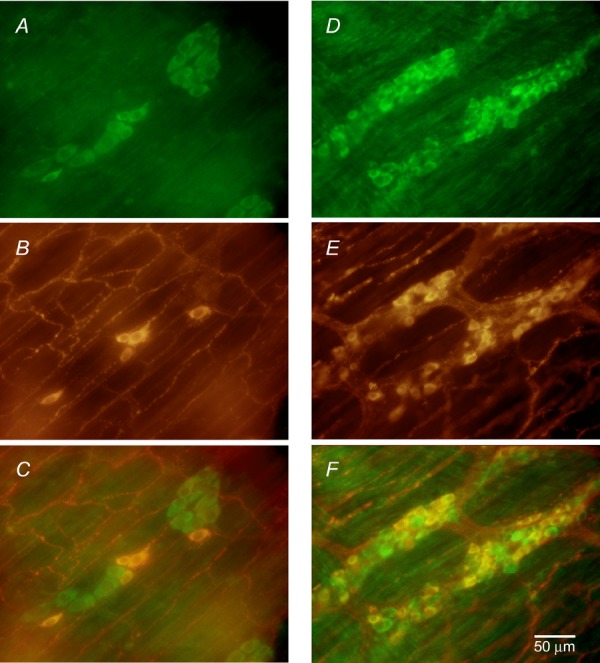
A, CSE-IR in neurons in submucosal ganglia; B, nNOS-IR in neurons in submucosal ganglia and nerve fibres; C, superimposed images from A and B. D, CSE-IR in neurons in myenteric ganglia. E, nNOS-IR in neurons of myenteric ganglia and nerve fibres. F, superimposed images from superimposition of D and E.
Discussion
The results of this study show that endogenously generated H2S acted in a paracrine fashion to hyperpolarize the membrane potential of circular smooth muscle cells throughout the circular muscle layer, thereby shifting the RMP gradient in the hyperpolarizing direction, and that endogenously generated H2S inhibited NO generation from nNOS, most likely in an autocrine fashion. The effect of endogenously generated H2S on the RMP gradient was only detected when nNOS was blocked pharmacologically or in nNOS-KO mice. Furthermore, the CSE inhibitor PAG shifted the entire RMP gradient in the depolarizing direction when nNOS was blocked by l-NNA and in nNOS-KO mice. The RMP gradient also was shifted in the depolarizing direction in CSE-KO–nNOS-KO mice. These data show that NO can replace the function of H2S on the smooth muscle transwall gradient when H2S production is reduced. The conclusion that H2S inhibited nNOS receives support from our observation that NO production was significantly elevated in CSE-KO mice. Moreover, S-IJPs were potentiated in CSE-KO mice, further indicating that NO production from nNOS was disinhibited when H2S production from CSE was absent.
Previous results by others have shown that H2S modulates the NOS–NO pathway. For example, H2S enhances iNOS expression (Jeong et al. 2006) and H2S inhibits eNOS activity (Ali et al. 2006; Kubo et al. 2007a). l-Cysteine and l-homocysteine, precursors of H2S, have been shown to inhibit NO induced muscle relaxation in rabbit aorta (Li et al. 1997). H2S has been found to inhibit the activity of recombinant nNOS (Kubo et al. 2007b). The results from the present study show in living tissue that NO production was inhibited by H2S and they provide direct evidence that NO production from nNOS was inhibited by H2S produced by CSE.
Immunoreactivity for CSE was found in almost all enteric neurons of both the submucosal plexus and myenteric plexus, suggesting that H2S generated by CSE could act in a paracrine fashion on smooth muscle cells close to submucosal border and on smooth muscle cells close to myenteric border. We also found immunoreactivity for nNOS in both plexuses of mouse colon, supporting the observations made by Vannucchi et al. (2002) and Matsumoto et al. (2011). In contrast to CSE, our quantitation of nNOS immunohistochemistry showed that nNOS was found in significantly fewer submucosal plexus neurons than in myenteric plexus neurons, suggesting that there was less NO production from nNOS in submucosal plexus than in myenteric plexus. NO mediates inhibitory nerve input in the gastrointestinal tract of dogs, rats, mice and humans (Stark et al. 1993; Mashimo et al. 1996; Rae et al. 1998; Storr et al. 2002; Gallego et al. 2008; Zhang et al. 2008). In the mouse colon, IJPs consist of an initial fast component mediated by ATP (Serio et al. 2003; Gallego et al. 2012) followed by a slow component (S-IJP) mediated by NO (Storr et al. 2002; Sibaev et al. 2003). Our results confirm previous observations that show that the S-IJP is mediated by NO and expand on them by showing the S-IJP amplitude was smaller in cells close to submucosal border and larger in cells close to myenteric border, suggesting that there was greater NO released in regions of the circular muscle layer close to myenteric plexus than in regions close to submucosal plexus. This difference in NO production and release from nNOS probably explains why the RMPs of smooth muscle cells close to submucosal border depolarized more than the smooth muscle cells close to the myenteric border when H2S production was inhibited with PAG and NO production from nNOS was disinhibited. Another reason for the differences in S-IJP amplitudes may be related to the differences in RMP of the smooth muscle cells. The driving force on the ion(s) that mediate the S-IJP is greater in smooth muscle cells in the outer circular smooth muscle cells than it is in the more hyperpolarized muscle cells in the inner layer.
Our data also show that endogenously generated H2S inhibited both constitutive NO synthesis from nNOS and nerve activity-induced NO synthesis from nNOS. Though we cannot eliminate the possibility that H2S might also affect NO production from eNOS and iNOS, as both forms of the enzymes are also present in mouse colon (Vannucchi et al. 2002), the RMP gradient was influenced mainly by NO production from nNOS when H2S synthesis was reduced.
The results from this study and from our previous studies on the role of endogenously generated CO (Farrugia et al. 2003; Sha et al. 2010) suggest that both H2S and CO are constitutively generated in the muscle wall of the mouse colon in a tonic manner in which no on–off switch is required. Although HO-2 is found in neurons in both the submucous and myenteric plexuses, the predominate source of endogenously generated CO that drives the transwall gradient is HO-2-containing neurons in the submucous plexus (Sha et al. 2010). Surgically removing the submucous plexus abolishes the gradient (Sha et al. 2010) and HO-2 activity is significantly greater in the inner half of colon than it is in the outer half (Farrugia et al. 2003). Endogenous H2S is generated in both the submucosal and myenteric ganglion neurons, hence it modulates the RMP throughout the circular muscle layer. The endogenous generation of NO is more tightly regulated. Because NO functions as a major mediator of the S-IJP, it might be important physiologically to have a modulatory mechanism whereby endogenously generated NO does not dominate the control of the RMP transwall gradient as does CO and H2S. An additional point that should be made regarding the possible interaction between the three endogenous gases is that the RMPs in the nNOS-KO mice from a mixed genetic background (B6;129S4-Nos1tm1Plh/J) were considerably more hyperpolarized compared to the congenic C57BL/6J nNOS-KO mice. One possible explanation is that the endogenous production of CO and H2S is more tightly regulated in mice of mixed background and that both HO-2 and CSE are disinhibited to a greater degree in the genetic blockade of nNOS in B6;129S4-Nos1tm1Plh/J B6 mice (Wang et al. 2003; Kajimura et al. 2010).
In conclusion, endogenous constitutive production of H2S functions as a stealth hyperpolarizing factor in the circular muscle layer of the mouse colon to maintain the transwall gradient and acts on nNOS to inhibit endogenous generation of NO.
Key points
A CO-dependent transwall gradient of resting membrane potential exists across the circular muscle layer in the gastrointestinal tract; this gradient regulates the strength of phasic muscle contraction during electrical slow wave activity.
H2S, CO and NO are endogenously generated in the muscle layers of the gut wall.
Inhibiting the H2S producing enzyme CSE with the CSE inhibitor PAG had no significant effect on transwall resting membrane potential gradient in control preparations but significantly shifted the entire gradient in the depolarizing direction in preparations pretreated with the NO synthase (NOS) inhibitor l-NNA.
PAG significantly shifted the gradient in the depolarizing direction in mouse preparations lacking neuronal NOS (nNOS-KO) and the gradient was significantly shifted in the depolarizing direction in mouse preparations lacking both nNOS and CSE (CSE-KO–nNOS-KO).
NO production was significantly higher in CSE-KO mouse preparations compared to wild-type mouse preparations and the amplitude of NO-mediated slow inhibitory junction potentials (S-IJPs) was significantly higher in CSE-KO mouse preparations compared to the amplitude of S-IJPs in wild-type mouse preparations.
Nearly all submucosal neurons and myenteric neurons were CSE positive and 11% of submucosal neurons and 50% of myenteric neurons were nNOS positive.
Our novel findings suggested that endogenous H2S is a stealth hyperpolarizing factor on smooth muscle cells and that endogenous H2S inhibits NO production from nNOS.
Acknowledgments
The authors thank Dr Rui Wang for providing us with CSE-KO mice. The authors also thank Mr William Harmsen for statistical analysis and Jan Applequist for her help in preparing this article.
Glossary
- ATP
adenosine triphosphate
- CBS
cystathionine-β-synthase
- CO
carbon monoxide
- CO2
carbon dioxide
- CSE
cystathionine-γ-lyase
- CSE-KO
CSE knockout
- CSE-KO–nNOS-KO
CSE and nNOS double knockout
- DAF-2 DA
4,5-diaminofluorescein diacetate
- eNOS
endothelial nitric oxide synthase; hemeoxygenase 2 (HO-2)
- H2S
hydrogen sulfide
- iNOS
inducible nitric oxide synthase
- IR
immunoreactivity
- l-NNA
N-nitro-l-arginine
- NKS
normal Krebs solution
- nNOS
neuronal nitric oxide synthase
- nNOS-KO
nNOS knockout
- NO
nitric oxide
- PAG
dl-propargylglycine
- RMP
resting membrane potential
- S-IJPs
slow inhibitory junction potentials
- WT
wild type.
Additional information
Competing interests
There are no competing interests.
Author contributions
L.S. and J.H.S. conceived and designed the study. L.S. performed experiments. L.S. and J.H.S. analysed the data. All authors contributed to writing the article and approved the final version of the article.
Funding
This work is supported by NIH DK17238.
References
- Ali MY, Ping CY, Mok YY, Ling L, Whiteman M, Bhatia M, Moore PK. Regulation of vascular nitric oxide in vitro and in vivo; a new role for endogenous hydrogen sulphide. Br J Pharmacol. 2006;149:625–634. doi: 10.1038/sj.bjp.0706906. [DOI] [PMC free article] [PubMed] [Google Scholar]
- Bauer AJ, Reed JB, Sanders KM. Slow wave heterogeneity within the circular muscle of the canine gastric antrum. J Physiol. 1985;366:221–232. doi: 10.1113/jphysiol.1985.sp015793. [DOI] [PMC free article] [PubMed] [Google Scholar]
- Brack KE, Patel VH, Mantravardi R, Coote JH, Ng GA. Direct evidence of nitric oxide release from neuronal nitric oxide synthase activation in the left ventricle as a result of cervical vagus nerve stimulation. J Physiol. 2009;587:3045–3054. doi: 10.1113/jphysiol.2009.169417. [DOI] [PMC free article] [PubMed] [Google Scholar]
- Diggle P, Liang KY, Zeger SL. Analysis of Longitudinal Data. Oxford: Clarendon Press; 1994. [Google Scholar]
- Farrugia G, Lei S, Lin X, Miller SM, Nath KA, Ferris CD, Levitt M, Szurszewski JH. A major role for carbon monoxide as an endogenous hyperpolarizing factor in the gastrointestinal tract. Proc Natl Acad Sci U S A. 2003;100:8567–8570. doi: 10.1073/pnas.1431233100. [DOI] [PMC free article] [PubMed] [Google Scholar]
- Gallego D, Gil V, Aleu J, Auli M, Clave P, Jimenez M. Purinergic and nitrergic junction potential in the human colon. Am J Physiol Gastrointest Liver Physiol. 2008;295:G522–G533. doi: 10.1152/ajpgi.00510.2007. [DOI] [PubMed] [Google Scholar]
- Gallego D, Gil V, Martinez-Cutillas M, Mane N, Martin MT, Jimenez M. Purinergic neuromuscular transmission is absent in the colon of P2Y1 knocked out mice. J Physiol. 2012;590:1943–1956. doi: 10.1113/jphysiol.2011.224345. [DOI] [PMC free article] [PubMed] [Google Scholar]
- Gil V, Parsons SP, Gallego D, Huizinga JD, Jimenez M. Effects of hydrogen sulphide on motility patterns in the rat colon. Br J Pharmacol. 2013;169:34–50. doi: 10.1111/bph.12100. [DOI] [PMC free article] [PubMed] [Google Scholar]
- Giles TD, Sander GE, Nossaman BD, Kadowitz PJ. Impaired vasodilation in the pathogenesis of hypertension: focus on nitric oxide, endothelial-derived hyperpolarizing factors, and prostaglandins. J Clin Hypertens (Greenwich) 2012;14:198–205. doi: 10.1111/j.1751-7176.2012.00606.x. [DOI] [PMC free article] [PubMed] [Google Scholar]
- Hara Y, Kubota M, Szurszewski JH. Electrophysiology of smooth muscle of the small intestine of some mammals. J Physiol. 1986;372:501–520. doi: 10.1113/jphysiol.1986.sp016022. [DOI] [PMC free article] [PubMed] [Google Scholar]
- Hosoki R, Matsuki N, Kimura H. The possible role of hydrogen sulfide as an endogenous smooth muscle relaxant in synergy with nitric oxide. Biochem Biophys Res Commun. 1997;237:527–531. doi: 10.1006/bbrc.1997.6878. [DOI] [PubMed] [Google Scholar]
- Jeong SO, Pae HO, Oh GS, Jeong GS, Lee BS, Lee S, Kim dY, Rhew HY, Lee KM, Chung HT. Hydrogen sulfide potentiates interleukin-1beta-induced nitric oxide production via enhancement of extracellular signal-regulated kinase activation in rat vascular smooth muscle cells. Biochem Biophys Res Commun. 2006;345:938–944. doi: 10.1016/j.bbrc.2006.05.002. [DOI] [PubMed] [Google Scholar]
- Kajimura M, Fukuda R, Bateman RM, Yamamoto T, Suematsu M. Interactions of multiple gas-transducing systems: hallmarks and uncertainties of CO, NO, and H2S gas biology. Antioxid Redox Signal. 2010;13:157–192. doi: 10.1089/ars.2009.2657. [DOI] [PMC free article] [PubMed] [Google Scholar]
- Kalinchuk AV, McCarley RW, Porkka-Heiskanen T, Basheer R. Sleep deprivation triggers inducible nitric oxide-dependent nitric oxide production in wake-active basal forebrain neurons. J Neurosci. 2010;30:13254–13264. doi: 10.1523/JNEUROSCI.0014-10.2010. [DOI] [PMC free article] [PubMed] [Google Scholar]
- Kimura H. Hydrogen sulfide: from brain to gut. Antioxid Redox Signal. 2010;12:1111–1123. doi: 10.1089/ars.2009.2919. [DOI] [PubMed] [Google Scholar]
- Kubo S, Doe I, Kurokawa Y, Nishikawa H, Kawabata A. Direct inhibition of endothelial nitric oxide synthase by hydrogen sulfide: contribution to dual modulation of vascular tension. Toxicology. 2007a;232:138–146. doi: 10.1016/j.tox.2006.12.023. [DOI] [PubMed] [Google Scholar]
- Kubo S, Kurokawa Y, Doe I, Masuko T, Sekiguchi F, Kawabata A. Hydrogen sulfide inhibits activity of three isoforms of recombinant nitric oxide synthase. Toxicology. 2007b;241:92–97. doi: 10.1016/j.tox.2007.08.087. [DOI] [PubMed] [Google Scholar]
- Li J, Liu XJ, Furchgott RF. Blockade of nitric oxide-induced relaxation of rabbit aorta by cysteine and homocysteine. Acta Pharmacologica Sinica. 1997;18:11–20. [PubMed] [Google Scholar]
- Linden DR. Hydrogen sulfide signaling in the gastrointestinal tract. Antioxid Redox Signal. 2013 doi: 10.1089/ars.2013.5312. 2013 May 19. [Epub ahead of print] DOI: 10.1089/ars.2013.5312. [DOI] [PMC free article] [PubMed] [Google Scholar]
- Linden DR, Furne J, Stoltz GJ, Abdel-Rehim MS, Levitt MD, Szurszewski JH. Sulphide quinone reductase contributes to hydrogen sulphide metabolism in murine peripheral tissues but not in the CNS. Br J Pharmacol. 2012;165:2178–2190. doi: 10.1111/j.1476-5381.2011.01681.x. [DOI] [PMC free article] [PubMed] [Google Scholar]
- Linden DR, Sha L, Mazzone A, Stoltz GJ, Bernard CE, Furne JK, Levitt MD, Farrugia G, Szurszewski JH. Production of the gaseous signal molecule hydrogen sulfide in mouse tissues. J Neurochem. 2008;106:1577–1585. doi: 10.1111/j.1471-4159.2008.05502.x. [DOI] [PMC free article] [PubMed] [Google Scholar]
- Mashimo H, He XD, Huang PL, Fishman MC, Goyal RK. Neuronal constitutive nitric oxide synthase is involved in murine enteric inhibitory neurotransmission. J Clin Invest. 1996;98:8–13. doi: 10.1172/JCI118781. [DOI] [PMC free article] [PubMed] [Google Scholar]
- Matsumoto K, Hosoya T, Tashima K, Namiki T, Murayama T, Horie S. Distribution of transient receptor potential vanilloid 1 channel-expressing nerve fibers in mouse rectal and colonic enteric nervous system: relationship to peptidergic and nitrergic neurons. Neuroscience. 2011;172:518–534. doi: 10.1016/j.neuroscience.2010.10.024. [DOI] [PubMed] [Google Scholar]
- Mustafa AK, Sikka G, Gazi SK, Steppan J, Jung SM, Bhunia AK, Barodka VM, Gazi FK, Barrow RK, Wang R, Amzel LM, Berkowitz DE, Snyder SH. Hydrogen sulfide as endothelium-derived hyperpolarizing factor sulfhydrates potassium channels. Circ Res. 2011;109:1259–1268. doi: 10.1161/CIRCRESAHA.111.240242. [DOI] [PMC free article] [PubMed] [Google Scholar]
- Rae MG, Khoyi MA, Keef KD. Modulation of cholinergic neuromuscular transmission by nitric oxide in canine colonic circular smooth muscle. Am J Physiol Gastrointest Liver Physiol. 1998;275:G1324–G1332. doi: 10.1152/ajpgi.1998.275.6.G1324. [DOI] [PubMed] [Google Scholar]
- Serio R, Alessandro M, Zizzo MG, Tamburello MP, Mule F. Neurotransmitters involved in the fast inhibitory junction potentials in mouse distal colon. Eur J Pharmacol. 2003;460:183–190. doi: 10.1016/s0014-2999(02)02923-0. [DOI] [PubMed] [Google Scholar]
- Sha L, Farrugia G, Harmsen WS, Szurszewski JH. Membrane potential gradient is carbon monoxide-dependent in mouse and human small intestine. Am J Physiol Gastrointest Liver Physiol. 2007;293:G438–G445. doi: 10.1152/ajpgi.00037.2007. [DOI] [PubMed] [Google Scholar]
- Sha L, Farrugia G, Linden DR, Szurszewski JH. The transwall gradient across the mouse colonic circular muscle layer is carbon monoxide dependent. FASEB J. 2010;24:3840–3849. doi: 10.1096/fj.10-156232. [DOI] [PMC free article] [PubMed] [Google Scholar]
- Sibaev A, Franck H, Vanderwinden JM, Allescher HD, Storr M. Structural differences in the enteric neural network in murine colon: impact on electrophysiology. Am J Physiol Gastrointest Liver Physiol. 2003;285:G1325–G1334. doi: 10.1152/ajpgi.00506.2002. [DOI] [PubMed] [Google Scholar]
- Smith TK, Reed JB, Sanders KM. Interaction of two electrical pacemakers in muscularis of canine proximal colon. Am J Physiol Cell Physiol. 1987;252:C290–C299. doi: 10.1152/ajpcell.1987.252.3.C290. [DOI] [PubMed] [Google Scholar]
- Stark ME, Bauer AJ, Sarr MG, Szurszewski JH. Nitric oxide mediates inhibitory nerve input in human and canine jejunum. Gastroenterology. 1993;104:398–409. doi: 10.1016/0016-5085(93)90407-4. [DOI] [PubMed] [Google Scholar]
- Storr M, Koppitz P, Sibaev A, Saur D, Kurjak M, Franck H, Schusdziarra V, Allescher HD. Melatonin reduces non-adrenergic, non-cholinergic relaxant neurotransmission by inhibition of nitric oxide synthase activity in the gastrointestinal tract of rodents in vitro. J Pineal Res. 2002;33:101–108. doi: 10.1034/j.1600-079x.2002.02909.x. [DOI] [PubMed] [Google Scholar]
- Sutherland H, Khundkar R, Zolle O, McArdle A, Simpson AW, Jarvis JC, Salmons S. A fluorescence-based method for measuring nitric oxide in extracts of skeletal muscle. Nitric Oxide. 2001;5:475–481. doi: 10.1006/niox.2001.0374. [DOI] [PubMed] [Google Scholar]
- Suzuki N, Prosser CL, Dahms V. Boundary cells between longitudinal and circular layers: essential for electrical slow waves in cat intestine. Am J Physiol Gastrointest Liver Physiol. 1986;250:G287–G294. doi: 10.1152/ajpgi.1986.250.3.G287. [DOI] [PubMed] [Google Scholar]
- Szurszewski JH. Electrical basis for gastrointestinal motility. In: Johnson LR, Christensen J, Jackson MJ, Jacobson ED, Walsh JH, editors. Physiology of the Gastrointestinal Tract. New York: Raven Press; 1987. pp. 383–422. [Google Scholar]
- Szurszewski JH, Farrugia G. Carbon monoxide is an endogenous hyperpolarizing factor in the gastrointestinal tract. Neurogastroenterol Motil. 2004;16(Suppl. 1):81–85. doi: 10.1111/j.1743-3150.2004.00480.x. [DOI] [PubMed] [Google Scholar]
- Tang G, Wu L, Liang W, Wang R. Direct stimulation of K(ATP) channels by exogenous and endogenous hydrogen sulfide in vascular smooth muscle cells. Mol Pharmacol. 2005;68:1757–1764. doi: 10.1124/mol.105.017467. [DOI] [PubMed] [Google Scholar]
- Tang G, Wu L, Wang R. Interaction of hydrogen sulfide with ion channels. Clin Exp Pharmacol Physiol. 2010;37:753–763. doi: 10.1111/j.1440-1681.2010.05351.x. [DOI] [PubMed] [Google Scholar]
- Uhlenhut K, Hogger P. Pitfalls and limitations in using 4,5-diaminofluorescein for evaluating the influence of polyphenols on nitric oxide release from endothelial cells. Free Radic Biol Med. 2012;52:2266–2275. doi: 10.1016/j.freeradbiomed.2012.03.006. [DOI] [PubMed] [Google Scholar]
- Vannucchi MG, Corsani L, Bani D, Faussone-Pellegrini MS. Myenteric neurons and interstitial cells of Cajal of mouse colon express several nitric oxide synthase isoforms. Neurosci Lett. 2002;326:191–195. doi: 10.1016/s0304-3940(02)00338-5. [DOI] [PubMed] [Google Scholar]
- Wang J, Lu S, Moenne-Loccoz P, Ortiz de Montellano PR. Interaction of nitric oxide with human heme oxygenase-1. J Biol Chem. 2003;278:2341–2347. doi: 10.1074/jbc.M211131200. [DOI] [PubMed] [Google Scholar]
- Wang R. Signaling pathways for the vascular effects of hydrogen sulfide. Curr Opin Nephrol Hypertens. 2011;20:107–112. doi: 10.1097/MNH.0b013e3283430651. [DOI] [PubMed] [Google Scholar]
- Wang R. Physiological implications of hydrogen sulfide: a whiff exploration that blossomed. Physiol Rev. 2012;92:791–896. doi: 10.1152/physrev.00017.2011. [DOI] [PubMed] [Google Scholar]
- Yang G, Wu L, Jiang B, Yang W, Qi J, Cao K, Meng Q, Mustafa AK, Mu W, Zhang S, Snyder SH, Wang R. H2S as a physiologic vasorelaxant: hypertension in mice with deletion of cystathionine gamma-lyase. Science. 2008;322:587–590. doi: 10.1126/science.1162667. [DOI] [PMC free article] [PubMed] [Google Scholar]
- Zhang Y, Mashimo H, Paterson WG. Regional differences in nitrergic innervation of the smooth muscle of murine lower oesophageal sphincter. Br J Pharmacol. 2008;153:517–527. doi: 10.1038/sj.bjp.0707573. [DOI] [PMC free article] [PubMed] [Google Scholar]
- Zhao W, Zhang J, Lu Y, Wang R. The vasorelaxant effect of H2S as a novel endogenous gaseous KATP channel opener. EMBO J. 2001;20:6008–6016. doi: 10.1093/emboj/20.21.6008. [DOI] [PMC free article] [PubMed] [Google Scholar]
- Zhong GZ, Li YB, Liu XL, Guo LS, Chen ML, Yang XC. Hydrogen sulfide opens the KATP channel on rat atrial and ventricular myocytes. Cardiology. 2010;115:120–126. doi: 10.1159/000260073. [DOI] [PubMed] [Google Scholar]