

Abstract
Force in striated muscle is due to attachment of the heads of the myosin, the molecular motors extending from the myosin filament, to the actin filament in each half-sarcomere, the functional unit where myosin motors act in parallel. Mechanical and X-ray structural evidence indicates that at the plateau of isometric contraction (force T0), less than half of the elastic strain of the half-sarcomere is due to the strain in the array of myosin motors (s), with the remainder being accounted for by the compliance of filaments acting as linear elastic elements in series with the motor array. Early during the development of isometric force, however, the half-sarcomere compliance has been found to be less than that expected from the linear elastic model assumed above, and this non-linearity may affect the estimate of s. This question is investigated here by applying nanometre–microsecond-resolution mechanics to single intact fibres from frog skeletal muscle at 4°C, to record the mechanical properties of the half-sarcomere throughout the development of force in isometric contraction. The results are interpreted with mechanical models to estimate the compliance of the myosin motors. Our conclusions are as follows: (i) early during the development of an isometric tetanus, an elastic element is present in parallel with the myosin motors, with a compliance of ∼200 nm MPa−1 (∼20 times larger than the compliance of the motor array at T0); and (ii) during isometric contraction, s is 1.66 ± 0.05 nm, which is not significantly different from the value estimated with the linear elastic model.
Introduction
The development of isometric force by a skeletal muscle fibre is due to attachment of the myosin heads (the molecular motors), extending from the myosin filament, to the overlapping actin filament. The rise of force is accompanied by the increase of fibre stiffness as the number of motors bound to actin increases. At the level of the half-sarcomere (hs), the functional unit where myosin motors act in parallel, the increase in stiffness is not linearly related to the increase in force, due to the significant contribution of the compliances of the actin and myosin filaments to the hs elasticity (Huxley et al. 1994; Wakabayashi et al. 1994; Linari et al. 1998). For the same reasons, the hs strain does not represent an estimate of the average strain of the myosin motors, as originally inferred from the assumption that filament compliance is negligible (Huxley & Simmons, 1971; Ford et al. 1977, 1981), but is due to the combination of the strains of the actin filament, myosin filament and myosin motors.
X-Ray diffraction experiments provided estimates of the change in strain of the myosin and actin filaments of 0.23–0.26% for a force change equivalent to the maximal force developed in an isometric tetanus, T0 (Huxley et al. 1994, 2006; Wakabayashi et al. 1994; Reconditi et al. 2004; Piazzesi et al. 2007). From these values, taking into account the distribution of strain along the filaments (Ford et al. 1981), a filament compliance (Cf) of 12–14 nm MPa−1 can be calculated (Reconditi et al. 2004; Piazzesi et al. 2007; Park-Holohan et al. 2012). Similar values of Cf were obtained from mechanical experiments (Brunello et al. 2006; Fusi et al. 2010), in which the hs stiffness was measured during the rise in force in an isometric tetanus, when force is modulated by the number of myosin motors in each hs. In these conditions, the force per motor is assumed to stay constant, while the hs strain (Y) increases with force (T) in proportion to the increase of myofilament strain, according to a simple mechanical model of the half-sarcomere (model 1 in Fig. 1; Bagni et al. 2005; Brunello et al. 2006; Fusi et al. 2010), where Y is given by:
Figure 1.
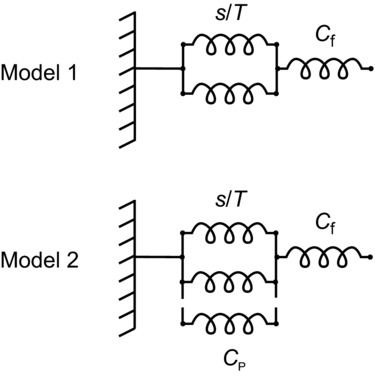
In model 1, the myofilament compliance (Cf) is in series with an array of elastic elements acting in parallel inside the array, representing the attached myosin motors (only two are shown for simplicity) with a constant strain (s). The isometric force (T) exerted by the array increases linearly with the number of attached motors, so that the compliance of the array is s/T, inversely proportional to the level of isometric force. In model 2, an elastic element with compliance CP, independent of the isometric force T, is added in parallel with the array of motors. Following the distributed filament compliance analysis reported in Appendix A of Ford et al. (1981), the models can be used to calculate the contribution of the various elements to the half-sarcomere compliance when the compliance of the filaments is not too large compared with the compliance of the array (s/T or s/T in parallel with CP), which is always the case for the present data.
| (1) |
with s being the average strain of the array of myosin motors. In the range of forces T ≥ 0.4T0, the hs strain–force relation was found to be linear, with a slope and an ordinate intercept that, according to eqn (1), estimated Cf and s, respectively.
According to this analysis, s is less than one-fifth of the 11 nm working stroke suggested by the tilting lever-arm model based on crystallographic studies (Rayment et al. 1993; Geeves & Holmes, 2005). The small value of s could be due either to a small proportion of the actin-attached motors executing the 11 nm stroke (Knupp et al. 2009; Offer & Ranatunga, 2010) or to all attached motors generating force with a relatively narrow distribution of lever-arm angles biased towards the beginning of the working stroke (Reconditi et al. 2004; Decostre et al. 2005; Huxley et al. 2006; Piazzesi et al. 2007). Energetic considerations based on the high value found for motor stiffness (ε = 2.5–3 pN nm−1) in both single fibre (Decostre et al. 2005; Piazzesi et al. 2007) and single molecule experiments (Kaya & Higuchi, 2010) exclude the first hypothesis. In fact, the mechanical energy implied in the generation of isometric force would be Em = 0.5 ε × d2 = 150–180 zJ (where d is the size of the working stroke). This is about twice the free energy released during the hydrolysis of one ATP molecule (83 zJ; Barclay et al. 2010).
Model 1 has recently been challenged, by taking the downward concavity of the hs strain–force relation at forces <0.4T0 as evidence of the presence of an elastic element with constant stiffness in parallel with the force-generating motors (Colombini et al. 2010; model 2 in Fig. 1). This parallel elasticity was attributed to weakly bound myosin heads, and implied that the calculation of the motor compliance using model 1 introduced a 40% underestimate of s and a corresponding overestimate of Cf.
Thus, a precise estimate of the extent and source of non-linearity of the half-sarcomere elasticity at forces <0.4T0 is essential to establish the stiffness of the myosin motor, a fundamental parameter for defining the mechanism of force generation.
Here, the hs stiffness is measured, starting from 0.05T0 during the rise of an isometric tetanus, using a striation follower (Lombardi & Piazzesi, 1990, and reference therein) to record the length changes at the sarcomere level. Our findings are as follows: (i) during the development of an isometric tetanus, an elastic element with a compliance of ∼200 nm MPa−1 (20 times larger than the compliance of myosin motors at T0) is present in parallel with the myosin motors; and (ii) the average strain of myosin motors generating the isometric force is 1.66 ± 0.05 nm (mean ± SEM).
Methods
Ethical approval
Frogs (Rana esculenta) were killed by decapitation and destruction of the brain and the spinal cord, following European Community Country Directive 86/609/EEC and in conformity with indications of the Institutional Animal Care and Use Committee of the University of Florence. In total, 10 animals were used.
Fibre preparation and mechanical set-up
Single fibres were dissected from the lateral head of the tibialis anterior muscle. Fibres were mounted between the levers of a capacitance force transducer and a loudspeaker motor in a thermoregulated trough, and the half-sarcomere length change (L) in a selected fibre segment 700–1000 μm long was measured by a striation follower (Lombardi & Piazzesi, 1990). Particular care was taken in trimming and clipping the tendons in order to have the fibre ends aligned with the fibre axis to avoid lateral movements of the fibre during the initial phase of force development, which would artifactually increase the compliance of the tendon attachment and generate spurious sarcomere length signals. The positions of the two laser spots illuminating the sarcomeres bounding the segment (SM, at the motor boundary, and ST, at the force transducer boundary) were selected in the half of the fibre close to the force transducer (Fig. 2A). The physiological solution bathing the fibre had the following composition (mm): 115 NaCl, 2.5 KCl, 1.8 CaCl2 and 3 phosphate buffer (pH 7.1). The experiments were performed at a temperature of 4°C on a total of 10 fibres with cross-sectional area 8800 ± 2300 μm2 (mean ± SD) and isometric force 144 ± 17 kPa.
Figure 2.

A, schematic representation of the fibre mounted between the force (T) and length (PM) transducers. The SM and ST boundaries of the segment are selected for measuring the half-sarcomere length changes (L). B, left panel shows responses of force (T/T0, upper trace) and hs length (L, lower trace), respectively, to 4 kHz oscillations (PM, middle trace) imposed during the rise of isometric contraction. Electrical stimulation starts at 0 ms. B, right panel shows responses to oscillations at three different times (a–c, as marked by the vertical lines next to the force trace in the left panel) on an expanded time scale. C, dependence on the isometric force level of the hs length change in response to an oscillation amplitude of ∼0.15% of the fibre length at 2.15 μm sarcomere length (l0).D, dependence on the isometric force level of the phase shift (Δφ) between T and L (filled circles), and between T and PM (open circles). E, dependence on isometric force of Δφ between the signals from the force-transducer spot (ST) and from the motor spot (SM; filled circles), and between SM and PM (open circles).
Experimental protocols
The initial sarcomere length was set to 2.15 μm (fibre length l0). Fibres were electrically stimulated to develop fused tetani at 4 min intervals, using stimuli of alternating polarity with frequency 18–25 Hz. Contraction developed in fixed-end conditions (the position of the motor lever, PM, was used as a feedback signal to control the length of the fibre). The stiffness during force development was measured by applying cycles of 4 kHz length oscillations (10 cycles of ∼2 nm hs−1 peak to peak) repeated at 5 ms intervals. At this oscillation frequency, the response from an isometrically contracting fibre is almost purely elastic, with the exception of the inertial effect observed at very low forces (see ‘Data analysis’ subsection).
The initial force rise in fixed-end conditions (Fig. 2B) is accompanied by sarcomere shortening at a velocity that is maximum (∼1 μm s−1 hs−1) immediately after the start of force rise and then progressively decreases, the total shortening at the tetanus plateau being 22 ± 4 nm hs−1 (seven fibres).
This initial shortening could be prevented in sarcomere length-clamp conditions (the feedback signal is the signal from the striation follower L). However, we found that the probability of collecting high-quality stiffness data throughout the tetanus rise was reduced consistently in length-clamp conditions, because of the occurrence, especially in the early phases of the contraction, of transient deteriorations of L. Even very brief events of this type generated a motor movement artefact via the feedback to the motor amplifier, which led to the deterioration of the rest of the response. In fixed-end conditions, the same transient deterioration of L has no consequences for the remaining part of the contraction, allowing accumulation of better data statistics throughout the tetanus rise. Comparison of fixed-end and sarcomere length-clamp data collected from one fibre (Fig. S1 in Supplemental Material) shows almost no difference in the half-sarcomere compliance–force relation. This can be explained by considering that, for shortening at velocities up to ∼1 μm s−1 hs−1, individual myosin motors maintain a strain similar to that in isometric contraction (Piazzesi et al. 2007). The analysis reported here has been conducted on the stiffness data collected from 10 fibres in fixed-end conditions.
Data analysis
The stiffness of the half-sarcomere was estimated from the force (T) and half-sarcomere length changes (L) in response to the 4 kHz sinusoidal longitudinal oscillations imposed by the motor (length signal PM). At forces ≤0.2T0, T and L signals were not sinusoidal (Fig. 2B, records a). Fourier transform analysis showed the presence of the second harmonic at 8 kHz, ∼10–15% the amplitude of the 4 kHz fundamental. This can be explained by the large decrease of the tendon stiffness at low force, which is much larger than that of the sarcomeres, as shown by the reduction of L at low force (Fig. 2C). The decrease in stiffness is accompanied by an increase in the time of the longitudinal propagation of the mechanical perturbation and a corresponding increase in the phase lag between the PM and T signals (open circles in Fig. 2D). It can be calculated (eqn B1 of Ford et al. 1977, Appendix B) that, when the fibre stiffness is reduced to ∼30% of its T0 value, the resonant frequency of the longitudinal oscillation drops to ∼50% of that at T0 (∼16 kHz), accounting for the rise in the 8 kHz component of the oscillations at the force transducer end of the fibre.
As shown in Fig. 2E, the propagation of the mechanical perturbation along the fibre at low forces shows a large phase shift (Δφ) between PM and SM (open circles), but not between SM and ST (filled circles). These differences in Δφ can be explained by the combination of the following factors: (i) the distribution of the mechanical perturbation along the fibre (Cecchi et al. 1987), which implies the maximal acceleration and thus the maximal inertial effects at the motor end; (ii) the compliance of the tendon at the motor end, which becomes larger at low force (Rack & Westbury, 1984; Ford et al. 1985; Cecchi et al. 1987); and (iii) the short distance SM–ST (≤1 mm). Moreover, the selection of a segment near the force transducer ensures that the acceleration is minimized and thus that the inertial component between L and T signals is practically absent. In fact, Δφ between T and L exhibits a 5–10 deg lead (filled circles in Fig. 2D), as expected from the viscoelastic properties of the active myosin motors (Huxley & Simmons, 1971; Ford et al. 1977).
In any case, the stiffness analysis was made considering only the in-phase component of the L, T and PM signals, to compare the elasticity of the sarcomeres with that measured with the PM signal (fibre length including tendons). The in-phase stiffness was calculated by multiplying the modulus of the complex stiffness by cos(Δφ) [the phase shift between the force and either PM (fibre stiffness, e) or L (hs stiffness, ehs)]. Stiffness data were grouped into force classes of amplitude 0.03T0 and averaged; error bars represent SEM. Compliance is defined as the reciprocal of stiffness. The hs strain (Y) is calculated as the half-sarcomere compliance (Chs) multiplied by force, Y = Chs × T, with the condition that the filament compliance (Cf) is force independent. Strain–force relations were fitted with the linear elasticity model [eqn (1) and model 1 in Fig. 1] only in the range of forces ≥0.4T0. The fits with models that introduced elements that make hs elasticity non-linear were extended to the whole data set.
Results
Sinusoidal oscillations at 4 kHz were imposed on the fibre to measure the stiffness of the fibre and of a selected population of sarcomeres during the rise of isometric contraction.
The relations between stiffness and force (Fig. 3A) show that in both the fibre (stiffness e, open circles, length signal PM) and the sarcomere population (stiffness ehs, filled circles, length signal L) the stiffness decreases from the T0 value less than in proportion to the reduction of T (Cecchi et al. 1982, 1987). This is expected if an element with constant stiffness is in series with the attached myosin motors with constant strain (model 1 in Fig. 1). The relation for the fibre (open circles) lies below and has a larger downward concavity than that of the sarcomeres (filled circles). The differences are due to the contribution of the tendon to fibre stiffness. At high forces (>0.4T0) the tendon compliance is constant and reduces the overall hs stiffness by ∼10% (at T0, ehs is 0.31 ± 0.01T0 nm−1, while e is 0.27 ± 0.01T0 nm−1). The tendon compliance adds to the filament compliance and increases the fractional contribution of the elastic components with constant stiffness in series with the motor array. Consequently, the high-force region of e–T relation is shifted downwards and has a less steep slope than the ehs–T relation. At low forces, the greater increase of the slope of the e–T relation compared with that of ehs–T relation, which was consistently found in all the fibres used as indicated by the small amplitude of the error bars, indicates that the progressive increase of the tendon compliance as force reduces is a genuine property of the tendon.
Figure 3.

A, stiffness–force relations. B, compliance–force relations. C, relation between hs strain (Y) and force, calculated from the hs compliance–force data in B. Dashed lines are the relations predicted by the linear elasticity model (model 1 in Fig. 1) as explained in the text. Data are means ± SEM, n = 10 fibres. D, same data as in B fitted with non-linear model 2 (continuous line).
The contribution of the myosin motors and myofilaments to the hs compliance Chs (=1/ehs) can be expressed in terms of equivalent series compliances (Ford et al. 1977). In the same way, the tendon compliance (CT) adds to Chs to give the fibre compliance C (=1/e). Thus:
| (2) |
and
| (3) |
with Ccb, the compliance of the array of myosin motors, =s/T. As shown in Fig. 3B, both the C–T (open circles) and Chs–T (filled circles) relations show a hyperbolic-like dependence on force. The C–T data points lie above the Chs–T data points, as expected from the contribution of CT to C, and the difference becomes progressively larger at forces below 0.25T0, where CT increases progressively with the reduction of T.
Under the assumption, defined by model 1 in Fig. 1 (Bagni et al. 2005; Brunello et al. 2006; Fusi et al. 2010), that during the rise of isometric contraction the force (and the strain s) per myosin motor is constant and the hs strain (Y) increases with force in proportion to the increase in the strain of the myofilaments with constant compliance, Y at any force T can be calculated from Chs as Y = Chs × T (Fig. 3C). For forces >0.4T0, the Y–T relation is linear, while it exhibits a downward concavity at lower forces.
In agreement with previous work (Brunello et al. 2006; Fusi et al. 2010), for forces larger than 0.4T0 the Y–T relation can be explained in terms of model 1 in Fig. 1, where: (i) the compliance of the motor array decreases with the rise of force, because the force is proportional to the number of motors, and s is estimated by the ordinate intercept of the Y–T relation; and (ii) the slope of the Y–T relation estimates Cf. Fitting eqn (1) to the linear part of the hs strain–force relation (T ≥ 0.4T0; dashed line in Fig. 3C) gives Cf = 1.77 ± 0.04 nm/T0 and s = 1.56 ± 0.03 nm (Table 1), similar to previously reported values (Brunello et al. 2006; Piazzesi et al. 2007; Fusi et al. 2010).
Table 1.
Estimates of the mechanical parameters of the half-sarcomere with models 1 and 2
| Model | s (nm) | Cf (nm/T0) | CP (nm/T0) |
|---|---|---|---|
| Model 1 | 1.56 ± 0.03 | 1.77 ± 0.04 | — |
| Model 2 | 1.66 ± 0.05 | 1.84 ± 0.08 | 28.9 ± 1.0 |
Abbreviations: Cf, filament compliance; CP, compliance of the elastic element in parallel with force-generating motors; s, strain in the array of myosin motors; and T0, plateau force reached during an isometric tetanus.
The dashed lines in Fig. 3A and B, calculated with the parameters estimated from the fit in Fig. 3C, show how ehs–T and Chs–T relations would appear in model 1. The deviation of the experimental data (filled circles) from the model becomes evident at low forces, where the progressive reduction of the stiffness of the motor array reveals the presence of an element in parallel with attached myosin motors (model 2 in Fig. 1) responsible for the non-linearity in the hs elasticity. Moreover, Fig. 3B shows how the presence of a non-linear tendon compliance affects the observed C–T relation (open circles); the points at low forces are shifted upwards even with respect to the points predicted by a linear model (dashed line). This clearly demonstrates that the PM cannot be used to identify and quantify the contribution of the parallel element in the low force region, i.e. the region in which the reduced stiffness of the motor array would allow the non-linear elasticity of the hs to be characterized best.
The ehs–T and Chs–T relations shown in Fig. 3A and B, respectively, do not provide direct evidence, in contrast with the Y–T relation (Fig. 3C), for discriminating between the region of forces (>0.4T0) where the half-sarcomere exhibits a linear elasticity and the region (<0.4T0) where the contribution of an element in parallel to the motor array becomes evident (Colombini et al. 2010). According to model 2 in Fig. 1, the whole range of Chs–T data in Fig. 3B (reported for clarity in Fig. 3D) can be fitted with the following equation:
| (4) |
where CP is the constant compliance of the parallel element.
The results of the fit, shown in Fig. 3D (line) and in Table 1, indicate that the value of CP, 28.9 ± 1.0 nm/T0, is almost 20 times larger than the compliance of the motor array at T0, Ccb, 1.66 ± 0.05 nm/T0 (which corresponds to s when force is measured in units of T0). Moreover Cf, 1.84 ± 0.07 nm/T0, contributes slightly more than 50% of the total hs compliance. This analysis shows that: (i) the non-linear behaviour of the half-sarcomere elasticity during the rise in force can be explained by an element in parallel with myosin motors with a constant stiffness that is only 1/20th of that of the motors at T0; and (ii) the estimates of the compliances of the myofilaments and myosin motors during contraction are similar to those calculated on the basis of model 1 (Table 1).
Discussion
Mechanical characterization of the element responsible for the non-linearity of the hs elasticity
In this work, we precisely define the deviation of the hs elasticity from a linear mechanical model. The non-linear behaviour consists of a downward shift of the hs strain–force relation at forces <0.4T0, which indicates that the hs compliance increases with the reduction of force by an amount that is less than that expected from the reduction of the number of myosin motors (Fig. 3B). This non-linearity can be characterized most accurately by extending the stiffness measurements to forces as low as 0.05T0 and eliminating inertial effects present at such low forces by selecting a short fibre segment near the force transducer end.
In this way, the present data provide the most stringent constraints to define the elastic element in parallel with myosin motors quantitatively. We find that its compliance, CP, 28.9 ± 1.0 nm/T0, is ∼20 times larger than that of the array of motors at T0 (Table 1). This, in turn, explains why the parallel element makes a significant contribution to the Chs–T relation only at forces <0.4T0, where Ccb becomes comparable to CP. For comparison with previous measurements on different muscles and amphibian species (which may develop different isometric forces), the values of these parameters must be expressed in SI units. The value of T0 in the fibres used here was 144 ± 17 kPa, so CP in SI units is 200 ± 7 nm MPa−1 and Ccb is 11.53 ± 0.35 nm MPa−1. Likewise, the filament compliance is 12.8 ± 0.5 nm MPa−1 in SI units, in good agreement with the estimates obtained in previous mechanical and X-ray diffraction experiments (Brunello et al. 2006; Piazzesi et al. 2007; Fusi et al. 2010). The fractional contribution of Cf to Chs (∼50%) in the present experiments on fibres of Rana esculenta is smaller than that in those of Rana temporaria (Piazzesi et al. 2007), even if Cf in SI units is the same. This is explained by considering that larger isometric force per unit cross-sectional area in Rana temporaria (∼240 kPa) is accounted for by a correspondingly larger number of force-generating motors (Park-Holohan et al. 2012).
The conclusion in this work that CP is ∼20 times larger than that of the motor array at T0 is in contrast with the finding by Cecchi and coworkers (Colombini et al. 2010), that the parallel elastic component has a compliance only ∼7 times larger than that of the motor array. As a consequence, their estimates of the contributions to Chs of myofilaments (37%) and myosin motors (63%) are significantly smaller and larger respectively than those reported here. These discrepancies are likely due to having limited the analysis to forces >0.2 T0, as discussed in the first section of Results (see Fig. 2).
Our results clearly show that the parallel elasticity does not significantly influence the estimate of the myosin motor stiffness at forces >0.4 T0, but do not allow the identification of the nature of the parallel elasticity. An elastic element in parallel with the myosin motors with a comparable stiffness has been found in previous work by Cecchi and coworkers (Bagni et al. 2002). This elasticity, defined as ‘static stiffness’, rises abruptly upon activation of a muscle fibre, is independent of motor attachment and increases with sarcomere length up to 2.8 μm. It was therefore attributed to the filamentous protein titin (Maruyama et al. 1977; Wang et al. 1979; Furst et al. 1988).
However, a parallel elastic element with constant stiffness can equally well be explained by the presence of a constant fraction of weakly bound myosin heads (Colombini et al. 2010). Assuming that a weakly bound head and a force-generating motor exhibit the same stiffness, the fractional number f necessary to explain the non-linear contribution to the hs elasticity can be calculated as f0 × Ccb/CP, where f0 is the fraction of heads attached in isometric contraction. With f0 = 0.2–0.3 (Decostre et al. 2005; Piazzesi et al. 2007), f would be only 1.1–1.7% of all the heads. It is worth noting that such a low fraction of weakly bound heads would not contradict the recent finding by X-ray diffraction (Reconditi et al. 2011) that during the rise of isometric force all the myosin heads with a resting-like conformation (Woodhead et al. 2005) are substituted by myosin heads with an active conformation (either detached or attached). In fact, the presence of 1–2% of heads weakly bound to actin would not influence X-ray data interpretation.
The weakly bound cross-bridges responsible for the parallel elasticity could be present only during the early phases of the isometric force development. This would be the case if actin–myosin bonds take a significant time to develop the force during activation, but not later when the mechanical model reduces to a linear one with the force proportional to the number of the attached motors. A transient parallel elasticity could be generated also by the presence, at the start of activation, of links between the myosin and actin filaments such as those attributed to myosin-binding protein C (Offer, 1972; Moos, 1981; Yamamoto, 1986; Squire et al. 2004; Luther et al. 2011; Reconditi et al. 2013), which are likely to be broken by force generation. Binding of the N-terminus of myosin light chain 1 to actin (Trayer et al. 1987; Timson et al. 1998) could also be responsible for a transient parallel elasticity if it were to establish shortly and transiently after myosin heads have lost their resting-like conformation (Woodhead et al. 2005). Nevertheless, the possibility that the parallel elasticity is transient cannot be tested definitively using the present data. Models in which CP is a function of either time or force did not give a unique fit to data, because there were too many free parameters.
The stiffness of the myosin motor and the model of force generation
New evidence is given in this work that during isometric contraction myosin motors have a linear elasticity and that their average strain is ∼1.7 nm. This appears contradictory to the finding that in vitro the stiffness of the myosin motor was much smaller at forces near or below zero, because the S2 fragment buckled (Kaya & Higuchi, 2010). This condition, however, cannot be extended to the in situ function of the motor. In this respect, it is worth noting that, using length steps superimposed on the isometric contraction of intact fibres, the half-sarcomere elasticity has been found to be almost linear across zero force (Ford et al. 1977).
An average strain of the force-generating motor of ∼1.7 nm is less than one-fifth of the 11 nm working stroke suggested by crystallographic models (Rayment et al. 1993; Geeves & Holmes, 2005) and, according to the high motor stiffness (Decostre et al. 2005; Piazzesi et al. 2007), is explained with a limited motor movement, in agreement with the conclusions of X-ray diffraction experiments (Reconditi et al. 2004; Huxley et al. 2006) that the isometric force is generated by motors with a relatively narrow distribution of conformations biased towards the beginning of the working stroke. A structural model of the working stroke in which actin-attached myosin motors are distributed in multiple substates with different degrees of lever arm angles is shown in Fig. 4. Five states are assumed (M1–M5), separated by a 2.75 nm step, in agreement with the kinetic model described by Linari et al. (2009). In isometric contraction, only the states M1, M2 and M3 are populated, with M1 and M2 states sharing the larger fractional occupancy (∼0.46), in agreement with an average strain of 1.7 nm. A similar structural model has recently been put forth to explain the dipole moment orientation of fluorescent probes attached to the light chains (Burghardt et al. 2011). The conclusion of Burghardt et al. (2011) that the isometric distribution of states is biased toward the end of the working stroke may well be explained by the heavy manipulation to which skinned fibres are subjected in fluorescence experiments. On the other hand, taking into account a motor stiffness of ∼3 pN nm−1, a large distribution of the lever arm angles in isometric contraction is excluded on the basis of the energetic argument.
Figure 4.

Upper panel shows five different states (M1–M5) of the myosin motor characterized by orientations of the lever arm separated by angles corresponding to an axial displacement of 2.75 nm of the tip of the lever, under zero force. Lower panel shows fractional occupancy of the different states in isometric contraction according to Linari et al. (2009).
Assuming that the termination of the ATPase cycle occurs after the lever arm has gone through the 11 nm working stroke, the relatively small lever arm tilt associated with force generation seems not to be consistent with the relatively high rate of ATP splitting in isometric contraction. However, chemical and mechanical steps do not appear so tightly coupled following the evidence that orthophosphate (Pi) can be released from the catalytic site of the myosin motor also at an early stage of the working stroke, following an ‘unconventional’ detachment of the force-generating motors in isometric contraction (Linari et al. 2010). More recently, the transient and steady-state responses to stepwise drops of force imposed on activated skinned fibres have provided further support to the view of a loose coupling between chemical and mechanical steps, showing that the release of hydrolysis products (Pi and ADP) can occur at any stage of the myosin working stroke (Caremani et al. 2013). In the light of this, the working stroke is no longer the all-or-none 11 nm transition, deducted from protein crystallography (Geeves & Holmes, 2005) and earlier spectroscopic studies (Baker et al. 1998), but a multistate transition of load-dependent amplitude, unrelated to the biochemical state of the motor.
Key points
The force in the half-sarcomere (hs), the functional unit of muscle, is due to the contributions of individual myosin motors arranged in parallel in the half-myosin filament and pulling on the opposing actin filament.
According to a linear hs model, during an isometric contraction the force rises to its maximal steady value (T0) in proportion to the number of actin-attached motors, while the hs strain rises with a slope that depends on the compliance of the myofilaments.
We measured the hs stiffness, superimposing small 4 kHz length oscillations on the development of isometric contraction, and found an elastic element in parallel to the myosin motors with a constant stiffness ∼1/20th that of the motor array at T0.
The results support a structural model in which myosin motors are distributed in multiple substates, of which only the first ones are occupied during isometric force generation, causing a motor strain of ∼1.7 nm.
Acknowledgments
We thank M. Irving for critical reading of the manuscript and M. Dolfi for electronic support.
Glossary
- C
fibre compliance
- Ccb
compliance of the array of myosin motors
- Cf
filament compliance
- Chs
half-sarcomere compliance
- CP
compliance of the elastic element in parallel with force-generating motors
- CT
tendon compliance
- e
fibre stiffness
- ehs
half-sarcomere stiffness
- f
fraction of weakly bound heads
- f0
fraction of motors in isometric contraction
- hs
half-sarcomere
- L
half-sarcomere length change
- l0
fibre length at 2.15 μm sarcomere length
- PM
position of the loudspeaker-motor lever
- s
strain in the array of myosin motors
- SM
position of the laser spot at the motor boundary
- ST
position of the laser spot at the force transducer boundary
- T
force
- T0
plateau force reached during an isometric tetanus
- Y
half-sarcomere strain
Additional Information
Competing interests
None declared.
Author contributions
L.F., E.B., M.R., G.P. and V.L. contributed to the conception and design of the experiments, the collection, analysis and interpretation of data, and drafting the article or revising it for important intellectual content. All authors approved the final version of the manuscript, all persons designated as authors qualify for authorship, and all those who qualify for authorship are listed.
Funding
We are grateful to Ente Cassa di Risparmio di Firenze, FIRB-Futuro in Ricerca project RBFR08JAMZ and MIUR-PRIN project 2010R8JK2X (Italy) for financial support.
Author's present address
L. Fusi: Randall Division of Cell and Molecular Biophysics, King's College London, London SE1 1UL, UK.
References
- Bagni MA, Cecchi G, Colombini B. Crossbridge properties investigated by fast ramp stretching of activated frog muscle fibres. J Physiol. 2005;565:261–268. doi: 10.1113/jphysiol.2005.085209. [DOI] [PMC free article] [PubMed] [Google Scholar]
- Bagni MA, Cecchi G, Colombini B, Colomo F. A non-cross-bridge stiffness in activated frog muscle fibers. Biophys J. 2002;82:3118–3127. doi: 10.1016/S0006-3495(02)75653-1. [DOI] [PMC free article] [PubMed] [Google Scholar]
- Baker JE, Brust-Mascher I, Ramachandran S, LaConte LE, Thomas DD. A large and distinct rotation of the myosin light chain domain occurs upon muscle contraction. Proc Natl Acad Sci U S A. 1998;95:2944–2949. doi: 10.1073/pnas.95.6.2944. [DOI] [PMC free article] [PubMed] [Google Scholar]
- Barclay CJ, Woledge RC, Curtin NA. Inferring crossbridge properties from skeletal muscle energetics. Prog Biophys Mol Biol. 2010;102:53–71. doi: 10.1016/j.pbiomolbio.2009.10.003. [DOI] [PubMed] [Google Scholar]
- Brunello E, Bianco P, Piazzesi G, Linari M, Reconditi M, Panine P, Narayanan T, Helsby WI, Irving M, Lombardi V. Structural changes in the myosin filament and cross-bridges during active force development in single intact frog muscle fibres: stiffness and X-ray diffraction measurements. J Physiol. 2006;577:971–984. doi: 10.1113/jphysiol.2006.115394. [DOI] [PMC free article] [PubMed] [Google Scholar]
- Burghardt TP, Josephson MP, Ajtai K. Single myosin cross-bridge orientation in cardiac papillary muscle detects lever-arm shear strain in transduction. Biochemistry. 2011;50:7809–7821. doi: 10.1021/bi2008992. [DOI] [PMC free article] [PubMed] [Google Scholar]
- Caremani M, Melli L, Dolfi M, Lombardi V, Linari M. The working stroke of the myosin II motor in muscle is not tightly coupled to release of orthophosphate from its active site. J Physiol. 2013;591:5187–5205. doi: 10.1113/jphysiol.2013.257410. [DOI] [PMC free article] [PubMed] [Google Scholar]
- Cecchi G, Colomo F, Lombardi V, Piazzesi G. Stiffness of frog muscle fibres during rise of tension and relaxation in fixed-end or length-clamped tetani. Pflugers Arch. 1987;409:39–46. doi: 10.1007/BF00584747. [DOI] [PubMed] [Google Scholar]
- Cecchi G, Griffiths PJ, Taylor S. Muscular contraction: kinetics of crossbridge attachment studied by high-frequency stiffness measurements. Science. 1982;217:70–72. doi: 10.1126/science.6979780. [DOI] [PubMed] [Google Scholar]
- Colombini B, Nocella M, Bagni MA, Griffiths PJ, Cecchi G. Is the cross-bridge stiffness proportional to tension during muscle fiber activation. Biophys J. 2010;98:2582–2590. doi: 10.1016/j.bpj.2010.02.014. [DOI] [PMC free article] [PubMed] [Google Scholar]
- Decostre V, Bianco P, Lombardi V, Piazzesi G. Effect of temperature on the working stroke of muscle myosin. Proc Natl Acad Sci U S A. 2005;102:13927–13932. doi: 10.1073/pnas.0506795102. [DOI] [PMC free article] [PubMed] [Google Scholar]
- Ford LE, Huxley AF, Simmons RM. Tension responses to sudden length change in stimulated frog muscle fibres near slack length. J Physiol. 1977;269:441–515. doi: 10.1113/jphysiol.1977.sp011911. [DOI] [PMC free article] [PubMed] [Google Scholar]
- Ford LE, Huxley AF, Simmons RM. The relation between stiffness and filament overlap in stimulated frog muscle fibres. J Physiol. 1981;311:219–249. doi: 10.1113/jphysiol.1981.sp013582. [DOI] [PMC free article] [PubMed] [Google Scholar]
- Ford LE, Huxley AF, Simmons RM. Tension transients during steady shortening of frog muscle fibres. J Physiol. 1985;361:131–150. doi: 10.1113/jphysiol.1985.sp015637. [DOI] [PMC free article] [PubMed] [Google Scholar]
- Furst DO, Osborn M, Nave R, Weber K. The organization of titin filaments in the half-sarcomere revealed by monoclonal antibodies in immunoelectron microscopy: a map of ten nonrepetitive epitopes starting at the Z line extends close to the M line. J Cell Biol. 1988;106:1563–1572. doi: 10.1083/jcb.106.5.1563. [DOI] [PMC free article] [PubMed] [Google Scholar]
- Fusi L, Reconditi M, Linari M, Brunello E, Elangovan R, Lombardi V, Piazzesi G. The mechanism of the resistance to stretch of isometrically contracting single muscle fibres. J Physiol. 2010;588:495–510. doi: 10.1113/jphysiol.2009.178137. [DOI] [PMC free article] [PubMed] [Google Scholar]
- Geeves MA, Holmes KC. The molecular mechanism of muscle contraction. Adv Protein Chem. 2005;71:161–193. doi: 10.1016/S0065-3233(04)71005-0. [DOI] [PubMed] [Google Scholar]
- Huxley AF, Simmons RM. Proposed mechanism of force generation in striated muscle. Nature. 1971;233:533–538. doi: 10.1038/233533a0. [DOI] [PubMed] [Google Scholar]
- Huxley H, Reconditi M, Stewart A, Irving T. X-ray interference studies of crossbridge action in muscle contraction: evidence from quick releases. J Mol Biol. 2006;363:743–761. doi: 10.1016/j.jmb.2006.08.075. [DOI] [PubMed] [Google Scholar]
- Huxley HE, Stewart A, Sosa H, Irving T. X-ray diffraction measurements of the extensibility of actin and myosin filaments in contracting muscle. Biophys J. 1994;67:2411–2421. doi: 10.1016/S0006-3495(94)80728-3. [DOI] [PMC free article] [PubMed] [Google Scholar]
- Kaya M, Higuchi H. Nonlinear elasticity and an 8-nm working stroke of single myosin molecules in myofilaments. Science. 2010;329:686–689. doi: 10.1126/science.1191484. [DOI] [PubMed] [Google Scholar]
- Knupp C, Offer G, Ranatunga KW, Squire JM. Probing muscle myosin motor action: X-ray (M3 and M6) interference measurements report motor domain not lever arm movement. J Mol Biol. 2009;390:168–181. doi: 10.1016/j.jmb.2009.04.047. [DOI] [PubMed] [Google Scholar]
- Linari M, Caremani M, Lombardi V. A kinetic model that explains the effect of inorganic phosphate on the mechanics and energetics of isometric contraction of fast skeletal muscle. Proc Biol Sci. 2010;277:19–27. doi: 10.1098/rspb.2009.1498. [DOI] [PMC free article] [PubMed] [Google Scholar]
- Linari M, Dobbie I, Reconditi M, Koubassova N, Irving M, Piazzesi G, Lombardi V. The stiffness of skeletal muscle in isometric contraction and rigor: the fraction of myosin heads bound to actin. Biophys J. 1998;74:2459–2473. doi: 10.1016/S0006-3495(98)77954-8. [DOI] [PMC free article] [PubMed] [Google Scholar]
- Linari M, Piazzesi G, Lombardi V. The effect of myofilament compliance on kinetics of force generation by myosin motors in muscle. Biophys J. 2009;96:583–592. doi: 10.1016/j.bpj.2008.09.026. [DOI] [PMC free article] [PubMed] [Google Scholar]
- Lombardi V, Piazzesi G. The contractile response during steady lengthening of stimulated frog muscle fibres. J Physiol. 1990;431:141–171. doi: 10.1113/jphysiol.1990.sp018324. [DOI] [PMC free article] [PubMed] [Google Scholar]
- Luther PK, Winkler H, Taylor K, Zoghbi ME, Craig R, Padron R, Squire JM, Liu J. Direct visualization of myosin-binding protein C bridging myosin and actin filaments in intact muscle. Proc Natl Acad Sci U S A. 2011;108:11423–11428. doi: 10.1073/pnas.1103216108. [DOI] [PMC free article] [PubMed] [Google Scholar]
- Maruyama K, Matsubara S, Natori R, Nonomura Y, Kimura S. Connectin, an elastic protein of muscle. Characterization and function. J Biochem. 1977;82:317–337. [PubMed] [Google Scholar]
- Moos C. Fluorescence microscope study of the binding of added C protein to skeletal muscle myofibrils. J Cell Biol. 1981;90:25–31. doi: 10.1083/jcb.90.1.25. [DOI] [PMC free article] [PubMed] [Google Scholar]
- Offer G. C-Protein and the periodicity in the thick filaments of vertebrate skeletal muscle. Cold Spring Harb Symp Quant Biol. 1972;37:87–93. [Google Scholar]
- Offer G, Ranatunga KW. Crossbridge and filament compliance in muscle: implications for tension generation and lever arm swing. J Muscle Res Cell Motil. 2010;31:245–265. doi: 10.1007/s10974-010-9232-7. [DOI] [PubMed] [Google Scholar]
- Park-Holohan S, Linari M, Reconditi M, Fusi L, Brunello E, Irving M, Dolfi M, Lombardi V, West TG, Curtin NA, Woledge RC, Piazzesi G. Mechanics of myosin function in white muscle fibres of the dogfish, Scyliorhinus canicula. J Physiol. 2012;590:1973–1988. doi: 10.1113/jphysiol.2011.217133. [DOI] [PMC free article] [PubMed] [Google Scholar]
- Piazzesi G, Reconditi M, Linari M, Lucii L, Bianco P, Brunello E, Decostre V, Stewart A, Gore DB, Irving TC, Irving M, Lombardi V. Skeletal muscle performance determined by modulation of number of myosin motors rather than motor force or stroke size. Cell. 2007;131:784–795. doi: 10.1016/j.cell.2007.09.045. [DOI] [PubMed] [Google Scholar]
- Rack PM, Westbury DR. Elastic properties of the cat soleus tendon and their functional importance. J Physiol. 1984;347:479–495. doi: 10.1113/jphysiol.1984.sp015077. [DOI] [PMC free article] [PubMed] [Google Scholar]
- Rayment I, Holden HM, Whittaker M, Yohn CB, Lorenz M, Holmes KC, Milligan RA. Structure of the actin-myosin complex and its implications for muscle contraction. Science. 1993;261:58–65. doi: 10.1126/science.8316858. [DOI] [PubMed] [Google Scholar]
- Reconditi M, Brunello E, Fusi L, Linari M, Fernandez Martinez M, Lombardi V, Irving M, Piazzesi G. Sarcomere-length dependence of myosin filament structure in skeletal muscle fibres of the frog. J Physiol. 2013;592:1133–1151. doi: 10.1113/jphysiol.2013.267849. [DOI] [PMC free article] [PubMed] [Google Scholar]
- Reconditi M, Brunello E, Linari M, Bianco P, Narayanan T, Panine P, Piazzesi G, Lombardi V, Irving M. Motion of myosin head domains during activation and force development in skeletal muscle. Proc Natl Acad Sci U S A. 2011;108:7236–7240. doi: 10.1073/pnas.1018330108. [DOI] [PMC free article] [PubMed] [Google Scholar]
- Reconditi M, Linari M, Lucii L, Stewart A, Sun YB, Boesecke P, Narayanan T, Fischetti RF, Irving T, Piazzesi G, Irving M, Lombardi V. The myosin motor in muscle generates a smaller and slower working stroke at higher load. Nature. 2004;428:578–581. doi: 10.1038/nature02380. [DOI] [PubMed] [Google Scholar]
- Squire JM, Roessle M, Knupp C. New X-ray diffraction observations on vertebrate muscle: organisation of C-protein (MyBP-C) and troponin and evidence for unknown structures in the vertebrate A-band. J Mol Biol. 2004;343:1345–1363. doi: 10.1016/j.jmb.2004.08.084. [DOI] [PubMed] [Google Scholar]
- Timson DJ, Trayer HR, Trayer IP. The N-terminus of A1-type myosin essential light chains binds actin and modulates myosin motor function. Eur J Biochem. 1998;255:654–662. doi: 10.1046/j.1432-1327.1998.2550654.x. [DOI] [PubMed] [Google Scholar]
- Trayer IP, Trayer HR, Levine BA. Evidence that the N-terminal region of A1-light chain of myosin interacts directly with the C-terminal region of actin. A proton magnetic resonance study. Eur J Biochem. 1987;164:259–266. doi: 10.1111/j.1432-1033.1987.tb11019.x. [DOI] [PubMed] [Google Scholar]
- Wakabayashi K, Sugimoto Y, Tanaka H, Ueno Y, Takezawa Y, Amemiya Y. X-ray diffraction evidence for the extensibility of actin and myosin filaments during muscle contraction. Biophys J. 1994;67:2422–2435. doi: 10.1016/S0006-3495(94)80729-5. [DOI] [PMC free article] [PubMed] [Google Scholar]
- Wang K, McClure J, Tu A. Titin: major myofibrillar components of striated muscle. Proc Natl Acad Sci U S A. 1979;76:3698–3702. doi: 10.1073/pnas.76.8.3698. [DOI] [PMC free article] [PubMed] [Google Scholar]
- Woodhead JL, Zhao FQ, Craig R, Egelman EH, Alamo L, Padron R. Atomic model of a myosin filament in the relaxed state. Nature. 2005;436:1195–1199. doi: 10.1038/nature03920. [DOI] [PubMed] [Google Scholar]
- Yamamoto K. The binding of skeletal muscle C-protein to regulated actin. FEBS Lett. 1986;208:123–127. doi: 10.1016/0014-5793(86)81545-9. [DOI] [PubMed] [Google Scholar]
Associated Data
This section collects any data citations, data availability statements, or supplementary materials included in this article.