

Abstract
A network of kinases, including WNKs, SPAK and Sgk1, is critical for the independent regulation of K+ and Na+ transport in the distal nephron. Angiotensin II is thought to act as a key hormone in orchestrating these kinases to switch from K+ secretion during hyperkalaemia to Na+ reabsorption during intravascular volume depletion, thus keeping disturbances in electrolyte and blood pressure homeostasis at a minimum. It remains unclear, however, how K+ and Na+ transport are regulated during a high Na+ intake, which is associated with suppressed angiotensin II levels and a high distal tubular Na+ load. We therefore investigated the integrated blood pressure, renal, hormonal and gene and protein expression responses to large changes of K+ intake in Na+ replete mice. Both low and high K+ intake increased blood pressure and caused Na+ retention. Low K+ intake was accompanied by an upregulation of the sodium-chloride cotransporter (NCC) and its activating kinase SPAK, and inhibition of NCC normalized blood pressure. Renal responses were unaffected by angiotensin AT1 receptor antagonism, indicating that low K+ intake activates the distal nephron by an angiotensin-independent mode of action. High K+ intake was associated with elevated plasma aldosterone concentrations and an upregulation of the epithelial sodium channel (ENaC) and its activating kinase Sgk1. Surprisingly, high K+ intake increased blood pressure even during ENaC or mineralocorticoid receptor antagonism, suggesting the contribution of aldosterone-independent mechanisms. These findings show that in a Na+ replete state, changes in K+ intake induce specific molecular and functional adaptations in the distal nephron that cause a functional coupling of renal K+ and Na+ handling, resulting in Na+ retention and high blood pressure when K+ intake is either restricted or excessively increased.
Introduction
The kidney, in particular the aldosterone-sensitive distal nephron (ASDN), plays a key role in the regulation of body potassium (K+) and sodium (Na+) homeostasis. Precise regulation of the K+ balance is vital as the plasma K+ concentration strongly influences cellular electrical excitability, and both hypokalaemia and hyperkalaemia can induce life-threatening cardiac arrhythmias. The Na+ balance of the body is critical for the maintenance of extracellular fluid (ECF) volume and a normal mean arterial blood pressure (MAP) (Lifton, 1996). Both K+ and Na+ balances are regulated by the adrenal hormone aldosterone. In the ASDN, aldosterone increases Na+ uptake through the epithelial sodium channel (ENaC), a mechanism known as electrogenic Na+ reabsorption. This amplifies the transepithelial lumen-negative potential and thus stimulates K+ secretion (Castaneda-Bueno et al. 2012a). Corresponding to its renal actions, aldosterone release from the adrenal glands is strongly stimulated by Na+ depletion, as well as by hyperkalaemia (Spat & Hunyady, 2004). Renal responses to elevated plasma concentrations of aldosterone, however, differ profoundly depending on the mode of activation. Whereas aldosterone increases Na+ reabsorption without stimulating K+ secretion during intravascular volume depletion, K+ secretion is increased without an altered Na+ reabsorption during hyperkalaemia. The mechanisms underlying this so-called aldosterone paradox (Arroyo et al. 2011; Hoorn et al. 2011) remained elusive until the discovery of the WNK (with-no-lysine kinase) and SPAK (STE20/SPS1-related proline/alanine rich kinase) kinases. Now it is generally thought that during Na+ depletion, a high circulating concentration of angiotensin II acts as the key upstream signal to activate the WNK4–SPAK pathway (San-Cristobal et al. 2009; Welling et al. 2010), which, in turn, stimulates the sodium-chloride cotransporter (NCC) in the distal convoluted tubule (DCT), thus favouring electroneutral Na+ reabsorption. Electrogenic Na+ reabsorption is further suppressed as a result of the low tubular Na+ load during Na+ depletion, thus preventing any significant stimulation of K+ secretion in the distal nephron. By contrast, during hyperkalaemia, in which aldosterone is elevated in the absence of increased levels of circulating angiotensin II, activation of the kidney-specific WNK1 (KS-WNK1) (Naray-Fejes-Toth et al. 2004) and serum and glucocorticoid-induced kinase 1 (Sgk1) (Loffing et al. 2001) specifically facilitates K+ secretion by enhancing transport through ENaC and renal outer medullary potassium channels (ROMK) and concurrently inhibiting the NCC (van der Lubbe et al. 2013).
This explanation of the aldosterone paradox, however, cannot fully explain how K+ and Na+ homeostasis can be independently regulated when Na+ intake is high, as is typically the case in Western diets. Under these circumstances, an activation of electrogenic Na+ reabsorption by a high K+ intake would coincide with a high Na+ load to the ASDN, thus predicting that a high rate of renal K+ excretion is accompanied by an increased reabsorption of Na+ and consequently an elevated MAP. Equally, an activation of electroneutral Na+ reabsorption to minimize renal losses of K+ during dietary K+ restriction would also predict Na+ retention and hence increases in MAP.
To address these questions, we investigated the effects of different levels of K+ intake on MAP, the renin–angiotensin–aldosterone system, and renal electrolyte handling in Na+ replete mice. Furthermore, we analysed gene and protein expression patterns in the kidney, as well as in microdissected nephron segments, in response to the various K+ diets. Finally, to identify the functional relevance of specific transport pathways and potential upstream signals, we examined the MAP and renal responses to specific antagonists of the angiotensin AT1 receptor (AT1R) and mineralocorticoid receptor (MR), as well as the NCC and ENaC.
Methods
Ethical approval and experimental animals
All animal protocols were approved by the local authority (Ministry for Social Affairs, Family, Health and Consumer Protection, Hamburg, Germany; approval nos. 32/09 and 23/10) and conformed to Directive 2010/63/EU of the European Parliament. Experiments were conducted in male C57bl6 mice (Charles River Laboratories, Cologne, Germany). Surgery was performed under deep anaesthesia with ketamine (120 mg kg−1) and xylazine (16 mg kg−1). Adequate deepness of anaesthesia was assured by repeated toe pinching. During all procedures body temperature was kept at 37 ± 0.5°C. For pain prophylaxis, carprofen (8.25 mg kg−1) was injected subcutaneously before surgery, and metamizol (8 mg/day) was added to drinking water for the first 2 days after surgery. Blood withdrawal was performed under deep isoflurane anaesthesia (3–4%). At the end of the experiments, the mice were killed by cervical dislocation.
Animal studies
The control diet contained 0.93% K+ and 0.24% Na+. The three experimental diets contained 3% NaCl in combination with either 0.03%, 0.93% or 5% K+ (tri-potassium citrate) (Sniff GmbH, Soest, Germany). All diets were fed over the entire experimental period of 10 days. Losartan (MSD Sharp & Dohme GmbH, Haar, Germany), hydrochlorothiazide (HCTZ; Sigma-Aldrich Corp., St Louis, MO, USA) and amiloride (Sigma-Aldrich Corp.) were given with the drinking water. The concentration of the drug in the drinking water was adjusted from day to day to the drinking volume of each mouse. In the blood pressure studies, the mean ± s.e.m. daily doses administered were: losartan: 35 ± 3 mg kg−1 (range: 24–45 mg kg−1) in the low K+ group, 31 ± 2 mg kg−1 (range: 24–43 mg kg−1) in the normal K+ group, and 30 ± 2 mg kg−1 (range: 23–42 mg kg−1) in the high K+ group; HCTZ: 15 ± 2 mg kg−1 (range: 11–23 mg kg−1) in the low K+ group, 12 ± 1 mg kg−1 (range: 11–13 mg kg−1) in the normal K+ group, and 15 ± 1 mg kg−1 (range: 13–19 mg kg−1) in the high K+ group, and amiloride: 4.8 ± 0.4 mg kg−1 (range: 2.8–6.7 mg kg−1) in the high K+ group. In the metabolic cage studies, the daily mean ± s.e.m. doses administered were: 45 ± 2 mg kg−1 (range: 23–56 mg kg−1) of losartan in the low K+ group and 14 ± 1 mg kg−1 (range: 8–22 mg kg−1) of HCTZ in the low K+ group. Spironolactone was administered subcutaneously at a daily dose of 175 mg kg−1 (range: 166–198 mg kg−1) via time release pellets (Innovative Research of America, Sarasota, FL, USA) in all K+ groups. In a second set of experiments, spironolactone was given at a daily dose of 665 mg kg−1 (range: 651–688 mg kg−1) in the high K+ group. In all experiments, drug administration started 1 day prior to the switch to the experimental diet. Mice had free access to tap water and were synchronized to a 12 : 12 h light : dark cycle in which lights were switched off at 19.00 hours.
Blood pressure telemetry
Blood pressure was determined using DSI TA11PA-C10 implantable telemetric transmitters (Data Sciences International, New Brighton, MN, USA). Data were sampled with DSI Dataquest ART Acquisition (Version 4.0; Data Sciences International). Recorded parameters were activity, heart rate (HR), systolic arterial blood pressure (SAP), diastolic arterial blood pressure (DAP) and MAP. Data reduction was performed by calculating the moving average per hour with DSI Dataquest ART Analysis (Version 4.0; Data Sciences International). The mean of MAP during the night was calculated as the mean of MAP between 23.00 hours and 03.00 hours (MAPnight).
Metabolic cage experiments
Mice were placed in metabolic cages (Tecniplast Deutschland GmbH, Hohenpeissenberg, Germany) for 24 h. Afterwards, blood was collected by penetrating the retro-orbital plexus under deep isoflurane anaesthesia. Both kidneys were removed and one kidney was dissected into cortex and medulla. All samples were immediately frozen in liquid N2 for further RNA or protein isolation. Plasma and urine Na+, K+ and Cl− concentrations were determined using Spotchem EL SE-1520 (Axonlab AG, Reichenbach-Stuttgart, Germany). Urine osmolality was determined using a semi-micro osmometer (Dr Ing Herbert Knauer GmbH, Berlin, Germany).
Hormones
Blood was collected from the retro-orbital plexus in anaesthetized mice 1 h before the light was turned off. Before blood collection, each mouse was preconditioned to anaesthesia handling. Plasma angiotensin II levels were determined using an enzyme-linked immunosorbent assay (ELISA) kit (Enzo Life Sciences, Inc., Ann Arbor, MI, USA) after the extraction protocol suggested by the manufacturer had been performed. Plasma aldosterone concentrations were determined using a radioimmunoassay (RIA) kit (Beckman Coulter, Inc., Brea, CA, USA).
mRNA expression in the kidney and in nephron segments
Total renal RNA was extracted (Chomczynski & Sacchi, 1987). RNA purity and yield were confirmed by electrophoresis when whole kidney samples were obtained (2100 Bioanalyzer; Agilent Technologies, Inc., Santa Clara, CA, USA). Quantification of mRNA expression levels by real-time PCR was performed on a Light Cycler 1.2 (Roche Diagnostics Deutschland GmbH, Mannheim, Germany) after RT reactions. All experiments were performed using the QuantiTect SYBR Green PCR kit (Qiagen GmbH, Hilden, Germany) according to the manufacturer's recommendations. The following primers were used: L32: 5′-gcaagttcctggtccacaatgtca-3′ (sense), 5′-actcattttcttcgctgcgtagcc-3′ (antisense); NCC: 5′-cgggataatggcaaggtcaagtcg-3′ (sense), 5′-ggaattctgatgcggatgtcattgatgg-3′ (antisense); β-ENaC: 5′-cgggatccatgtggttcctgcttacgctg-3′ (sense), 5′-ggaattcgtcctggtggtgttgctgtg-3′ (antisense); ROMK: 5′-cgggatccggcactgacagaaaggatg-3′ (sense), 5′-ggaattccaggtcaagtacagttgtcc-3′ (antisense); KS-WNK1: 5′-cgggatcccttccttatgctgtgggctag-3′ (sense), 5′-ggaattcgtcaaaactggctggcttcac-3′ (antisense); L-WNK1: 5′-cgggatccgaaaccactgtggaagtcg-3′ (sense), 5′-gaattcggttcagtcactaaaacaatgc-3′ (antisense); WNK4: 5′-cgggatccgaggctgtggatgtgtacgc-3′ (sense), 5′-ggaattcccgtgcggatgcagccttc-3′ (antisense); total-SPAK (FL- and KS-SPAK): 5′-cagagagtacctgatcgagaagc-3′ (sense), 5′-ctcatccatctcgtcatcgctcc-3′ (antisense); Sgk1: 5′-cgggatcccgaggctgctcgaagcac-3′ (sense), 5′-ggaattcgaggacggacccaggttg-3′ (antisense); Renin: 5′-cgggatccgtgcagccgcctctaccttgcttgt-3′ (sense), 5′-ggaattcgcagctcggtgacctctccaaag-3′ (antisense); ACE: 5′-gattgcagccgggcaacttttcccc-3′ (sense), 5′-ccttcttgccccagacctctgca-3′ (antisense).
Analysis of the data was performed using Light Cycler Version 3.5.3. Data were normalized to L32 mRNA or to μg total RNA and expressed as relative mRNA levels.
Microdissection of nephron segments
The DCT and connecting tubule/cortical collecting duct (CT/CCD) were obtained by a modified collagenase digestion protocol (Schafer et al. 1997) described in detail elsewhere (Vitzthum et al. 2002). After RT reaction, real-time PCRs were performed as described above. The correct identification of the nephron segments was confirmed by PCR with primers yielding PCR products known to be specific for different cortical segments. We tested the occurrence of NCC, SGLT2, AQP4 and NKCC2B.
Western blotting
The kidney cortex was homogenized in ice-cold isolation solution [250 mm sucrose, 10 mm triethanolamine, freshly added 1% protease and 1% phosphatase inhibitor cocktail (Sigma-Aldrich Corp.)]. The homogenate was centrifuged at 1000 g and the supernatant was used for immunoblotting after the determination of protein concentration (Bradford protein assay; Bio-Rad Laboratories GmbH, Munich, Germany). Quantities of 20 μg of protein were loaded on SDS gels to determine NCC, p-NCC, β-ENaC, ROMK, WNK4, SPAK and Sgk1 protein abundance; 2 μg of protein was used to determine actin abundance. After transfer, equal loading of gels was confirmed by reversible Ponceau staining (Romero-Calvo et al. 2010). Then, blocking and antibody incubation were performed according to standard protocols. WNK4 and SPAK antibodies were obtained from Cell Signaling Technology, Inc. (Danvers, MA, USA), NCC and Sgk1 antibodies were obtained from Millipore Corp. (Billerica, MA, USA), β-ENaC antibody was obtained from StressMarq Biosciences, Inc. (Victoria, BC, Canada), ROMK antibody was obtained from Alomone Labs Ltd (Jerusalem, Israel), NCC p-T60 antibody was obtained from the University of Dundee (Dundee, UK), and the actin antibody was obtained from Sigma-Aldrich Corp. The secondary antibodies were purchased from Thermo Fisher Scientific, Inc. (Waltham, MA, USA) and DakoCytomation Denmark A/S (Glostrup, Denmark). Antibody-bound HRP was detected by enhanced chemiluminescence (Bio-Rad Laboratories GmbH), documented on Hyperfilm ECL (GE Healthcare, Little Chalfont, UK), and quantified with Gelscan Image software (BioSciTec GmbH, Frankfurt, Germany).
Quantification and statistical analysis
Data were analysed using GraphPad Prism (Version 5.0) and are given as the mean ± s.e.m. Blood pressure data were analysed by two-way ANOVA followed by Bonferroni's post hoc tests or with the paired two-tailed Student's t test. Comparisons among three different groups were performed with one-way ANOVA followed by Bonferroni's multiple comparison tests. Differences were regarded as significant at P < 0.05 (*), P < 0.01 (**), and P < 0.001 (***).
Results
Blood pressure
To determine the influence of different levels of K+ intake on MAP in Na+ replete mice, we performed telemetric blood pressure measurements. All animals were fed a diet containing 0.93% K+ and 0.24% Na+ (control diet), and SAP, DAP and MAP were determined by radiotelemetry for 48 h. When the control measurements were completed, the mice were divided into three experimental groups and fed on a high Na+ (3%) diet containing, respectively, a low (low K+ group: 0.03% K+ and 3% Na+; n = 5), normal (normal K+ group: 0.93% K+ and 3% Na+; n = 4) or high (high K+ group: 5% K+ and 3% Na+; n = 5) amount of K+ for 10 days. SAP, DAP and MAP were recorded again for 48 h on days 9 and 10. In all recordings mice displayed a circadian blood pressure rhythm with higher MAP during the activity period (MAPnight) compared with the sleeping period (MAPday) (Fig. 1A–C). Blood pressure remained unchanged in the normal K+ group (Fig. 1B, E), but was elevated in the low K+ group (Fig. 1A, D) and in the high K+ group (Fig. 1C, F). On average, MAPnight increased by 13.7 mmHg (P < 0.05) in the low K+ group and by 19.6 mmHg (P < 0.01) in the high K+ group in comparison with that in the control group. Thus both a low K+ intake and a high K+ intake induce high blood pressure in Na+ replete mice.
Figure 1.
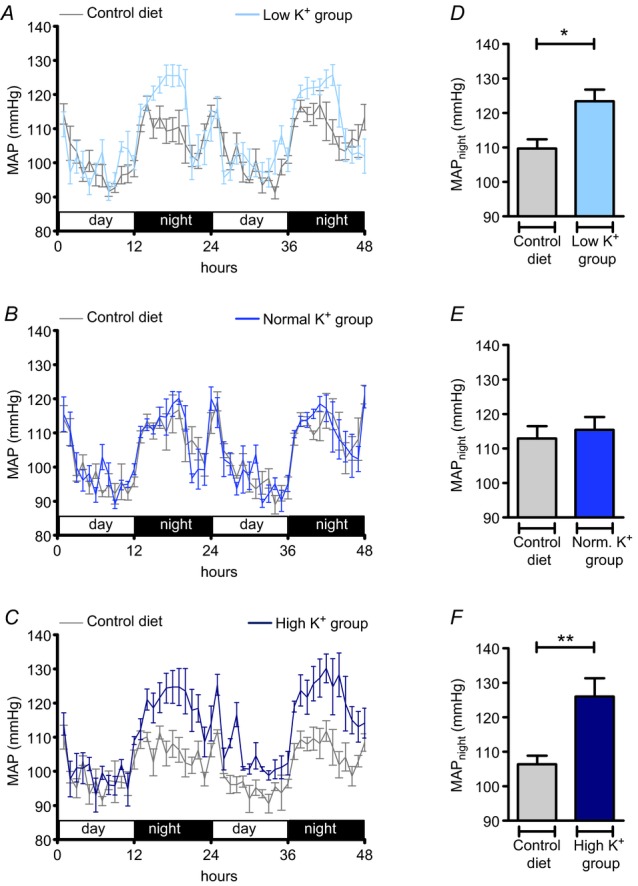
Mean arterial pressure (MAP) during the activity period was significantly elevated in mice in both the low K+ (A, D) and high K+ (C, F) groups. A–C, time course of mean ± s.e.m MAP in mice in the low K+ (0.03% K+, 3% Na+; n = 5), normal K+ (0.93% K+, 3% Na+; n = 4), and high K+ (5% K+, 3% Na+; n = 5) groups compared with MAP in mice on the control diet (0.93% K+, 0.24% Na+). D–F, mean ± s.e.m MAPnight in mice on the control diet and mice on the experimental diets (*P < 0.05, **P < 0.01, Student's paired t test). Mice were kept on a 12 : 12 h light : dark cycle. Blood pressure recordings were performed for 48 h before the experimental diets were started and again in the same mice at the end of the experimental period.
Renal electrolyte handling
To examine a potential involvement of the kidney in the observed MAP increase, we carried out metabolic cage experiments (Table 1). At the end of the 10 days of specific diet, each mouse was housed for 24 h in a metabolic cage. Mice from the low K+ group exhibited hypernatraemia and hypokalaemia (Fig. 2A, B) in comparison with those in the normal and high K+ groups, which showed normal plasma Na+ and K+ concentrations (Fig. 2A, B). The amount of Na+ excreted by the kidney (mmol/24 h), as well as renal Na+ clearance (ml/24 h) were significantly decreased in mice from the low K+ group as well as in mice from the high K+ group (Fig. 2C, E). The amount of K+ excreted by the kidney (mmol/24 h) and renal K+ clearance (ml/24 h) were highest in the high K+ group and lowest in the low K+ group (Fig. 2D, F). These findings show that blood pressure elevation in response to both K+ depletion and K+ loading is associated with marked renal Na+ retention, indicating a critical involvement of the kidneys in the genesis of hypertensive responses.
Table 1.
Physiological parameters in Na+ replete mice fed different K+ diets
| Low K+ group 0.03% K+, 3% Na+ | Normal K+ group 0.93% K+, 3% Na+ | High K+ group 5% K+, 3% Na+ | |
|---|---|---|---|
| Food intake, g/24 h | 2.73 ± 0.12 | 3.09 ± 0.12 | 3.03 ± 0.24 |
| Drinking volume, ml/24 h | 9.42 ± 1.00 | 7.40 ± 0.76 | 7.79 ± 0.56 |
| Urinary volume, ml/24 h | 5.34 ± 0.58* | 3.44 ± 0.52 | 3.94 ± 0.38 |
| Urinary osmolarity, mOsmol/l | 843.1 ± 78.1 | 1449.0 ± 223.8 | 1414.0 ± 181.0 |
| Plasma K+, mmol/l | 2.20 ± 0.08†§ | 3.89 ± 0.11 | 4.26 ± 0.16 |
| Urine K+, mmol/24 h | 0.02 ± 0.003*§ | 0.48 ± 0.051 | 1.54 ± 0.165† |
| K+ clearance, ml/24 h | 10.5 ± 1.1*§ | 123.2 ± 11.9 | 362.2 ± 39.3† |
| Plasma Cl−, mmol l−1 | 124.6 ± 3.4 | 131.1 ± 5.8 | 122.9 ± 4.5 |
| Urine Cl−, mmol/24 h | 1.19 ± 0.12 | 1.63 ± 0.18 | 1.33 ± 0.13 |
| Cl− clearance, ml/24 h | 10.3 ± 0.9 | 13.2 ± 1.9 | 10.7 ± 0.8 |
| Plasma Na+, mmol l−1 | 150.0 ± 1.3†‡ | 140.9 ± 1.7 | 142.6 ± 1.3 |
| Urine Na+, mmol/24 h | 1.46 ± 0.16* | 2.16 ± 0.22 | 1.49 ± 0.11* |
| Na+ clearance, ml/24 h | 10.5 ± 0.9* | 15.7 ± 1.6 | 10.5 ± 0.9* |
Mice were placed in metabolic cages for 24 h at the end of the 10 days of experimental diet. Plasma was taken at the end of the experimental period. Values represent mean ± s.e.m (n = 8 animals in each group).
P < 0.05
P < 0.001 versus normal K+ group
P < 0.05
P < 0.001 versus high K+ group evaluated by one-way ANOVA followed by Bonferroni's multiple comparison tests.
Figure 2.
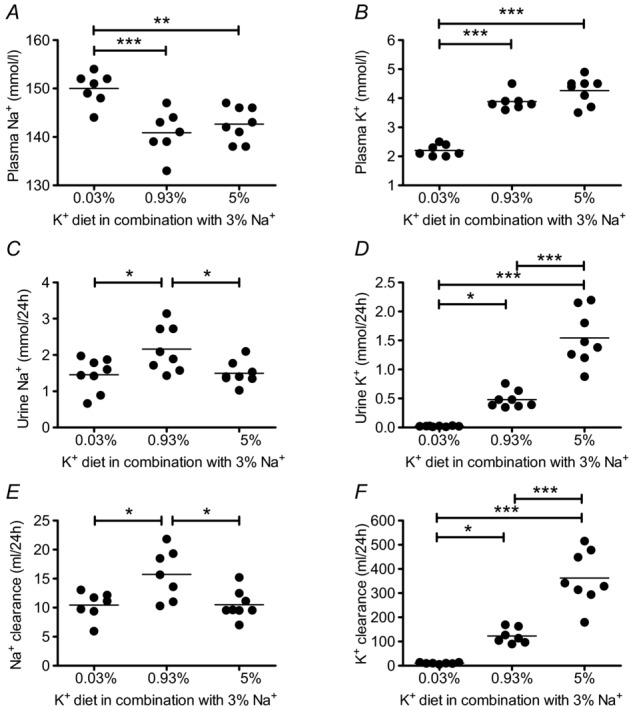
A, B, plasma Na+ and K+ concentrations measured after 10 days of experimental diet (mean ± s.e.m; n = 7–8 each diet). Mice in the low K+ (0.03% K+, 3% Na+) group exhibited hypernatraemia and hypokalaemia. C–F, renal Na+ and K+ excretion and clearance after 10 days of experimental diet (mean ± s.e.m; n = 7–8 each diet). Renal Na+ excretion (C) and clearance (E) were reduced in the low K+ and high K+ (5% K+, 3% Na+) groups. Renal K+ excretion (D) and clearance (F) increased with the amount of K+ in the diets (*P < 0.05, **P < 0.01, ***P < 0.001, one-way ANOVA).
Renal gene and protein expression
To gain further insight into the tubular mechanisms involved in the Na+ retention evoked by the high and low K+ diets, we next analysed gene expression levels of NCC, β-ENaC and ROMK in whole kidneys by real-time PCR. Surprisingly, we could not detect any significant differences in mRNA levels between the low and high K+ groups after 10 days of specific diet (Fig. 3A). We therefore refined the transcriptional analysis and collected tissue from DCT and CT/CCD segments by microdissection. Indeed, we now found opposite changes for the mRNA ratio of NCC : β-ENaC in DCT segments in the low and high K+ groups after 10 days of diet (Fig. 3B). By contrast, no differences were detected in the CT/CCD (Fig. 3C). Analysis of protein expression in the renal cortex by Western blotting yielded very similar results, with a significantly higher abundance of NCC protein and a significantly lower abundance of β-ENaC in the low K+ group (Fig. 4). Low K+ intake also increased phosphorylation of NCC, indicating activation of electroneutral Na+ reabsorption under these conditions. ROMK protein abundances were nearly identical in all groups (Fig. 4).
Figure 3.
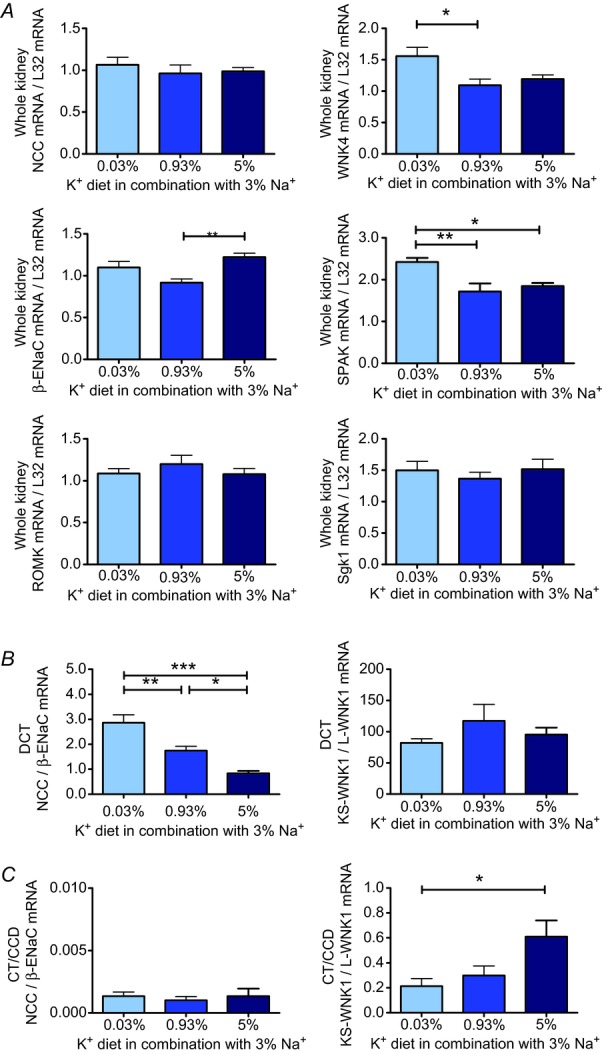
Alterations in K+ intake induce specific changes in gene expression of Na+ and K+ transporters, channels and transport-regulating kinases in the whole kidney and distal nephron. A, expression levels of NCC, β-ENaC, ROMK, WNK4, SPAK and Sgk1 mRNA (normalized to L32 mRNA) in the whole kidney (n = 8 each diet) after 10 days of experimental diet. In the low K+ group, WNK4 mRNA and SPAK mRNA expression were significantly upregulated. In the high K+ group, a significant increase in β-ENaC mRNA was observed. B, in microdissected distal convoluted tubule (DCT; n = 5–8 each diet), the ratio of NCC : β-ENaC mRNA was increased in the low K+ and decreased in the high K+ groups after 10 days of experimental diet. C, in microdissected connecting tubule/cortical collecting duct (CT/CCD; n = 5–8 each diet) from the high K+ group, the KS-WNK1 : L-WNK1 mRNA ratio was increased (mean ± s.e.m; *P < 0.05, **P < 0.01, ***P < 0.001, one-way ANOVA).
Figure 4.

A, representative immunoblots of NCC, p-T60 NCC, β-ENaC, ROMK, WNK4, SPAK, Sgk1 and actin in kidney cortex after 10 days of experimental diet (20 μg per lane, except for actin blot: 2 μg per lane). B, renal protein levels shown as the mean ± s.e.m. The band densities of the lower β-ENaC lane (∼90 kDa) and the upper SPAK lane (∼75 kDa) were included in calculations of protein abundance (mean ± s.e.m; n = 8–9 each diet; *P < 0.05, **P < 0.01, ***P < 0.001, one-way ANOVA).
To examine the effects of K+ intake on the upstream kinase network, we also quantified gene expression levels of KS-WNK1, L-WNK1, WNK4, SPAK and Sgk1 by real-time RT-PCR. In the high K+ group, expression of KS-WNK1 mRNA was significantly increased, whereas expression of L-WNK1 mRNA was significantly decreased, resulting in a highly significant elevation of the KS-WNK1 : L-WNK1 mRNA ratio (P < 0.001, data not shown) in whole kidneys from the high K+ group in comparison with those from other groups. An increased KS-WNK1 : L-WNK1 mRNA ratio was also detected in the CT/CCD (Fig. 3C), but not DCT (Fig. 3B) in the high K+ group. WNK4 mRNA (Fig. 3A) and SPAK mRNA (Fig. 3A) displayed an opposite pattern of expression with significantly higher mRNA levels in whole kidneys in the low K+ group. A higher expression level was also found for SPAK protein in the low K+ group. WNK4 protein abundance was not affected by the K+ diets. Sgk1 mRNA expression was not influenced by the different K+ diets (Fig. 3A), but Sgk1 protein abundance was significantly augmented in the high K+ group (Fig. 4). Collectively, these data demonstrate that in Na+ replete mice, K+ depletion induces an upregulation and phosphorylation of NCC and an increased expression of its activating kinase SPAK, whereas K+ loading upregulates β-ENaC and Sgk1 expression and increases the KS-WNK1 : L-WNK1 mRNA ratio.
Renin–angiotensin–aldosterone system
As angiotensin II and aldosterone are thought to act as key mediators to signal the physiological state to the multikinase network in the distal nephron, we next assessed the effects of the K+ diets on the renin–angiotensin–aldosterone system. As expected from the high Na+ intake, plasma angiotensin II concentrations were low and indistinguishable in all K+ diet groups (Fig. 5A). By contrast, plasma aldosterone concentrations differed greatly among the experimental groups. While it was suppressed in the normal (3.5 ± 1.0 pg ml−1; n = 8) and low (9.5 ± 1.9 pg ml−1; n = 9) K+ groups, plasma aldosterone concentration was significantly elevated in the high K+ group (136.5 ± 45.4 pg ml−1; P < 0.01; n = 9) (Fig. 5B) despite the high Na+ intake. To examine a potential stimulation of the local renal renin–angiotensin system, we additionally investigated mRNA levels of renin and angiotensin converting enzyme (ACE) in whole kidneys. Renal renin mRNA expression was not altered in the low and high K+ groups (Fig. 5C). By contrast, renal ACE mRNA expression was highest in the low K+ group, reaching a level approximately twice as high as that in the high K+ group (P < 0.001) (Fig. 5D). This latter observation is consistent with an activation of local production of angiotensin II in the kidneys during K+ depletion in Na+ replete mice.
Figure 5.
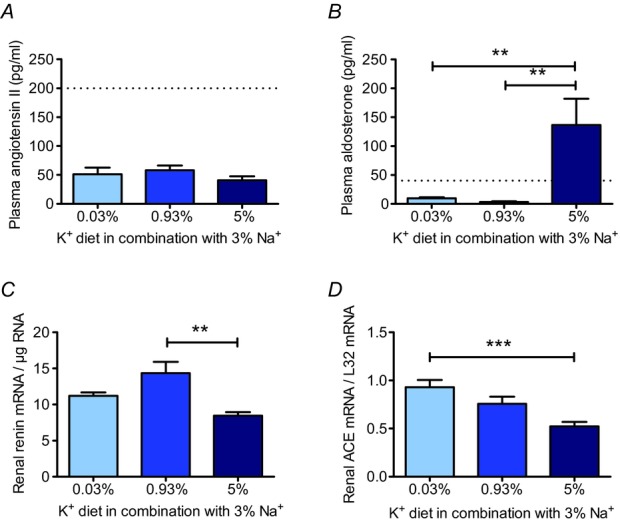
A, in all three K+ groups, plasma angiotensin II levels were reduced (mean ± s.e.m; n = 5 each). B, in the high K+ group, plasma aldosterone concentration was significantly increased (mean ± s.e.m; n = 8–9 each). C, in the high K+ group, renin mRNA was significantly reduced (mean ± s.e.m; n = 8 each). D, renal ACE mRNA level (mean ± s.e.m; n = 8 each) was highest in the low K+ group. (**P < 0.01, ***P < 0.001, one-way ANOVA). Dashed lines in A and B indicate plasma angiotensin II and aldosterone concentrations found in mice on the control diet.
Blockade of angiotensin AT1 receptors
In the low K+ group, the elevated blood pressure and renal Na+ retention were associated with suppressed plasma aldosterone levels and possibly a stimulated intrarenal angiotensin II production rate, suggesting a pivotal role of an increased AT1R stimulation in the pathogenesis of the hypertensive response. To test this hypothesis, we investigated the effects of the selective AT1R antagonist losartan (31.5 mg kg−1 per day) in all K+ diet groups. Before treatment all animals were fed the control diet (0.93% K+ and 0.24% Na+) and MAP was recorded for 48 h. Then losartan treatment was started. On the second day of losartan treatment, the diet was switched to the low K+, normal K+ or high K+ diet. MAP was recorded again for 48 h on days 9 and 10 after the switch to the specific K+ diet. As Fig. 6 shows, losartan treatment normalized MAPnight in the low K+ group (Fig. 6A, D), but did not affect the hypertensive response in the high K+ group, in which animals continued to exhibit a significantly elevated MAPnight (Δ: 12.8 mmHg; P < 0.05) (Fig. 6C, F). MAP in the normal K+ group remained entirely unaffected by losartan treatment (Fig. 6B, E), demonstrating a specific blood pressure-lowering effect of AT1R blockade on MAP in Na+ replete mice subjected to K+ depletion.
Figure 6.
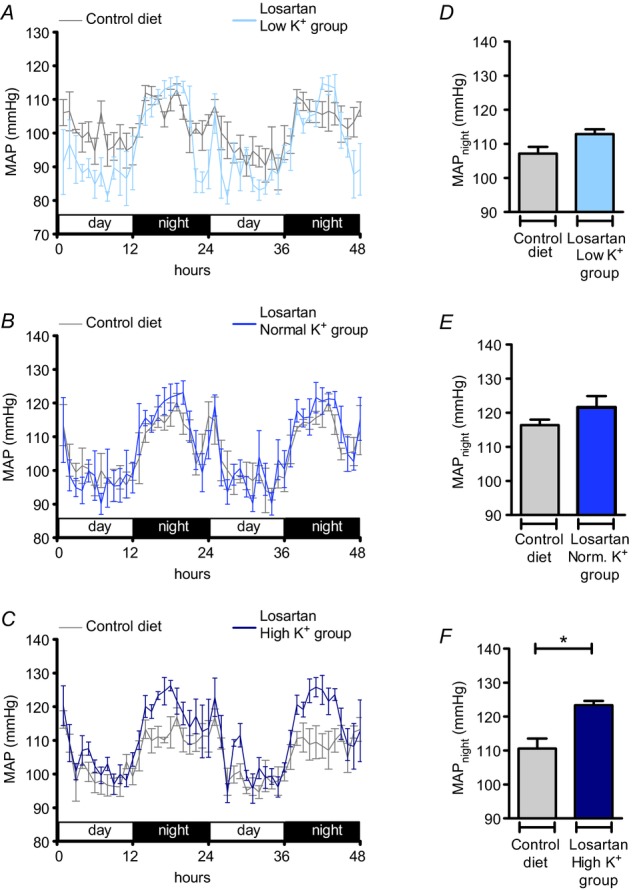
A–C, time course of mean arterial pressure (MAP) in mice in the low K+ (A, 0.03% K+, 3% Na+; n = 5), normal K+ (B, 0.93% K+, 3% Na+; n = 4) and high K+ (C, 5% K+, 3% Na+; n = 5) groups treated with losartan (31.5 mg kg−1 per day) compared with MAP in mice on the control diet (0.93% K+, 0.24% Na+). D–F, MAPnight in mice on the control diet in comparison with MAPnight in mice treated with losartan and the experimental diets (mean ± s.e.m; *P < 0.05, Student's paired t test). Blood pressure recordings were performed for 48 h before the experimental diets were started and again in the same mice at the end of the experimental period.
To evaluate whether the blood pressure reduction by AT1R blockade in the low K+ group was of renal origin, we assessed the effects of losartan (45 mg kg−1 per day) on renal electrolyte handling during low K+ intake using metabolic cages. Unexpectedly, renal Na+ handling remained almost unchanged during losartan treatment (Fig. 7). Indeed, a tendency for further aggravation of hypernatraemia emerged in the low K+ group treated with losartan (Fig. 7A). As is consistent with these functional data, losartan treatment did not show any effect on renal protein expression in the low K+ group (Fig. 8). Abundances of NCC and SPAK protein remained significantly elevated in comparison with levels in the control group. These results indicate that low K+ intake activates the distal nephron by an angiotensin-independent mode of action, and suggest that the blood pressure-lowering effect of AT1R antagonism is mediated by an extrarenal effect.
Figure 7.
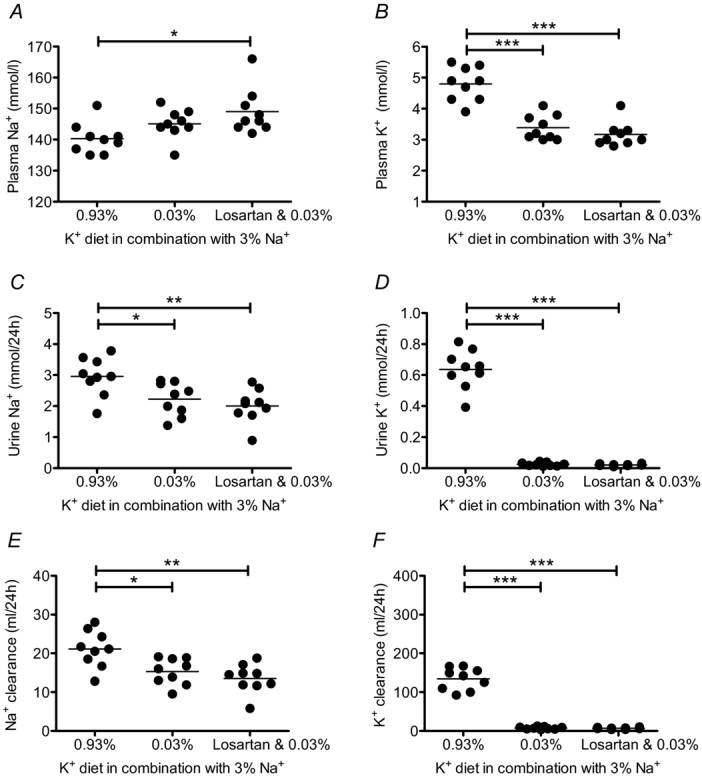
Plasma Na+ concentration (A) was increased, and urine Na+ excretion (C) and Na+ clearance (E) were decreased in the low K+ group, despite AT1R antagonism by losartan treatment (45 ± 1.6 mg kg−1 per day). Renal K+ handling was not influenced by losartan treatment (B, D, F). Mice received experimental diets for 10 days and were housed in metabolic cages at the end of the experimental period. Losartan treatment started 1 day prior to diet and was continued for 11 days (mean ± s.e.m; n = 8–9 each diet; *P < 0.05, **P < 0.01, ***P < 0.001, one-way ANOVA).
Figure 8.

NCC, p-T60 NCC, and SPAK protein levels were significantly increased in the low K+ group independent of treatment. A, representative immunoblots of NCC, p-T60 NCC, WNK4, SPAK, and actin in kidney cortex (20 μg per lane, except for actin blot: 2 μg per lane). B, renal protein levels shown as the mean ± s.e.m. The band density of the upper SPAK lane (∼75 kDa) was included in the calculation of protein abundance. Mice received experimental diets for 10 days. Losartan treatment started 1 day prior to the experimental diet and was continued for 11 days (mean ± s.e.m; n = 8–9 each diet; **P < 0.01, ***P < 0.001, one-way ANOVA).
Inhibition of NCC
We next determined the role of the increased abundance and activation of NCC in the elevation in blood pressure in the low K+ group by examining the effects of the NCC inhibitor HCTZ. After a baseline recording of MAP for 48 h, during which animals received the control diet (0.93% K+ and 0.24% Na+), HCTZ treatment (14.3 mg kg−1 per day for 11 days) was started. One day later the diet was switched to the low K+, normal K+ or high K+ regimen. MAP was recorded again for 48 h on days 9 and 10 after the switch to the experimental K+ diet. HCTZ treatment normalized MAPnight in the low K+ group (Fig. 9A, D), but did not affect the hypertensive response in the high K+ group, in which animals continued to exhibit a significantly elevated MAPnight (Δ: 12.7 mmHg; P < 0.01) (Fig. 9C, F). In metabolic cage experiments, HCTZ treatment also normalized the plasma Na+ concentration in the low K+ group (Fig. 10A) and attenuated the reductions in Na+ excretion and Na+ clearance (Fig. 10C, E) induced by low K+ intake. These results indicate that an activation of NCC in the distal nephron contributes to the Na+ retention and hypertensive response induced by the low K+ intake.
Figure 9.
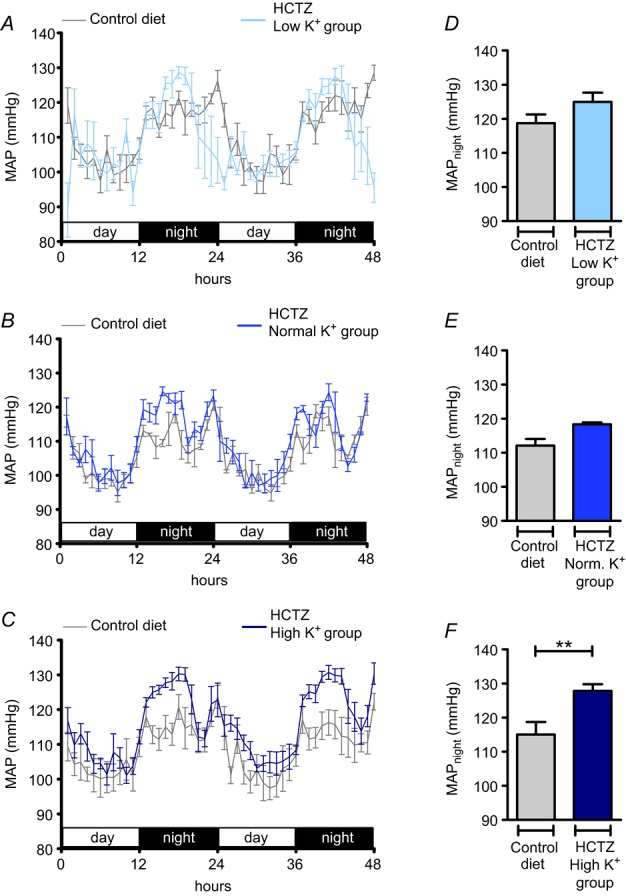
A–C, time course of mean arterial pressure (MAP) in mice in the low K+ (A, 0.03% K+, 3% Na+; n = 4), normal K+ (B, 0.93% K+, 3% Na+; n = 4) and high K+ (C, 5% K+, 3% Na+; n = 6) groups treated with hydrochlorothiazide (HCTZ) (14.3 mg kg−1 per day) compared with MAP in mice on the control diet (0.93% K+, 0.24% Na+). D–F, MAPnight in mice on the control diet in comparison with MAPnight in mice treated with HCTZ and the experimental diets (mean ± s.e.m; **P < 0.01, Student's paired t test). Blood pressure recordings were performed for 48 h before the experimental diets were started and again in the same mice at the end of the experimental period.
Figure 10.
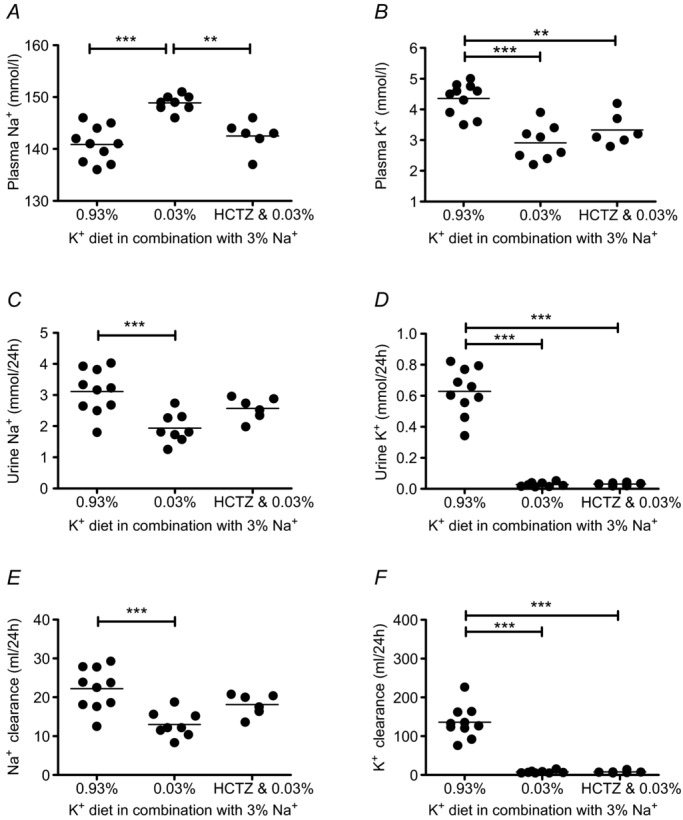
Plasma Na+ concentration (A), Na+ excretion (C) and Na+ clearance (E) during hydrochlorothiazide (HCTZ) treatment (14.3 ± 1.0 mg kg−1 per day) in the low K+ group. Renal K+ handling was not influenced by HCTZ treatment (B, D, F). Mice received experimental diets for 10 days and were housed in metabolic cages at the end of the experimental period. HCTZ treatment started 1 day prior to diet and was continued for 11 days (mean ± s.e.m; n = 6–10 each diet; **P < 0.01, ***P < 0.001, one-way ANOVA).
Blockade of the MR receptor and ENaC
By contrast with the low K+ group, the elevated blood pressure and renal Na+ retention in the high K+ group coincided with markedly increased circulating aldosterone concentrations and suppressed angiotensin II levels, suggesting a major role of MR stimulation in the pathogenesis of the hypertensive response. Therefore, we examined the effects of the selective MR antagonist spironolactone (175 mg kg−1 per day for 11 days) in all K+ diet groups. Again, all animals were fed the control diet (0.93% K+ and 0.24% Na+) and MAP was recorded for 48 h before spironolactone treatment was started. Animals were switched to the low K+, normal K+ or high K+ diet on the second day of treatment and MAP was recorded again for 48 h at the end of the 10 days of diets. The normal K+ group exhibited nearly identical MAP values with and without spironolactone (Fig. 11B, E). In the low K+ group, MAPnight remained elevated during spironolactone treatment (Δ: 5.9 mmHg; P < 0.05) (Fig. 11A, D). Unexpectedly, spironolactone treatment also failed to prevent the hypertensive response in the high K+ group (Fig. 11C, F), which averaged 13.9 mmHg after 10 days of treatment (P < 0.01). A nearly identical result (ΔMAPnight: 14.0 mmHg; P < 0.001) was obtained when the experiments were repeated with a four-fold higher dose of spironolactone (Fig. 12A). Plasma K+ concentrations significantly increased during spironolactone treatment (P < 0.01) (Table 2), indicating that the dose administered was effective. To test the possibility that the blood pressure increase in response to high K+ intake was linked to a MR-independent stimulation of electrogenic transport through ENaC, we administered in a separate experimental series the ENaC blocker amiloride (4.8 mg kg−1 per day). As Fig. 12B shows, amiloride treatment also did not prevent the hypertensive response to the high K+ diet (Δ: 12.9 mmHg; P < 0.01). These results suggest that the hypertensive response in the high K+ group is not the consequence of excessive MR stimulation, although the plasma aldosterone concentrations are considerably elevated under these conditions (Fig. 5B).
Figure 11.
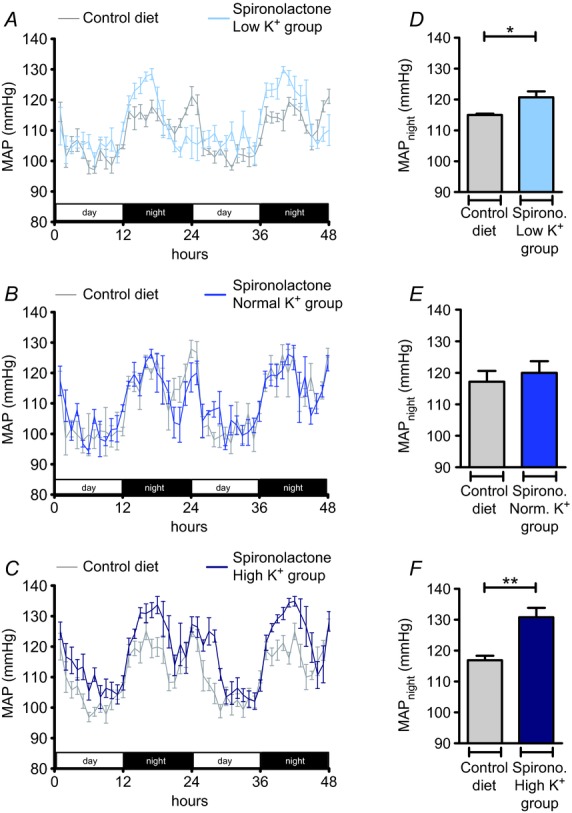
A–C, time course of mean arterial pressure (MAP) in mice in the low K+ (A, 0.03% K+, 3% Na+; n = 5), normal K+ (B, 0.93% K+, 3% Na+; n = 3) and high K+ (C, 5% K+, 3% Na+; n = 5) groups treated with spironolactone (175 mg kg−1 per day) compared with MAP in mice on the control diet (0.93% K+, 0.24% Na+). D–F, MAPnight in mice on the control diet in comparison with MAPnight in mice treated with spironolactone and the experimental diets. (Mean ± s.e.m; *P < 0.05, **P < 0.01, Student's paired t test).
Figure 12.
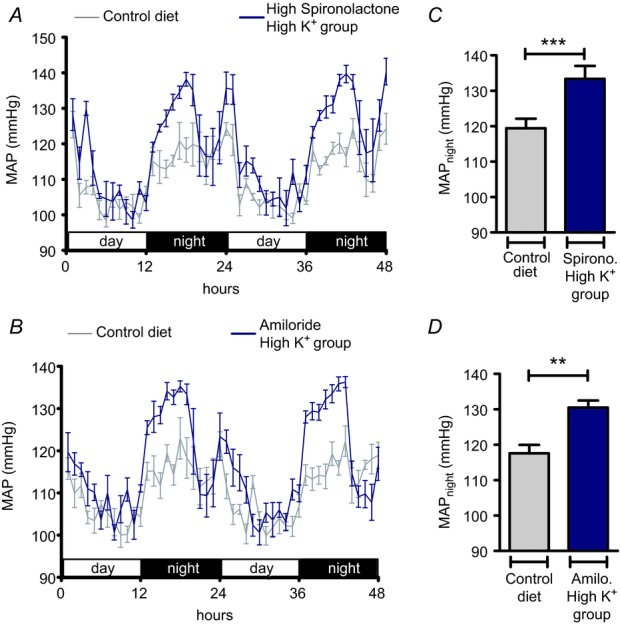
A, B, time course of mean arterial pressure (MAP) in mice in the high K+ (5% K+, 3% Na+) group treated with a high dosage of spironolactone (665 mg kg−1 per day; n = 4) or amiloride (4.8 mg kg−1 per day; n = 5) compared with MAP in mice fed control diet (0.93% K+, 0.24% Na+). C, D, MAPnight in mice fed control diet in comparison with MAPnight in mice in the high K+ (5% K+, 3% Na+) group additionally treated with spironolactone (C) or amiloride (D) (mean ± s.e.m; **P < 0.01,***P < 0.01, Student's paired t test). Blood pressure recordings were performed for 48 h before the experimental diet was started and again in the same mice at the end of the experimental period.
Table 2.
Effect of mineralocorticoid receptor (MR) antagonism on plasma K+ and Na+ concentrations
| Plasma K+ concentration, mmol l−1 |
Plasma Na+ concentration, mmol l−1 |
||||
|---|---|---|---|---|---|
| Diet | n | Spironolactone treatment | Sham treatment | Spironolactone treatment | Sham treatment |
| 0.03% K+, 3% Na+ | 7 | 2.63 ± 0.11 | 2.54 ± 0.07 | 153.0 ± 1.7 | 152.9 ± 0.5 |
| 5% K+, 3% Na+ | 8 | 5.69 ± 0.12* | 4.70 ± 0.23 | 149.3 ± 1.2 | 150.4 ± 1.1 |
Plasma K+ and Na+ concentrations in mice fed a 10-day diet with or without spironolactone treatment (175 mg kg−1 per day). Values represent mean ± s.e.m
(P < 0.01, Student's t test).
Discussion
Our findings indicate that in the presence of a high Na+ intake, the regulation of renal K+ and Na+ handling become functionally coupled, resulting in Na+ retention and high blood pressure when K+ intake is either restricted or increased. This implies that the physiological mechanisms that allow for independent renal handling of K+ and Na+ during either Na+ depletion or K+ excess are not effective in a high Na+ condition. The normal adaptive responses in renal K+ clearance and aldosterone secretion to changes in K+ intake, the alterations in the expression pattern of ion channels, transporters and the kinase network in the ASDN, and the blood pressure and renal responses to pharmacological inhibition are consistent with the dominance of mechanisms that maintain K+ homeostasis over those that maintain Na+ homeostasis in a Na+ replete state.
Previous studies have shown increased NCC abundance (Frindt & Palmer, 2010) and phosphorylation (Vallon et al. 2009) during a reduced K+ intake. Confirming these findings, we observed an upregulation of NCC protein and phosphorylation in the renal cortex and a high NCC : ENaC mRNA ratio in the DCT of Na+ replete mice fed a low K+ diet, demonstrating that dietary K+ restriction is a strong stimulus for NCC expression and activity independent of blood volume and Na+ homeostasis. In addition, we found an increase of SPAK mRNA and protein expression in the low K+ group. Recent gene knockout studies in mice have shown that the ion transporter activating kinase SPAK regulates NCC abundance and phosphorylation in the distal nephron (Rafiqi et al. 2010; Yang et al. 2010; McCormick et al. 2011) and may play an important role in adaptation to a depletion in ECF volume (McCormick et al. 2011). The upregulation of SPAK by K+ depletion observed in this study in Na+ replete mice suggests that the SPAK–NCC pathway may also be involved in K+ homeostasis independently of the ECF volume state.
Low K+ intake was also associated with increased expression of WNK4 mRNA. WNK4 is an upstream regulator of SPAK (Welling et al. 2010), and targeted disruption of WNK4 causes reduced phosphorylation of NCC and low blood pressure in mice (Ohta et al. 2009). These observations suggest that under normal physiological conditions, the major function of WNK4 is to stimulate NCC activity via SPAK, thus enhancing electroneutral Na+ reabsorption. Consequently, activation of the WNK4–SPAK–NCC pathway in a Na+ replete state should result in Na+ retention and high blood pressure. We therefore treated mice in the low K+ group with the NCC inhibitor HCTZ, which completely prevented hypernatraemia and the rise of MAP, supporting a pathophysiologically relevant activation of electroneutral Na+ reabsorption by the WNK4–SPAK–NCC pathway in the low K+ group. The physiological state induced by the low K+ diet in Na+ replete mice is also remarkably similar to Gordon syndrome, a rare Mendelian form of hypertension caused by enhanced activity of the WNK4–NCC pathway (Chen & Coffman, 2012), further supporting a renal origin of the hypertensive response to the low K+ diet.
The primary signal that activates the WNK4–SPAK–NCC pathway in the low K+ group remains obscure. Both angiotensin II and aldosterone infusion have been shown to stimulate the WNK4–SPAK–NCC pathway (van der Lubbe et al. 2011, 2012; Castaneda-Bueno et al. 2012b). Furthermore, angiotensin II can directly reverse the inhibitory effect of WNK4 on NCC to one that is stimulatory (San-Cristobal et al. 2009). These observations suggest that under normal physiological conditions, the WNK4–SPAK–NCC pathway is under the control of angiotensin II. Unexpectedly, renal protein expression, as well as renal electrolyte handling and plasma electrolytes were completely unaffected by the AT1R antagonist losartan, indicating that low K+ intake activates the distal nephron by an angiotensin-independent mode of action. A possible mechanism may be a direct influence of the extracellular K+ concentration, which was markedly reduced in the low K+ group. This idea is supported by in vitro observations showing that low extracellular K+ concentrations increase WNK1 activity (Naito et al. 2011), but recently it has been reported that changes in extracellular K+ concentration are not sufficient to alter NCC phosphorylation in freshly isolated kidney tubules (Sorensen et al. 2013).
A major mechanism for K+ secretion in the ASDN is aldosterone-dependent (Rodan et al. 2011). Correspondingly, we found concentrations of aldosterone three-to four-fold higher than those in normal plasma in the high K+ group. Elevated circulating levels of aldosterone increase circulating blood volume and can cause severe hypertension in Na+ replete states. Our observation that treatment with the MR antagonist spironolactone significantly increased plasma K+ concentrations in the high K+ group supports a major role for aldosterone in the facilitation of K+ secretion and the maintenance of K+ in plasma within the normal range. These functional data are corroborated by the transcriptional changes induced by the high K+ diet in the ASDN. As in earlier reports on the effects of a high K+ diet and aldosterone on the ASDN, we found increased expression of renal β-ENaC (Frindt & Palmer, 2010; Nguyen et al. 2012) and Sgk1 (Shigaev et al. 2000) in the high K+ group. Additionally, the KS-WNK1 : L-WNK1 mRNA ratio was increased, which is expected to alleviate ROMK inhibition by L-WNK1 (O'Reilly et al. 2006; Wade et al. 2006) and hence further facilitate K+ secretion.
As both Sgk1 and KS-WNK1 activate ENaC (Naray-Fejes-Toth et al. 2004), our data are consistent with a preferred activation of electrogenic Na+ reabsorption via ENaC in the high K+ group. Activation of this transport pathway would steepen the electrical gradient for K+ secretion and may also explain Na+ retention and hypertension in the Na+ replete state, which is associated with a high distal tubular Na+ load. Surprisingly, however, treatment with the MR antagonist spironolactone as well as with the ENaC blocker amiloride failed to normalize MAP in the high K+ group, implicating the presence of MR-and ENaC-independent mechanisms in the pathogenesis of the elevated MAP. Treatment with the AT1R antagonist losartan and the NCC inhibitor HCTZ also failed to reduce MAP in the high K+ group. Accordingly, the mechanisms underlying the hypertension in the high K+ group remain unclear at present and require further investigation.
High blood pressure associated with a diet characterized by a low K+ and high Na+ intake, commonly referred to as the Western diet, is a frequent observation in humans (Krishna et al. 1989; Coruzzi et al. 2001; Adrogue & Madias, 2007). Increasing K+ intake from a low to a normal level can reverse the increase in MAP (Morris et al. 1999). The mechanisms underlying the hypertensive effect of the low K+ intake are still largely unknown (Huang & Kuo, 2007). Our data demonstrate an important renal contribution to the hypertensive effects of a Western diet in mice via an angiotensin-and aldosterone-independent activation of the WNK4–SPAK–NCC pathway. It will be of interest to see whether a similar mechanism is also important in the pathogenesis of high blood pressure associated with a Western diet in humans.
Key points
The adrenal hormone aldosterone can stimulate K+ secretion during hyperkalaemia and Na+ reabsorption during hypovolaemia in the kidney.
Angiotensin II is thought to switch the physiological mode of action from K+ excretion towards Na+ retention, but how the regulation is achieved when angiotensin II levels are suppressed by high Na+ intake remains unknown.
We report that both dietary K+ depletion and dietary K+ loading provoke renal Na+ retention and increase blood pressure in Na+ replete mice, but these occur through different renal kinase signalling and Na+ transport pathways.
An angiotensin II-and aldosterone-independent activation of the sodium-chloride cotransporter NCC contributes to the blood pressure increase induced by K+ depletion, whereas the hypertensive response to K+ loading is dependent on neither aldosterone nor Na+ transport via the epithelial sodium channel ENaC.
These findings imply a major impact of K+ homeostasis on renal Na+ handling in the Na+ replete state and suggest a mechanism for the hypertensive effect of the Western diet (high Na+ and low K+) in humans.
Acknowledgments
We would like to thank Telse Kock for her excellent technical support.
Glossary
- ACE
angiotensin-converting enzyme
- ASDN
aldosterone-sensitive distal nephron
- AT1R
angiotensin receptor type 1
- AQ4
aquaporin 4
- CT/CCD
connecting tubule/cortical collecting duct
- DCT
distal convoluted tubule
- ECF
extracellular fluid
- ENaC
epithelial sodium channel
- HCTZ
hydrochlorothiazide
- KS-WNK1
kidney-specific with-no-lysine kinase 1
- L-WNK1
full-length with-no-lysine kinase 1
- MAP
mean arterial blood pressure
- MR
mineralocorticoid receptor
- NCC
sodium-chloride cotransporter
- NKCC2
sodium-potassium-chloride cotransporter 2
- ROMK
renal outer medullary potassium channel
- Sgk1
serum and glucocorticoid-induced kinase 1
- SGLT2
sodium-glucose cotransporter 2
- SPAK
STE20/SPS1-related proline/alanine rich kinase
- WNK4
with-no-lysine-kinase 4
Additional information
Competing interests
None declared.
Author contributions
H.V. and H.E. designed the research. H.V., A.S., L.H.S., M.L.M. and H.H. performed the research. All authors analysed the data. H.V. and H.E. wrote the paper. All authors approved the final version of the manuscript.
Funding
None declared.
References
- Adrogue HJ, Madias NE. Sodium and potassium in the pathogenesis of hypertension. N Engl J Med. 2007;356:1966–1978. doi: 10.1056/NEJMra064486. [DOI] [PubMed] [Google Scholar]
- Arroyo JP, Ronzaud C, Lagnaz D, Staub O, Gamba G. Aldosterone paradox: differential regulation of ion transport in distal nephron. Physiology (Bethesda) 2011;26:115–123. doi: 10.1152/physiol.00049.2010. [DOI] [PubMed] [Google Scholar]
- Castaneda-Bueno M, Arroyo JP, Gamba G. Independent regulation of Na+ and K+ balance by the kidney. Med Princ Pract. 2012;21:101–114. doi: 10.1159/000332580. [DOI] [PubMed] [Google Scholar]
- Castaneda-Bueno M, Cervantes-Perez LG, Vazquez N, Uribe N, Kantesaria S, Morla L, Bobadilla NA, Doucet A, Alessi DR, Gamba G. Activation of the renal Na+:Cl− cotransporter by angiotensin II is a WNK4-dependent process. Proc Natl Acad Sci U S A. 2012;109:7929–7934. doi: 10.1073/pnas.1200947109. [DOI] [PMC free article] [PubMed] [Google Scholar]
- Chen D, Coffman TM. The kidney and hypertension: lessons from mouse models. Can J Cardiol. 2012;28:305–310. doi: 10.1016/j.cjca.2012.01.002. [DOI] [PubMed] [Google Scholar]
- Chomczynski P, Sacchi N. Single-step method of RNA isolation by acid guanidinium thiocyanate-phenol-chloroform extraction. Anal Biochem. 1987;162:156–159. doi: 10.1006/abio.1987.9999. [DOI] [PubMed] [Google Scholar]
- Coruzzi P, Brambilla L, Brambilla V, Gualerzi M, Rossi M, Parati G, Di RM, Tadonio J, Novarini A. Potassium depletion and salt sensitivity in essential hypertension. J Clin Endocrinol Metab. 2001;86:2857–2862. doi: 10.1210/jcem.86.6.7601. [DOI] [PubMed] [Google Scholar]
- Frindt G, Palmer LG. Effects of dietary K on cell-surface expression of renal ion channels and transporters. Am J Physiol Renal Physiol. 2010;299:F890–F897. doi: 10.1152/ajprenal.00323.2010. [DOI] [PMC free article] [PubMed] [Google Scholar]
- Hoorn EJ, Nelson JH, McCormick JA, Ellison DH. The WNK kinase network regulating sodium, potassium, and blood pressure. J Am Soc Nephrol. 2011;22:605–614. doi: 10.1681/ASN.2010080827. [DOI] [PMC free article] [PubMed] [Google Scholar]
- Huang CL, Kuo E. Mechanisms of disease: WNK-ing at the mechanism of salt-sensitive hypertension. Nat Clin Pract Nephrol. 2007;3:623–630. doi: 10.1038/ncpneph0638. [DOI] [PubMed] [Google Scholar]
- Krishna GG, Miller E, Kapoor S. Increased blood pressure during potassium depletion in normotensive men. N Engl J Med. 1989;320:1177–1182. doi: 10.1056/NEJM198905043201804. [DOI] [PubMed] [Google Scholar]
- Lifton RP. Molecular genetics of human blood pressure variation. Science. 1996;272:676–680. doi: 10.1126/science.272.5262.676. [DOI] [PubMed] [Google Scholar]
- Loffing J, Zecevic M, Feraille E, Kaissling B, Asher C, Rossier BC, Firestone GL, Pearce D, Verrey F. Aldosterone induces rapid apical translocation of ENaC in early portion of renal collecting system: possible role of SGK. Am J Physiol Renal Physiol. 2001;280:F675–F682. doi: 10.1152/ajprenal.2001.280.4.F675. [DOI] [PubMed] [Google Scholar]
- McCormick JA, Mutig K, Nelson JH, Saritas T, Hoorn EJ, Yang CL, Rogers S, Curry J, Delpire E, Bachmann S, Ellison DH. A SPAK isoform switch modulates renal salt transport and blood pressure. Cell Metab. 2011;14:352–364. doi: 10.1016/j.cmet.2011.07.009. [DOI] [PMC free article] [PubMed] [Google Scholar]
- Morris RC, Jr, Sebastian A, Forman A, Tanaka M, Schmidlin O. Normotensive salt sensitivity: effects of race and dietary potassium. Hypertension. 1999;33:18–23. doi: 10.1161/01.hyp.33.1.18. [DOI] [PubMed] [Google Scholar]
- Naito S, Ohta A, Sohara E, Ohta E, Rai T, Sasaki S, Uchida S. Regulation of WNK1 kinase by extracellular potassium. Clin Exp Nephrol. 2011;15:195–202. doi: 10.1007/s10157-010-0378-9. [DOI] [PubMed] [Google Scholar]
- Naray-Fejes-Toth A, Snyder PM, Fejes-Toth G. The kidney-specific WNK1 isoform is induced by aldosterone and stimulates epithelial sodium channel-mediated Na+ transport. Proc Natl Acad Sci U S A. 2004;101:17434–17439. doi: 10.1073/pnas.0408146101. [DOI] [PMC free article] [PubMed] [Google Scholar]
- Nguyen MT, Yang LE, Fletcher NK, Lee DH, Kocinsky HS, Bachmann S, Delpire E, McDonough AA. Effects of K+-deficient diets with and without NaCl supplementation on Na+, K+, and H2O transporters’ abundance along the nephron. Am J Physiol Renal Physiol. 2012;303:F92–F104. doi: 10.1152/ajprenal.00032.2012. [DOI] [PMC free article] [PubMed] [Google Scholar]
- O'Reilly M, Marshall E, Macgillivray T, Mittal M, Xue W, Kenyon CJ, Brown RW. Dietary electrolyte-driven responses in the renal WNK kinase pathway in vivo. J Am Soc Nephrol. 2006;17:2402–2413. doi: 10.1681/ASN.2005111197. [DOI] [PubMed] [Google Scholar]
- Ohta A, Rai T, Yui N, Chiga M, Yang SS, Lin SH, Sohara E, Sasaki S, Uchida S. Targeted disruption of the Wnk4 gene decreases phosphorylation of Na-Cl cotransporter, increases Na excretion and lowers blood pressure. Hum Mol Genet. 2009;18:3978–3986. doi: 10.1093/hmg/ddp344. [DOI] [PubMed] [Google Scholar]
- Rafiqi FH, Zuber AM, Glover M, Richardson C, Fleming S, Jovanovic S, Jovanovic A, O'Shaughnessy KM, Alessi DR. Role of the WNK-activated SPAK kinase in regulating blood pressure. EMBO Mol Med. 2010;2:63–75. doi: 10.1002/emmm.200900058. [DOI] [PMC free article] [PubMed] [Google Scholar]
- Rodan AR, Cheng CJ, Huang CL. Recent advances in distal tubular potassium handling. Am J Physiol Renal Physiol. 2011;300:F821–F827. doi: 10.1152/ajprenal.00742.2010. [DOI] [PMC free article] [PubMed] [Google Scholar]
- Romero-Calvo I, Ocon B, Martinez-Moya P, Suarez MD, Zarzuelo A, Martinez-Augustin O, de Medina FS. Reversible Ponceau staining as a loading control alternative to actin in Western blots. Anal Biochem. 2010;401:318–320. doi: 10.1016/j.ab.2010.02.036. [DOI] [PubMed] [Google Scholar]
- San-Cristobal P, Pacheco-Alvarez D, Richardson C, Ring AM, Vazquez N, Rafiqi FH, Chari D, Kahle KT, Leng Q, Bobadilla NA, Hebert SC, Alessi DR, Lifton RP, Gamba G. Angiotensin II signalling increases activity of the renal Na-Cl cotransporter through a WNK4–SPAK-dependent pathway. Proc Natl Acad Sci U S A. 2009;106:4384–4389. doi: 10.1073/pnas.0813238106. [DOI] [PMC free article] [PubMed] [Google Scholar]
- Schafer JA, Watkins ML, Li L, Herter P, Haxelmans S, Schlatter E. A simplified method for isolation of large numbers of defined nephron segments. Am J Physiol Renal Physiol. 1997;273:F650–F657. doi: 10.1152/ajprenal.1997.273.4.F650. [DOI] [PubMed] [Google Scholar]
- Shigaev A, Asher C, Latter H, Garty H, Reuveny E. Regulation of sgk by aldosterone and its effects on the epithelial Na+ channel. Am J Physiol Renal Physiol. 2000;278:F613–F619. doi: 10.1152/ajprenal.2000.278.4.F613. [DOI] [PubMed] [Google Scholar]
- Sorensen MV, Grossmann S, Roesinger M, Gresko N, Todkar AP, Barmettler G, Ziegler U, Odermatt A, Loffing-Cueni D, Loffing J. Rapid dephosphorylation of the renal sodium chloride cotransporter in response to oral potassium intake in mice. Kidney Int. 2013;83:811–824. doi: 10.1038/ki.2013.14. [DOI] [PubMed] [Google Scholar]
- Spat A, Hunyady L. Control of aldosterone secretion: a model for convergence in cellular signalling pathways. Physiol Rev. 2004;84:489–539. doi: 10.1152/physrev.00030.2003. [DOI] [PubMed] [Google Scholar]
- Vallon V, Schroth J, Lang F, Kuhl D, Uchida S. Expression and phosphorylation of the Na+-Cl− cotransporter NCC in vivo is regulated by dietary salt, potassium, and SGK1. Am J Physiol Renal Physiol. 2009;297:F704–F712. doi: 10.1152/ajprenal.00030.2009. [DOI] [PMC free article] [PubMed] [Google Scholar]
- van der Lubbe N, Lim CH, Fenton RA, Meima ME, Jan Danser AH, Zietse R, Hoorn EJ. Angiotensin II induces phosphorylation of the thiazide-sensitive sodium chloride cotransporter independent of aldosterone. Kidney Int. 2011;79:66–76. doi: 10.1038/ki.2010.290. [DOI] [PubMed] [Google Scholar]
- van der Lubbe N, Lim CH, Meima ME, van Veghel R, Rosenbaek LL, Mutig K, Danser AH, Fenton RA, Zietse R, Hoorn EJ. Aldosterone does not require angiotensin II to activate NCC through a WNK4–SPAK-dependent pathway. Pflugers Arch. 2012;463:853–863. doi: 10.1007/s00424-012-1104-0. [DOI] [PMC free article] [PubMed] [Google Scholar]
- van der Lubbe N, Zietse R, Hoorn EJ. Effects of angiotensin II on kinase-mediated sodium and potassium transport in the distal nephron. Curr Opin Nephrol Hypertens. 2013;22:120–126. doi: 10.1097/MNH.0b013e32835b6551. [DOI] [PubMed] [Google Scholar]
- Vitzthum H, Abt I, Einhellig S, Kurtz A. Gene expression of prostanoid forming enzymes along the rat nephron. Kidney Int. 2002;62:1570–1581. doi: 10.1046/j.1523-1755.2002.00615.x. [DOI] [PubMed] [Google Scholar]
- Wade JB, Fang L, Liu J, Li D, Yang CL, Subramanya AR, Maouyo D, Mason A, Ellison DH, Welling PA. WNK1 kinase isoform switch regulates renal potassium excretion. Proc Natl Acad Sci U S A. 2006;103:8558–8563. doi: 10.1073/pnas.0603109103. [DOI] [PMC free article] [PubMed] [Google Scholar]
- Welling PA, Chang YP, Delpire E, Wade JB. Multigene kinase network, kidney transport, and salt in essential hypertension. Kidney Int. 2010;77:1063–1069. doi: 10.1038/ki.2010.103. [DOI] [PMC free article] [PubMed] [Google Scholar]
- Yang SS, Lo YF, Wu CC, Lin SW, Yeh CJ, Chu P, Sytwu HK, Uchida S, Sasaki S, Lin SH. SPAK-knockout mice manifest Gitelman syndrome and impaired vasoconstriction. J Am Soc Nephrol. 2010;21:1868–1877. doi: 10.1681/ASN.2009121295. [DOI] [PMC free article] [PubMed] [Google Scholar]