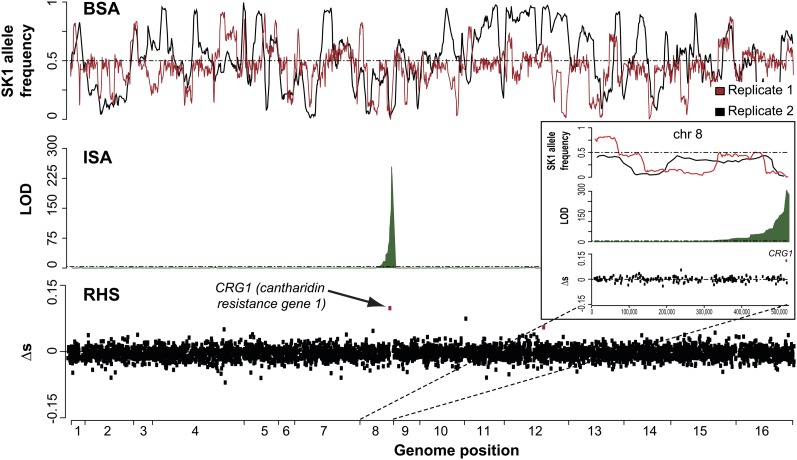
Figure 2.
Cantharidin resistance QTL mapped by BSA, ISA, and RHS. The top LOD score identified by ISA is located directly at the causal CRG1 gene, which was also the top hit in RHS (bottom plot). For BSA, the SK1 allele frequency (1 corresponding to 100% SK1, 0 to 100% S96) is plotted for two biological replicates. These replicates were not reproducible overall (likely due to spontaneous beneficial mutations in individual cells of the pool, as seen for 5-FU treatment), except for very few regions (including the CRG1 locus). The results on chr 8, which contains CRG1, are magnified (inset). For RHS, ∆s represents the difference between the selection coefficients of S96 and SK1.

