

Abstract
Obesity is a growing epidemic with limited effective treatments. The neurotrophic factor glial cell line-derived neurotrophic factor (GDNF) was recently shown to enhance β-cell mass and improve glucose control in rodents. Its role in obesity is, however, not well characterized. In this study, we investigated the ability of GDNF to protect against high-fat diet (HFD)-induced obesity. GDNF transgenic (Tg) mice that overexpress GDNF under the control of the glial fibrillary acidic protein promoter and wild-type (WT) littermates were maintained on a HFD or regular rodent diet for 11 wk, and weight gain, energy expenditure, and insulin sensitivity were monitored. Differentiated mouse brown adipocytes and 3T3-L1 white adipocytes were used to study the effects of GDNF in vitro. Tg mice resisted the HFD-induced weight gain, insulin resistance, dyslipidemia, hyperleptinemia, and hepatic steatosis seen in WT mice despite similar food intake and activity levels. They exhibited significantly (P < 0.001) higher energy expenditure than WT mice and increased expression in skeletal muscle and brown adipose tissue of peroxisome proliferator activated receptor-α and β1- and β3-adrenergic receptor genes, which are associated with increased lipolysis and enhanced lipid β-oxidation. In vitro, GDNF enhanced β-adrenergic-mediated cAMP release in brown adipocytes and suppressed lipid accumulation in differentiated 3T3L-1 cells through a p38MAPK signaling pathway. Our studies demonstrate a novel role for GDNF in the regulation of high-fat diet-induced obesity through increased energy expenditure. They show that GDNF and its receptor agonists may be potential targets for the treatment or prevention of obesity.
Keywords: hepatic steatosis, energy expenditure, β-adrenergic signaling, beta-oxidation, neurotrophic
energy homeostasis is a tightly regulated process that relies on a complex network of signals acting on the gut, brain, liver, skeletal muscles, and adipose tissue to regulate food intake and energy expenditure (23, 24). Disruption of this homeostatic balance due to excessive caloric intake or reduced energy expenditure can lead to obesity, which together with the associated metabolic syndrome is a major health problem and a significant cause of morbidity and mortality worldwide (11, 15, 17).
Glial cell line-derived neurotrophic factor (GDNF) belongs to the GDNF family of neurotrophic factors that share similarities with transforming growth factor-β. It signals through a multicomponent receptor consisting of the Ret receptor that it shares with other GDNF family members, and a specific coreceptor, GDNF family receptor α1 (GFRα1), to activate the PI3K/Akt and MAPK signaling pathways (2). GDNF is required for enteric neuron development as well as the survival of enteric, midbrain catecholaminergic, motor, sensory, sympathetic, and parasympathetic neurons (22, 25, 27). GDNF and its receptors are expressed abundantly in tissues including the hypothalamus that are critical in energy homeostasis (27). Recent studies have shown that chronic hypothalamic or nigrostriatal expression of GDNF in rodents and primates can induce weight loss in animals with age-related obesity and prevent weight gain in young animals (20, 21, 38). There are, however, no reports on the efficacy of GDNF in preventing diet-induced obesity and the associated metabolic syndrome. We previously reported on a transgenic (Tg) mouse with glial fibrillary acidic protein promoter-driven GDNF overexpression that has a larger β-cell mass and improved glucose control than WT littermates (26). In this study we used this Tg mouse to study the effects of GDNF on weight gain and insulin sensitivity induced by a high-fat diet. We demonstrate a novel role for GDNF in the protection against diet-induced obesity through enhanced energy expenditure and increased expression of genes that promote lipolysis and energy expenditure in brown adipose tissue (BAT), white adipose tissue (WAT), and skeletal muscle.
METHODS
Animals.
Animal studies were conducted with GDNF Tg mice (on a CF-1 background) and CF-1 wild-type (WT) littermates. The generation of the Tg mice has been previously described (41). The mice were used at 5–6 wk of age. All animal studies were approved by the Atlanta Veterans Affairs Medical Center Institutional Animal Care and Use Committee. The mice were maintained on a regular laboratory rodent diet (RD) (2018SX; Teklad Global 18% Protein Extruded Rodent Diet, Harlan Laboratories, Madison, WI) containing 6.2% fat by weight or a high-fat diet (HFD) (TD.06414, Harlan) containing 34.3% fat by weight. The mice were maintained on a 12-h light-dark cycle in a temperature-controlled barrier facility with free access to food and water. The composition of the diets is shown in Table 1. Pair feeding was performed as previously described (33).
Table 1.
Rodent diet composition
| Diet | % kcal from Protein | % kcal from Carbohydrates | % kcal from Fat | Fat % by weight | kcal/g | Additional Information |
|---|---|---|---|---|---|---|
| 2018SX | 24 | 58 | 18 | 6 | 3.1 | Standard grain-based diet |
| TD.06414 | 18.4 | 21.3 | 60.3 | 34.3 | 5.1 | Contains fat from lard of which 37% is saturated, 47% monounsaturated, and 16% polyunsaturated |
Diet 2018X is the regular diet and TD.06414 is the high-fat diet.
Glucose and insulin tolerance tests.
Glucose tolerance testing was performed 10 wk after the start of the study. Following an overnight fast, the mice were injected intraperitoneally with glucose (3 g/kg body wt) in sterile PBS. Blood glucose levels were measured with an Accu-Check Advantage blood glucose meter (Roche, Mannheim, Germany) using tail blood. For insulin tolerance testing, the mice were fasted for 6 h before being given an intraperitoneal injection of 1 U/kg human rapid insulin (Eli Lilly, Indianapolis, IN).
Cell culture.
Brown adipocytes were a gift from Dr. Yu-Hua Tseng (Joslin Diabetes Center, Harvard Medical School, Boston, MA), and were maintained as previously described (37). Differentiation of brown adipocytes was induced by culturing confluent cells in medium supplemented with 20 nM insulin (Sigma Aldrich, St. Louis, MO), 1 nM triiodothyronine (T3) (Sigma), 0.5 mM isobutylmethylxanthine (IBMX) (Sigma Aldrich), 5 μM dexamethasone (Sigma Aldrich), and 0.125 mM indomethacin (Sigma Aldrich). After culture for 48 h in this medium, the cells were transferred back to the culture medium supplemented with insulin and T3. The medium was changed every 2 days. The 3T3-L1 cell line (14) was purchased from American Type Culture Collection (ATCC, Manassas, VA) and cultured in Dulbecco's modified Eagle's medium (ATCC) according to recommended procedure. Recombinant rat GDNF used in this study was produced as previously described (9). The p38 MAPK inhibitor SB 203580 (Sigma-Aldrich) was used at a final concentration of 10 μM. Transfection of cells was performed according to recommended procedure using custom control and Ret Stealth Select RNAi siRNA (MSS208607, Invitrogen Life Technologies, Grand Island, NY) and Lipofectamine RNAiMax (Invitrogen). Cyclic AMP release was assessed in differentiated brown adipocytes cultured for 24 h in medium supplemented with or without 100 ng GDNF/ml and stimulated for 1 h with 1 μM isoproterenol (Sigma Aldrich). cAMP levels were measured with the Parameter cAMP Assay kit (R&D Systems, Minneapolis, MN).
Histology and Oil Red O staining.
Mice liver and adipose tissues were frozen in Tissue-Tek OCT compound (Sakura Finetek, Torrance, CA), and sections (5 μm thick) were made by using a common protocol. Oil Red O and hematoxylin and eosin staining were performed as previously described (37).
Immunohistochemistry.
Paraffin sections of human and mouse white adipose tissue were blocked in PBS containing 3% BSA and 0.02% Triton X-100 and then incubated with human c-Ret (R787), GDNF (D-20), GFRα1 (H-70), and S-100β (BD Pharmingen, San Diego, CA) antibodies (1:200) overnight at 4°C. Secondary detection was performed by incubation with Anti-Rb IgG (1:500) conjugated to Alexa Fluor 488 and 594 antibodies (Molecular Probes, Eugene, OR).
Serum chemistry and liver triglycerides analyses.
Blood was collected into serum separator tubes (BD, Franklin Lakes, NJ) and serum separated by centrifugation at 3,000 g for 15 min at room temperature. Serum cholesterol and triglyceride levels were analyzed on a Beckman Coulter AU 480 Chemistry Analyzer equipped with Beckman Coulter cholesterol and triglyceride system reagents (Beckman Coulter, Brea, CA). Serum leptin levels were determined by use of a mouse leptin ELISA kit (Millipore, St. Charles, MO). Liver triglyceride levels were measured with the Biovision Triglyceride Assay kit (Biovision, Mountain View, CA).
Metabolic measurements.
Metabolic and activity measurements were performed by using the Oxymax Comprehensive Lab Animal Monitoring System equipped with an Opto-M3 Activity Monitor (Columbus Instruments, Columbus, OH) (37). Mice were individually housed in the chamber with a 12-h light:12-h dark cycle in an ambient temperature of 22–24°C. The mice were acclimated to the instrument for at least 12 h before measuring metabolic performance.
Western blotting.
Western blotting was performed as previously described (25) by using rabbit antibodies to phospho-Akt (Ser473), phospho p38 MAP kinase (Thr180/Tyr182), GAPDH (D16H11), and Cox IV from Cell Signaling Technologies (Danvers, MA); human c-Ret (R787) from Immuno-Biological Laboratories (Takasaki-shi, Gunma, Japan); and GDNF (D-20) and GFRα1 (H-70) from Santa Cruz Biotechnology (Santa Cruz, CA) diluted 1:1,000. Mouse monoclonal antibody to β-actin (A5441, clone AC-15) from Sigma-Aldrich was diluted 1:5,000. Horseradish peroxidase-conjugated anti-mouse and anti-rabbit IgG (Cell Signaling Technologies) secondary antibodies were used at 1:2,000 dilution. A semiquantitative measurement of band density was performed by using Scion Image for Windows software.
PCR.
Total RNA was isolated using the RNeasy Lipid Tissue and RNeasy Mini kits (Qiagen, Hilden, Germany) and first-strand cDNA synthesized with SuperScript VILO (Invitrogen, Carlsbad, CA). Real-time PCR reactions were set up by using FastStart Universal SYBR Green Master Mix (Roche Applied Science, Mannheim, Germany) and thermal cycling performed on a StepOnePlus Real-Time PCR System (Applied Biosystems, Foster City, CA). The sequences of the oligonucleotide primers used are presented in Table 2. All primers were designed such that at least one primer in each pair spanned an intron to prevent it from priming on genomic DNA. The inability of these primers to amplify genomic DNA was confirmed by PCR. GAPDH was used as an endogenous control.
Table 2.
Sequence of oligonucleotide primers used
| Oligo Name | Oligo Sequence | Tm, °C | Product Size, bp | Gene Accession No. |
|---|---|---|---|---|
| PGC1α_FW | CAACCGCAGTCGCAACATGCT | 58.88 | 90 | NM_008904.2 |
| PGC1α_RV | TGGGGAACCCTTGGGGTCATTTG | 58.73 | ||
| PPARγ_FW | CTGTGGGGATGTCTCACAATGCCAT | 59.03 | 110 | NM_001127330.1 |
| PPARγ_RV | AGACTCTGGGTTCAGCTGGTCGAT | 59.16 | ||
| PPARα_FW | GAAAGACCAGCAACAACCCGCCTT | 60.12 | 146 | NM_011144.6 |
| PPARα_RV | CATGCACTGGCAGCAGTGGAAGAA | 59.94 | ||
| Leptin_FW | CTCCAGCAGCTGCAAGGTGCAA | 60.18 | 87 | NM_008493.3 |
| Leptin_RV | ACCAAAGCCACAGGAACCGACAC | 59.57 | ||
| Srebf1_FW1 | GGTGGGCACTGAAGCAAAGCTGAA | 60.12 | 80 | NM_011480.3 |
| Srebf1_RV1 | TGCTGTGCTGCAAGAAGCGGAT | 59.67 | ||
| Cd36_FW | ACGCAGCCTCCTTTCCACCTTT | 58.69 | 90 | NM_001159558.1 |
| Cd36_RV | CGAACACAGCGTAGATAGACCTGCA | 58.68 | ||
| PRDM16_FW1 | TTTGACCATACCCGGAGGTGTGTTG | 58.92 | 116 | NM_027504.3 |
| PRDM16_RV1 | TCAAATGCTTCCTCAGCTGCTCTGC | 59.79 | ||
| GDNF_FW | AGT TAT GGG ATG TCG TGG CTG T | 55.76 | 189 | NM_010275.2 |
| GDNF_RV | TGA CGT CAT CAA ACT GGT CAG G | 54.7 | ||
| FASN_FW1 | AGCTGCAACTGTGCAAGGGTCTG | 57.79 | 143 | NM_007988.3 |
| FASN_RV1 | TTGCCCAAGCATTGCCGCCTT | 58.58 | ||
| UCP1_FW1 | TGCCAAAGTCCGCCTTCAGATCCA | 60.41 | 152 | NM_009463.3 |
| UCP1_RV1 | TGATTTGCCTCTGAATGCCCGCAG | 60.06 | ||
| FABP4_FW | TGGTGACAAGCTGGTGGTGGAATG | 59.35 | 90 | NM_024406.2 |
| FABP4_RV | TCCAGGCCTCTTCCTTTGGCTCA | 59.55 | ||
| GFRα1 FW | ATG AAG AAC GAG AGA GGC CCA A | 55.43 | 108 | NM_010279.2 |
| GFRα1 RV | ACT CTG GCT GGC AGT TGG TAA A | 56.14 | ||
| Ret_FW | ACGGCTGCATGAGAATGACTGGAT | 58.52 | 148 | NM_009050.2 |
| Ret_RV | CAGAAAGACCTGGAGGAAGATGGTGA | 57.79 | ||
| GLUT4 FW | GTTGGTCTCGGTGCTCTTAG | 58.00 | 138 | NM_009204.2 |
| GLUT4 RV | ACATAGCTCATGGCTGGAAC | 57.66 | ||
| Sirt1_FW1 | ACCTTGGAGCAGGTTGCAGGAA | 58.35 | 144 | NM_019812.2 |
| Sirt1_RV1 | AGGGCACCGAGGAACTACCTGATT | 59.15 | ||
| Adrb1_FW1 | TGGCGCTCATCGTTCTGCTCAT | 58.97 | 148 | NM_007419.2 |
| Adrb1_RV1 | AAAGGCACCACCAGCAATCCCA | 58.93 | ||
| Cycs_FW | TGTTGACCAGCCCGGAACGAAT | 58.77 | 83 | NM_007808.4 |
| Cycs_RV | TGGCACTGGGCACACTTCTGAA | 58.62 | ||
| Adrb3_FW1 | AACAGCAGACAGGGACAGAGGGGTT | 61.28 | 126 | NM_013462.3 |
| Adrb3_RV1 | TCTGGTGGGAATTGGAGGGTGGAGA | 60.58 | ||
| GAPDH_FW | TTGTGATGGGTGTGAACCACGA | 56.44 | 168 | NM_008084.2 |
| GAPDH_RV | TCTTCT GGG TGG CAG TGA TGG | 56.11 | ||
| α7nAChR FW | TTCCGTGCCCTTGATAGCACAGT | 58.32 | 169 | NM_007390.3 |
| α7nAChR RV | GCGCAGAAACCATGCACACCAA | 59.11 |
FW, upstream (sense) primer; RV, downstream (antisense) primer.
Statistical analysis.
Linear regression, one-way ANOVA, t-test, and area under the curve (AUC) analyses were performed by use of GraphPad Prism version 3.00 for Windows (GraphPad Software, San Diego, CA).
RESULTS
GDNF Tg mice are protected against high-fat diet-induced obesity.
The Tg mice used in this study have previously been shown to overexpress GDNF in glial cells throughout the central and enteric nervous systems (39, 41). We examined whether GDNF was also overexpressed in other tissues involved in the control of energy metabolism in these mice. We found GDNF to also be overexpressed in the WAT, the BAT and liver, but not skeletal muscle (Fig. 1, A–D). We also determined whether the expressed GDNF was released into the circulation and did not observe any detectable levels in the serum (data not shown). We examined the cellular location of GDNF expression in human and mouse WAT and found GDNF expression to be limited mainly to glial cells (Fig. 1C). We also analyzed the expression of the receptors for GDNF and found the GFRα1 and Ret receptors to be expressed in all the tissues in which GDNF was expressed (Fig. 1, E–G).
Fig. 1.
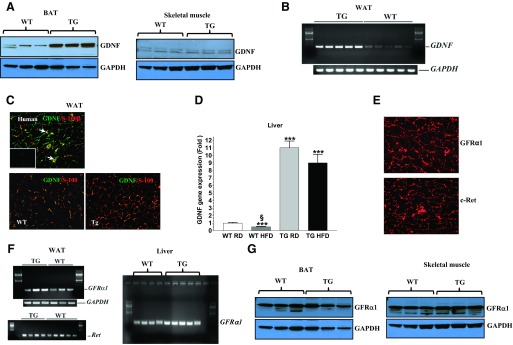
Analyses of tissue expression of glial cell line-derived neurotrophic factor (GDNF), and GFRα1 and Ret receptors. A: Western blot analyses of GDNF levels in brown adipose tissue (BAT) and skeletal muscle from wild-type (WT) and GDNF transgenic mice (Tg) mice. B: analysis by RT-PCR of GDNF gene expression in white adipose tissue (WAT) from WT and Tg mice. C: immunofluorescence staining for GDNF (green) and the glial cell marker S-100β (red) in human WAT (top) and WAT from WT and Tg mice (bottom). Arrows depict GDNF-expressing glial cells. Inset (top) shows negative control. Scale bar, 50 μm. D: real-time PCR comparison of GDNF gene expression in liver from WT and Tg mice. Plotted are means + SE. ***P < 0.001, relative to WT mice maintained on the regular diet (RD). §P < 0.001, relative to Tg mice maintained on the high-fat diet (HFD); n = 5–7 mice per group. E: immunofluorescence staining for Ret (c-Ret) and GFRα1 receptors in human WAT. Scale bar, 50 μm. F: RT-PCR analyses of GFRα1 and Ret receptor gene expression in the WAT and GFRα1 receptor gene expression in liver from WT and Tg mice. G: Western blot analyses of GFRα1 receptor expression in the BAT and skeletal muscle from WT and Tg mice.
To investigate the effects of GDNF overexpression on diet-induced obesity, Tg mice and WT littermates were maintained on a RD or a HFD and body weights were monitored weekly. WT mice maintained on the HFD gained weight faster than WT mice maintained on the RD (Fig. 2A). As a result, although WT maintained on the RD gained only 30.5 ± 2.8% more weight over an 11 wk period, WT mice maintained on the HFD gained 80.3 ± 4.8% more weight over the same period. In contrast, Tg mice maintained on the HFD had a weight gain of 42.1 ± 9.4% over the same period, which was not different from the weight gain by Tg mice maintained on the RD (33.6 ± 3.9%). Linear regression analyses of body weight gain curves showed no significant differences between the Tg groups and WT mice maintained on the RD (Fig. 2B). Consistent with their low weight gains, Tg mice maintained on the HFD, as well as Tg and WT mice maintained on the RD, had significantly (P < 0.001) less fat mass and smaller retroperitoneal WAT adipocytes than WT mice maintained on the HFD (Fig. 2, C–E). They also had lower serum leptin, triglycerides, and cholesterol levels than WT mice maintained on the HFD (Fig. 2, F and G). Both groups of mice maintained on the HFD, however, had similar higher serum HDL, LDL, and nonesterified fatty acid levels than the control groups (Fig. 2G). Similar to Tg and WT mice maintained on the RD, Tg mice maintained on the HFD also had lower expression in the WAT of obesity-associated genes, including the leptin, peroxisome proliferator activated receptor-γ (PPARγ) and CD36 (fatty acid translocase) genes, than WT mice maintained on the HFD (Fig. 2H).
Fig. 2.
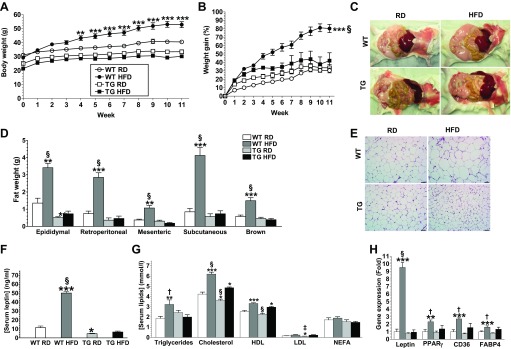
GDNF Tg mice are protected against high-fat diet-induced obesity. Body weight (A) and weight gain curves (B) for WT and Tg mice maintained on a RD or HFD for 11 wk. Representative images showing intra-abdominal fat deposits (C), adipose tissue weights (D), and hematoxylin and eosin-stained retroperitoneal WAT (E) from WT and Tg mice. Scale bar, 50 μm. F: serum leptin levels. G: serum triglycerides, cholesterol, HDL, LDL, and nonesterified fatty acids (NEFA) levels. H: real-time PCR analyses of expression of lipogenic genes in WAT from WT and Tg mice maintained on a RD or HFD. Plotted are means + SE. *P < 0.5; **P < 0.01; ***P < 0.001, relative to WT mice maintained on the RD. †P < 0.05; ‡P < 0.01; §P < 0.001, relative to Tg mice maintained on the HFD; n = 5–7 mice per group.
GDNF Tg mice are protected against high-fat diet-induced hepatic steatosis.
Tg mice maintained on the HFD had liver that weighed less, although WT mice maintained on the HFD had liver that weighed more, than liver from mice from the other groups (Fig. 3A). Tg mice maintained on the HFD also had low serum alanine aminotransferase (ALT) levels similar to WT and Tg mice maintained on the RD (Fig. 3B). In contrast, WT mice maintained on the HFD had significantly (P < 0.001) elevated serum ALT levels suggestive of hepatic steatosis (Fig. 3B). Hematoxylin and eosin staining revealed extensive hepatocyte ballooning in liver from WT mice maintained on the HFD and little to no ballooning in liver from mice from the other groups (Fig. 3C). Oil Red O staining of liver sections revealed very little triglyceride deposition in liver from both groups of Tg mice and WT mice maintained on the RD, but extensive triglyceride deposition in liver from WT mice maintained on the HFD (Fig. 3D). Assessment of total liver triglyceride levels showed that Tg mice maintained on the HFD had slightly (P < 0.05) higher levels than Tg mice maintained on the RD, but significantly lower levels than both groups of WT mice (Fig. 3E). WT mice maintained on the HFD, on the other hand, had significantly higher triglyceride levels than mice from the other groups (Fig. 3E).
Fig. 3.

GDNF Tg mice are protected against high-fat diet-induced hepatic steatosis. Liver weights (A) and serum alanine aminotransferase (ALT) levels (B) for WT and Tg mice maintained on the RD or HFD diet for 11 wk. Representative images of liver sections stained with hematoxylin and eosin (C) and Oil Red O (D). E: liver triglyceride levels. Scale bar, 50 μm. Plotted are means + SE. *P < 0.5; **P < 0.01; ***P < 0.001, relative to WT mice maintained on the RD. †P < 0.05; ‡P < 0.01; §P < 0.001, relative to Tg mice maintained on the HFD; n = 5–7 mice per group.
GDNF Tg mice resist high-fat diet-induced glucose intolerance and insulin resistance.
Obesity is frequently associated with insulin resistance, which is characterized by high fasting blood glucose levels, glucose intolerance, and reduced insulin sensitivity. To examine whether Tg mice were protected against HFD-induced insulin resistance we performed glucose tolerance and insulin sensitivity tests in overnight-fasted mice 10 wk after the start of the diets. Consistent with our previous observations (26), Tg mice maintained on the RD had significantly (P < 0.001) lower baseline fasting blood glucose levels than WT littermates maintained on the RD (Tg RD, 4.33 ± 0.26 mmol/l; WT RD, 6.65 ± 0.32 mmol/l) (Fig. 4A). Tg mice maintained on the HFD, on the other hand, had baseline fasting blood glucose levels that were slightly higher than those of Tg mice maintained on the RD, but similar to those of WT mice maintained on the RD (Fig. 4A). In contrast, WT mice maintained on the HFD had significantly higher baseline fasting blood glucose levels than mice from the other groups (Fig. 4A). Tg mice maintained on the HFD had glucose AUCs that were not significantly different from those of Tg and WT mice maintained on the RD, although WT mice maintained on the HFD had AUCs that were significantly (P < 0.01) higher than those of mice from the other groups following glucose tolerance testing (Fig. 4, B and C). We also assessed the levels of expression in the epididymal WAT of the solute carrier family 2 (facilitated glucose transporter) member 4 (GLUT4) gene. These analyses revealed similar higher expression of this gene in the WAT in both groups of Tg mice, but significantly (P < 0.001) reduced expression in the WT mice maintained on the HFD (Fig. 4D).
Fig. 4.
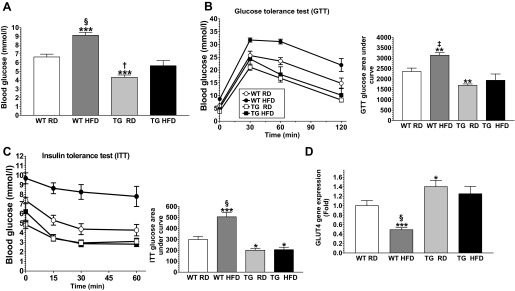
GDNF Tg mice resist high-fat diet-induced glucose intolerance and insulin resistance. Fasting blood glucose (A), glucose tolerance test (GTT) and GTT glucose area under the curve (B), and insulin tolerance test (ITT) and ITT glucose area under the curve (C) for WT and Tg mice maintained on the RD or HFD for 10 wk. D: analysis of GLUT4 gene expression in WAT from WT and Tg mice maintained on the RD or HFD diet for 11 wk. Plotted are means + SE. *P < 0.5; **P < 0.01; ***P < 0.001, relative to WT mice maintained on the RD. †P < 0.05; ‡P < 0.01; §P < 0.001, relative to Tg mice maintained on the HFD; n = 5–7 mice per group.
GDNF Tg mice have increased energy expenditure.
We compared food consumption between the two groups of mice fed the HFD to rule out any role for differences in appetite in the observed differences in weight gain. Although the WT mice daily consumed significantly (P < 0.001) more food than Tg mice, when food consumption was adjusted to body weights, no significant differences were observed between the two groups (Fig. 5A). Moreover, in pair-feeding experiments conducted over a 4-wk period, WT mice gained significantly (P < 0.01) more weight (24.41 ± 3.875%) than Tg mice even after daily consuming the same amount of food consumed by Tg mice (Fig. 5B). Energy expenditure was also monitored with a comprehensive laboratory animal monitoring system to further tease out the possible factors contributing to the observed differences in weight gain. Mice from the two Tg group had significantly (P < 0.001) higher energy expenditure than mice from the WT groups, although WT mice maintained on the HFD had significantly (P < 0.001) lower energy expenditure than mice from all the other groups (Fig. 5C). This was despite the fact that mice from all the groups had similar ambulatory activities (Fig. 5D).
Fig. 5.
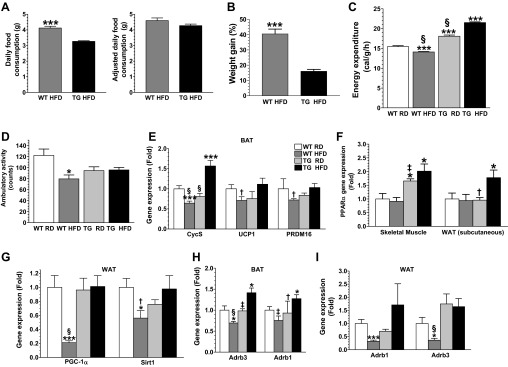
GDNF Tg mice have enhanced energy expenditure. A: daily food consumption and food consumption adjusted to body weight for Tg and WT mice fed the HFD ad libitum. B: plot of weight gains for Tg and WT mice pair-fed a HFD for 4 wk. C and D: energy expenditure (C) and ambulatory activity (D) for WT and Tg mice maintained on the RD or HFD for 10 wk. Analysis by real-time PCR of gene expression in BAT (E), skeletal muscle and WAT (F), and WAT (G) from Tg and WT mice maintained on the RD or HFD for 11 wk. Analyses of β1 (Adrb1)- and β3 (Adrb3)-adrenergic receptor gene expression in BAT (H) and epididymal WAT (I) from Tg and WT mice maintained on the RD or HFD for 11 wk. Plotted are means + SE. *P < 0.5; ***P < 0.001, relative to WT mice maintained on the RD. †P < 0.05; ‡P < 0.01; §P < 0.001, relative to Tg mice maintained on the HFD; n = 5–7 mice per group.
GDNF enhances the expression of genes associated with increased lipolysis and lipid β-oxidation.
To determine the transcriptional pathways associated with the higher energy expenditure seen in Tg mice, we compared expression levels in the BAT, skeletal muscle, and the WAT of genes associated with increased energy expenditure. The expression of the cytochrome c, somatic (Cycs) gene in the BAT was significantly (P < 0.001) reduced in WT mice maintained on the HFD, but increased in Tg mice maintained on the HFD (Fig. 5E). The expression in the BAT of the uncoupling protein 1 (UCP1) and the PRD1-BF-1-RIZ1 homologous domain containing protein-16 (PRDM16) genes was also significantly (P < 0.05) reduced in WT mice maintained on the HFD, but unchanged in Tg mice maintained on the HFD (Fig. 5E). The expression of the peroxisome proliferator activated receptor-α (PPARα) gene in skeletal muscle from both groups of Tg was more than double that seen in muscle from both groups of WT mice (Fig. 5F). The expression of PPARα gene in WAT was also significantly (P < 0.05) enhanced in Tg mice maintained on the HFD, but unchanged in WT mice maintained on the HFD (Fig. 5F). In addition, the expression in the WAT of the PPARγ coactivator-1α (PGC-1α) and sirtuin1 (SIRT1) genes was significantly reduced in WT mice maintained on the HFD, but unchanged in Tg mice maintained on the HFD (Fig. 5G).
The influence of GDNF on β-adrenergic signaling was also investigated. The expression in the BAT of the β1- and β3-adrenergic receptor (Adrb1 and Adrb3, respectively) genes was significantly increased in Tg mice maintained on the HFD, but decreased in WT mice maintained on the HFD (Fig. 5H). In addition, the expression in the WAT of these genes was also significantly decreased in WT mice maintained on the HFD, but unchanged in Tg mice (Fig. 5I).
GDNF suppresses the accumulation of triglycerides in 3T3-L1 adipocytes.
The effects of GDNF on triglyceride accumulation was also studied by use of 3T3-L1 adipocytes. 3T3-L1 cells express the Ret and GFRα1 receptors (Fig. 6A). 3T3-L1 cells differentiated for 7 days in medium supplemented with GDNF showed lower triglyceride accumulation than cells differentiated in medium without GDNF (Fig. 6B). This inhibitory effect of GDNF on triglyceride accumulation was, however, reversed when RET receptor expression was knocked down by use of a mouse RET siRNA (Fig. 6C). The efficacy of Ret receptor knockdown was confirmed by comparing Akt phosphorylation, which showed up to 35% reduction in Ret siRNA-transfected cells (Fig. 6C). The effect of GDNF on p38 mitogen-activated protein kinase (p38 MAPK) phosphorylation was assessed to determine whether the p38 MAPK signaling pathway plays any role in GDNF-mediated suppression of triglyceride accumulation. 3T3-L1 cells stimulated with GDNF had significantly (P < 0.01) higher phospho-p38 MAPK levels than non-GDNF-stimulated cells (Fig. 6D). The ability of GDNF to suppress triglyceride accumulation was then assessed in 3T3-L1 cells treated with the MAPK-specific inhibitor SB 203580. Analysis by Oil Red O staining showed reversal of GDNF's ability to suppress triglyceride accumulation (Fig. 6E). The effect of GDNF on the expression of lipogenic genes was also assessed. 3T3-L1 cells cultured in the presence of GDNF showed a dose-dependent decrease in the expression of PPARγ, FASN, sterol regulatory element binding transcription factor 1 (Srebf1), and fatty acid-binding protein (FABP4) genes and an increase in PGC-1α gene expression (Fig. 6, F and G).
Fig. 6.
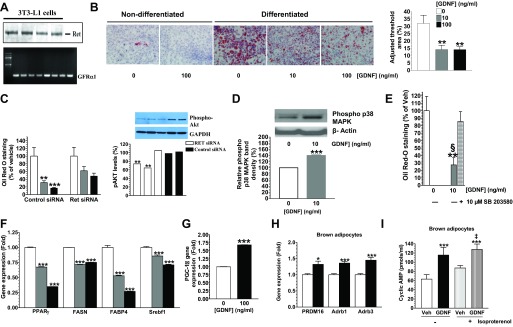
GDNF suppresses the accumulation of triglycerides in adipocytes in vitro. A: analysis of Ret receptor protein and GFRα1 receptor gene expression in 3T3-L1 adipocytes. B: Oil Red O-stained 3T3-L1 cells and densitometric analysis of staining intensity. Scale bar, 50 μm. C: analysis of effect of knockdown of the Ret receptor on triglyceride accumulation and Akt phosphorylation in differentiated 3T3-L1 cells. D: Western blot analysis of P38 MAPK phosphorylation in differentiated 3T3-L1 cells stimulated with GDNF. E: effects of the p38 MAPK inhibitor SB 203580 on GDNF-mediated suppression of triglyceride accumulation in differentiated 3T3-L1 cells. F: analyses of PPARγ, FASN, Srebf1 and FABP4 gene expression in differentiated 3T3-L1 cells cultured in the presence or absence of GDNF. G: analysis of PGC-1α gene expression in 3T3-L1 adipocytes differentiated in the presence or absence of GDNF. Plotted are means + SE. **P < 0.01, ***P < 0.001, relative to vehicle (Veh). §P < 0.001, relative to GDNF + SB 203580. H: PRDM16, Adrb1, and Adrb3 gene expression in differentiated brown adipocytes after 24-h culture in the presence or absence of GDNF. I: analysis of cyclic AMP release in differentiated brown adipocytes cultured in medium supplemented with or without GDNF and stimulated with isoproterenol. Plotted are means + SE. *P < 0.5; ***P < 0.001, relative to vehicle. ‡P < 0.01, relative to vehicle + isoproterenol.
GDNF enhances β-adrenergic receptor expression and signaling in brown adipocytes.
The effects of GDNF were also studied in isolated brown adipocytes cultured in medium supplemented with or without GDNF. GDNF enhanced the expression of the Adrb1 and Adrb3 genes as well as the brown adipocytes cell marker PRDM16 (Fig. 6H). In addition, GDNF enhanced isoproterenol-induced cAMP release in brown adipocytes (Fig. 6I).
DISCUSSION
Our study highlights an important role for GDNF in protecting against diet-induced obesity. Diet-induced obesity is the most prevalent form of obesity seen in adolescents and adults today. Using an in vivo model in which GDNF expression is increased in tissues involved in regulating energy metabolism we have demonstrated that GDNF can protect against HFD-induced weight gain by inducing increased energy expenditure.
Our studies have shown that Tg mice when maintained on a HFD resist weight gain and the consequent development of visceral fat, hepatic steatosis, and dyslipidemia. Consistent with the reduced central adiposity, Tg mice maintained on a HFD do not exhibit the increased expression in WAT of genes associated with increased obesity including leptin, PPARγ, and CD36 (3, 13, 18, 28) seen in WT mice maintained on the HFD. Our studies have also shown that Tg mice are protected against the manifestations of metabolic syndrome including insulin resistance. Tg mice maintained on the HFD resisted HFD-induced insulin resistance and exhibited increased expression of the GLUT4 gene. Elevated expression of this gene in the WAT is associated with improved insulin sensitivity whereas its downregulation has been suggested to contribute to the development of insulin resistance in obese and Type 2 diabetes patients (1, 32). Thus GDNF was able to induce insulin sensitization without the weight gain seen with insulin sensitizers such as the thiazolidinediones.
GDNF and its receptors are expressed in areas of the hypothalamus in rodents that are known to regulate food intake and energy expenditure (31, 36). Tg mice used in this study were shown in a previous study to overexpress GDNF in the hypothalamus (41). However, in our study, GDNF overexpression resulted in increased energy expenditure without the associated loss of appetite reported in previous studies with GDNF and other neurotrophic factors (20, 38, 40). Nevertheless, GDNF is known to be a survival factor for brain catecholaminergic neurons and sympathetic neurons (27). The sympathetic nervous system is a critical player in the regulation of energy metabolism and is a target of inhibition in many models of obesity leading to reduced mobilization of triglycerides for β-oxidation in the adipose tissue (7). Signals emanating from the sympathetic nervous system are mediated through β-adrenergic receptors including β1- and β3-adrenergic receptors, which are highly expressed on brown and white adipocytes (5, 34). Stimulation of these receptors by catecholamine-binding results in increased cAMP levels and the activation of protein kinase A and its downstream target hormone-sensitive lipase leading to increased lipolysis and expression of genes such as PPARα, and PGC-1α, and Sirt1 that promote fatty acid oxidation and energy release (6, 10, 12, 19, 29, 30). Loss or reduced expression of these receptors or their downstream targets can contribute to diet-induced obesity (4, 8, 16, 35). In our study, we observed increased expression in the BAT of the genes coding for the β1- and β3-adrenergic receptors in Tg mice maintained on the HFD, but significantly reduced expression in WT mice maintained on the HFD. The expression of these genes in the WAT was also significantly reduced in WT mice maintained on the HFD, but unchanged in Tg mice maintained on the HFD. We also observed increased expression of the genes coding for these receptors in brown adipocytes cultured in the presence of GDNF. In addition, Tg mice maintained on the HFD had higher expression of the PPARα gene in skeletal muscle and WAT. They also had higher expression of the Cycs and PGC-1α and Sirt1 genes, respectively, in the BAT and WAT than WT mice maintained on the HFD. GDNF also stimulated lipolysis in vitro in brown and white adipocytes through β-adrenergic-mediated signaling. Our study thus unveils a mechanism through which GDNF is able to enhance β-adrenergic signaling to induce lipolysis and lipid β-oxidation to protect against HFD-induced obesity.
On the basis of our data we therefore believe that the mechanism of GDNF regulation of obesity involves both peripheral and central mechanisms. Our findings suggest that GDNF promotes enhanced energy expenditure in brown fat by increasing brown adipocyte differentiation as and function evidenced by increased expression of the genes coding for PRDM16, CycS, and the β1- and β3-adrenergic receptors in vitro and in vivo and the ability of GDNF to stimulate increased cAMP release in brown adipocytes. In WAT there is increased expression of PPARα and PGC1-α, both genes known to increase mitochondrial β-oxidation and subsequent energy expenditure. Similarly, in skeletal muscle there is also increased expression of PPARα in the Tg mice. GDNF also reduced fat accumulation in WAT by reducing the gene expression of gene involved in adipogenesis such as PPARγ and fatty acid transport such as CD36 and FABP4. In vitro GDNF is able to suppress the genes related to fatty acid synthesis including Srebf1, PPAR-γ, FABP4, and FASN. As summarized in Fig. 7, we believe that GDNF is able to modulate both preadipocyte differentiation and mature adipocyte function to resist HFD-induced obesity in mice.
Fig. 7.

Potential mechanism of GDNF regulation of adiposity. White and brown adipocytes originate from different precursors. Differentiation of precursors committed to the white lineage is driven by a cascade of interactions involving several proteins including those encoded by the CCAAT/enhancer-binding proteins β (C/EBPβ), peroxisome proliferator-activated receptor-γ (PPARγ), C/EBPα, and sterol regulatory element binding transcription factor 1 (Srebf1) genes. Differentiation of committed brown preadipocytes on the other hand involves interactions between proteins encoded by the bone morphogenetic protein 7 (BMP7), PR domain-containing 16 (PRDM16), PPARγ, and C/EBPβ. Increased GDNF levels during white preadipocyte differentiation suppresses the expression of factors including PPARγ, fatty acid translocase (CD36), fatty acid synthase (FASN), and fatty acid binding protein 4 (FABP4), resulting in inhibition of adipose tissue expansion and lipid accumulation. Increased GDNF levels during brown preadipocyte differentiation on the other hand increase PRDM16 and β1- and β2-adrenergic receptor gene expression, which enhances brown adipose tissue formation. Enhanced GDNF expression during high-fat diet feeding induces increased β-adrenergic signaling in both white and brown adipose tissue, resulting in increased lipolysis and lipid β-oxidation. Arrows on the side of each gene pointing upward and downward indicate genes whose expression we have observed to be, respectively, increased or reduced.
Our observations that GDNF protects against HFD-induced weight gain without impairing normal animal activity therefore suggest that GDNF or its receptor agonists may be useful for the treatment of obesity. Future studies are needed with adipocyte-specific knockout of GDNF receptors to further understand the mechanism of GDNF regulation of adipocyte energy utilization and lipid accumulation. Further studies involving knockdown of specific signaling targets such as PPAR-γ and PPAR-α and β-adrenergic receptors will help delineate the mechanism of GDNF regulation of adipocyte energy utilization and lipid accumulation. The pleiotropic beneficial effects of GDNF on skeletal muscle and adipose tissue make it a unique therapeutic target for the treatment or prevention of obesity.
GRANTS
This study was supported in part by U.S. National Institutes of Health (NIH) grants NIH-RO1 DK080684 (S. Srinivasan) and NIH DK062092 (F. Anania) and VA- MERIT Award (S. Srinivasan) and VA BX001746a (F. Anania).
DISCLOSURES
No conflicts of interest, financial or otherwise, are declared by the author(s).
AUTHOR CONTRIBUTIONS
S.S., S.M.M., S.V.S., Y.-H.T., and F.A.A. conception and design of research; S.S., S.M.M., B.G.N., B.O., M.A., and F.A.A. edited and revised manuscript; S.S. and S.M.M. approved final version of manuscript; S.M.M., B.G.N., B.O., M.A., S.M., P.F., M.F.E., N.-A.L., and M.S. performed experiments; S.M.M., B.G.N., B.O., and S.M. analyzed data; S.M.M., M.F.E., N.-A.L., Y.-H.T., and F.A.A. interpreted results of experiments; S.M.M. prepared figures; S.M.M. drafted manuscript.
REFERENCES
- 1.Abel ED, Peroni O, Kim JK, Kim YB, Boss O, Hadro E, Minnemann T, Shulman GI, Kahn BB. Adipose-selective targeting of the GLUT4 gene impairs insulin action in muscle and liver. Nature 409: 729–733, 2001 [DOI] [PubMed] [Google Scholar]
- 2.Airaksinen MS, Saarma M. The GDNF family: signalling, biological functions and therapeutic value. Nat Rev Neurosci 3: 383–394, 2002 [DOI] [PubMed] [Google Scholar]
- 3.Aitman TJ, Glazier AM, Wallace CA, Cooper LD, Norsworthy PJ, Wahid FN, Al-Majali KM, Trembling PM, Mann CJ, Shoulders CC, Graf D, St Lezin E, Kurtz TW, Kren V, Pravenec M, Ibrahimi A, Abumrad NA, Stanton LW, Scott J. Identification of Cd36 (Fat) as an insulin-resistance gene causing defective fatty acid and glucose metabolism in hypertensive rats. Nat Genet 21: 76–83, 1999 [DOI] [PubMed] [Google Scholar]
- 4.Bachman ES, Dhillon H, Zhang CY, Cinti S, Bianco AC, Kobilka BK, Lowell BB. βAR signaling required for diet-induced thermogenesis and obesity resistance. Science 297: 843–845, 2002 [DOI] [PubMed] [Google Scholar]
- 5.Bronnikov G, Bengtsson T, Kramarova L, Golozoubova V, Cannon B, Nedergaard J. β1 to β3 switch in control of cyclic adenosine monophosphate during brown adipocyte development explains distinct beta-adrenoceptor subtype mediation of proliferation and differentiation. Endocrinology 140: 4185–4197, 1999 [DOI] [PubMed] [Google Scholar]
- 6.Burri L, Thoresen GH, Berge RK. The role of PPARalpha activation in liver and muscle. PPAR Res 2010, 2010 [DOI] [PMC free article] [PubMed] [Google Scholar]
- 7.Collins S, Cao W, Daniel KW, Dixon TM, Medvedev AV, Onuma H, Surwit R. Adrenoceptors, uncoupling proteins, and energy expenditure. Exp Biol Med (Maywood) 226: 982–990, 2001 [DOI] [PubMed] [Google Scholar]
- 8.Collins S, Daniel KW, Rohlfs EM, Ramkumar V, Taylor IL, Gettys TW. Impaired expression and functional activity of the beta 3- and beta 1-adrenergic receptors in adipose tissue of congenitally obese (C57BL/6J ob/ob) mice. Mol Endocrinol 8: 518–527, 1994 [DOI] [PubMed] [Google Scholar]
- 9.Creedon DJ, Tansey MG, Baloh RH, Osborne PA, Lampe PA, Fahrner TJ, Heuckeroth RO, Milbrandt J, Johnson EM. Neurturin shares receptors and signal transduction pathways with glial cell line-derived neurotrophic factor in sympathetic neurons. Proc Natl Acad Sci USA 94: 7018–7023, 1997 [DOI] [PMC free article] [PubMed] [Google Scholar]
- 10.Finkel T, Deng CX, Mostoslavsky R. Recent progress in the biology and physiology of sirtuins. Nature 460: 587–591, 2009 [DOI] [PMC free article] [PubMed] [Google Scholar]
- 11.Fox CS, Massaro JM, Hoffmann U, Pou KM, Maurovich-Horvat P, Liu CY, Vasan RS, Murabito JM, Meigs JB, Cupples LA, D'Agostino RB, Sr, O'Donnell CJ. Abdominal visceral and subcutaneous adipose tissue compartments: association with metabolic risk factors in the Framingham Heart Study. Circulation 116: 39–48, 2007 [DOI] [PubMed] [Google Scholar]
- 12.Gerhart-Hines Z, Dominy JE, Jr, Blättler SM, Jedrychowski MP, Banks AS, Lim J-H, Chim H, Gygi SP, Puigserver P. The cAMP/PKA pathway rapidly activates SIRT1 to promote fatty acid oxidation independently of changes in NAD+. Mol Cell 44: 851–863, 2011 [DOI] [PMC free article] [PubMed] [Google Scholar]
- 13.Giusti V, Verdumo C, Suter M, Gaillard RC, Burckhardt P, Pralong F. Expression of peroxisome proliferator-activated receptor-gamma1 and peroxisome proliferator-activated receptor-gamma2 in visceral and subcutaneous adipose tissue of obese women. Diabetes 52: 1673–1676, 2003 [DOI] [PubMed] [Google Scholar]
- 14.Green H, Meuth M. An established pre-adipose cell line and its differentiation in culture. Cell 3: 127–133, 1974 [DOI] [PubMed] [Google Scholar]
- 15.Guilherme A, Virbasius JV, Puri V, Czech MP. Adipocyte dysfunctions linking obesity to insulin resistance and type 2 diabetes. Nat Rev Mol Cell Biol 9: 367–377, 2008 [DOI] [PMC free article] [PubMed] [Google Scholar]
- 16.Jocken JW, Roepstorff C, Goossens GH, van der Baan P, van Baak M, Saris WH, Kiens B, Blaak EE. Hormone-sensitive lipase serine phosphorylation and glycerol exchange across skeletal muscle in lean and obese subjects: effect of beta-adrenergic stimulation. Diabetes 57: 1834–1841, 2008 [DOI] [PMC free article] [PubMed] [Google Scholar]
- 17.Kahn SE, Hull RL, Utzschneider KM. Mechanisms linking obesity to insulin resistance and type 2 diabetes. Nature 444: 840–846, 2006 [DOI] [PubMed] [Google Scholar]
- 18.Koo SH, Satoh H, Herzig S, Lee CH, Hedrick S, Kulkarni R, Evans RM, Olefsky J, Montminy M. PGC-1 promotes insulin resistance in liver through PPAR-α-dependent induction of TRB-3. Nat Med 10: 530–534, 2004 [DOI] [PubMed] [Google Scholar]
- 19.Lowell BB, Spiegelman BM. Towards a molecular understanding of adaptive thermogenesis. Nature 404: 652–660, 2000 [DOI] [PubMed] [Google Scholar]
- 20.Manfredsson FP, Tumer N, Erdos B, Landa T, Broxson CS, Sullivan LF, Rising AC, Foust KD, Zhang Y, Muzyczka N, Gorbatyuk OS, Scarpace PJ, Mandel RJ. Nigrostriatal rAAV-mediated GDNF overexpression induces robust weight loss in a rat model of age-related obesity. Mol Ther 17: 980–991, 2009 [DOI] [PMC free article] [PubMed] [Google Scholar]
- 21.Maswood N, Grondin R, Zhang Z, Stanford JA, Surgener SP, Gash DM, Gerhardt GA. Effects of chronic intraputamenal infusion of glial cell line-derived neurotrophic factor (GDNF) in aged Rhesus monkeys. Neurobiol Aging 23: 881–889, 2002 [DOI] [PubMed] [Google Scholar]
- 22.Moore MW, Klein RD, Farinas I, Sauer H, Armanini M, Phillips H, Reichardt LF, Ryan AM, Carver-Moore K, Rosenthal A. Renal and neuronal abnormalities in mice lacking GDNF. Nature 382: 76–79, 1996 [DOI] [PubMed] [Google Scholar]
- 23.Morton GJ, Cummings DE, Baskin DG, Barsh GS, Schwartz MW. Central nervous system control of food intake and body weight. Nature 443: 289–295, 2006 [DOI] [PubMed] [Google Scholar]
- 24.Murphy KG, Bloom SR. Gut hormones and the regulation of energy homeostasis. Nature 444: 854–859, 2006 [DOI] [PubMed] [Google Scholar]
- 25.Mwangi S, Anitha M, Fu H, Sitaraman SV, Srinivasan S. Glial cell line-derived neurotrophic factor-mediated enteric neuronal survival involves glycogen synthase kinase-3β phosphorylation and coupling with 14-3-3. Neuroscience 143: 241–251, 2006 [DOI] [PubMed] [Google Scholar]
- 26.Mwangi S, Anitha M, Mallikarjun C, Ding X, Hara M, Parsadanian A, Larsen CP, Thule P, Sitaraman SV, Anania F, Srinivasan S. Glial cell line-derived neurotrophic factor increases beta-cell mass and improves glucose tolerance. Gastroenterology 134: 727–737, 2008 [DOI] [PMC free article] [PubMed] [Google Scholar]
- 27.Pascual A, Hidalgo-Figueroa M, Piruat JI, Pintado CO, Gomez-Diaz R, Lopez-Barneo J. Absolute requirement of GDNF for adult catecholaminergic neuron survival. Nat Neurosci 11: 755–761, 2008 [DOI] [PubMed] [Google Scholar]
- 28.Patsouris D, Reddy JK, Muller M, Kersten S. Peroxisome proliferator-activated receptor alpha mediates the effects of high-fat diet on hepatic gene expression. Endocrinology 147: 1508–1516, 2006 [DOI] [PubMed] [Google Scholar]
- 29.Picard F, Kurtev M, Chung N, Topark-Ngarm A, Senawong T, Machado De Oliveira R, Leid M, McBurney MW, Guarente L. Sirt1 promotes fat mobilization in white adipocytes by repressing PPAR-gamma. Nature 429: 771–776, 2004 [DOI] [PMC free article] [PubMed] [Google Scholar]
- 30.Robidoux J, Martin TL, Collins S. Beta-adrenergic receptors and regulation of energy expenditure: a family affair. Annu Rev Pharmacol Toxicol 44: 297–323, 2004 [DOI] [PubMed] [Google Scholar]
- 31.Schwartz MW, Woods SC, Porte D, Seeley RJ, Baskin DG. Central nervous system control of food intake. Nature 404: 661–671, 2000 [DOI] [PubMed] [Google Scholar]
- 32.Shepherd PR, Kahn BB. Glucose transporters and insulin action—implications for insulin resistance and diabetes mellitus. N Engl J Med 341: 248–257, 1999 [DOI] [PubMed] [Google Scholar]
- 33.Smart JL, Tolle V, Low MJ. Glucocorticoids exacerbate obesity and insulin resistance in neuron-specific proopiomelanocortin-deficient mice. J Clin Invest 116: 495–505, 2006 [DOI] [PMC free article] [PubMed] [Google Scholar]
- 34.Susulic VS, Frederich RC, Lawitts J, Tozzo E, Kahn BB, Harper ME, Himms-Hagen J, Flier JS, Lowell BB. Targeted disruption of the beta 3-adrenergic receptor gene. J Biol Chem 270: 29483–29492, 1995 [DOI] [PubMed] [Google Scholar]
- 35.Tateishi K, Okada Y, Kallin EM, Zhang Y. Role of Jhdm2a in regulating metabolic gene expression and obesity resistance. Nature 458: 757–761, 2009 [DOI] [PMC free article] [PubMed] [Google Scholar]
- 36.Trupp M, Belluardo N, Funakoshi H, Ibáñez CF. Complementary and overlapping expression of glial cell line-derived neurotrophic factor (GDNF), c-ret proto-oncogene, and GDNF receptor-α indicates multiple mechanisms of trophic actions in the adult rat CNS. J Neurosci 17: 3554–3567, 1997 [DOI] [PMC free article] [PubMed] [Google Scholar]
- 37.Tseng YH, Kokkotou E, Schulz TJ, Huang TL, Winnay JN, Taniguchi CM, Tran TT, Suzuki R, Espinoza DO, Yamamoto Y, Ahrens MJ, Dudley AT, Norris AW, Kulkarni RN, Kahn CR. New role of bone morphogenetic protein 7 in brown adipogenesis and energy expenditure. Nature 454: 1000–1004, 2008 [DOI] [PMC free article] [PubMed] [Google Scholar]
- 38.Tumer N, Scarpace PJ, Dogan MD, Broxson CS, Matheny M, Yurek DM, Peden CS, Burger C, Muzyczka N, Mandel RJ. Hypothalamic rAAV-mediated GDNF gene delivery ameliorates age-related obesity. Neurobiol Aging 27: 459–470, 2006 [DOI] [PubMed] [Google Scholar]
- 39.Wang H, Hughes I, Planer W, Parsadanian A, Grider JR, Vohra BP, Keller-Peck C, Heuckeroth RO. The timing and location of glial cell line-derived neurotrophic factor expression determine enteric nervous system structure and function. J Neurosci 30: 1523–1538, 2010 [DOI] [PMC free article] [PubMed] [Google Scholar]
- 40.Xu B, Goulding EH, Zang K, Cepoi D, Cone RD, Jones KR, Tecott LH, Reichardt LF. Brain-derived neurotrophic factor regulates energy balance downstream of melanocortin-4 receptor. Nat Neurosci 6: 736–742, 2003 [DOI] [PMC free article] [PubMed] [Google Scholar]
- 41.Zhao Z, Alam S, Oppenheim RW, Prevette DM, Evenson A, Parsadanian A. Overexpression of glial cell line-derived neurotrophic factor in the CNS rescues motoneurons from programmed cell death and promotes their long-term survival following axotomy. Exp Neurol 190: 356–372, 2004 [DOI] [PubMed] [Google Scholar]