

Abstract
Reactive species such as free radicals are constantly generated in vivo and DNA is the most important target of oxidative stress. Oxidative DNA damage is used as a predictive biomarker to monitor the risk of development of many diseases. The comet assay is widely used for measuring oxidative DNA damage at a single cell level. The analysis of comet assay output images, however, poses considerable challenges. Commercial software is costly and restrictive, while free software generally requires laborious manual tagging of cells. This paper presents OpenComet, an open-source software tool providing automated analysis of comet assay images. It uses a novel and robust method for finding comets based on geometric shape attributes and segmenting the comet heads through image intensity profile analysis. Due to automation, OpenComet is more accurate, less prone to human bias, and faster than manual analysis. A live analysis functionality also allows users to analyze images captured directly from a microscope. We have validated OpenComet on both alkaline and neutral comet assay images as well as sample images from existing software packages. Our results show that OpenComet achieves high accuracy with significantly reduced analysis time.
Keywords: Comet assay, Single cell gel electrophoresis, DNA damage, Image processing, Intensity profile analysis, ImageJ plug-in
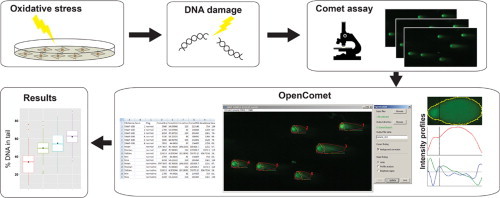
Graphical abstract
Highlights
-
•
OpenComet is a free software tool for measuring DNA damage in comet assay images.
-
•
An automated image analysis algorithm extracts, segments and scores comet shapes.
-
•
OpenComet is validated to be accurate with respect to manual scoring.
-
•
Due to automation, OpenComet is less prone to human bias and reduces analysis time.
Introduction
Cellular DNA is constantly attacked by chemical agents including reactive oxygen and nitrogen species (ROS/RNS) and other environmental factors such as UV and radiation. DNA damage is associated with the etiology of many major diseases. In particular, oxidative DNA damage has been implicated in cardiovascular disease, neurodegenerative diseases and ageing, and its pathological relevance at various stages of carcinogenesis has been studied (reviewed in [1]). Oxidative DNA damage is considered to be one of the important parameters in biomonitoring the human health impact of dietary antioxidants, smoking, and other lifestyle and environmental factors such as carcinogens or UV rays [2], [3]. Various experimental methods have been proposed for measuring oxidative DNA damage [3]. The comet assay, in specific, is widely used for measuring oxidative and other types of DNA damage [4].
The comet assay, also known as single-cell gel electrophoresis (SCGE), is a simple, sensitive and reliable method for studying DNA damage induced by physical and chemical agents [5], [6], [7]. The basic principle of the comet assay method is simple. Cells are embedded in agarose and lysed, followed by electrophoresis. Upon electrophoresis, undamaged DNA in a supercoiled state remains intact while damaged DNA strand breaks are revealed. These relaxed loops of damaged DNA extend to the anode to form a comet-shaped structure. Comets can then be visualized by staining with a DNA-binding dye using fluorescence microscopy. To assess the level of DNA damage, the comet size, shape and the amount of DNA within it needs to be measured. Ostling and Johanson introduced the microgel electrophoresis method to measure DNA strand breaks under neutral pH condition [8]. Later, the assay was modified and performed under alkaline pH conditions [5], which remains in its most commonly used form. Variants of the comet assay protocol have been proposed for measuring different forms of DNA damage such as single strand breaks, alkali-labile sites [5], double strand breaks [9] as well as DNA cross-links [10].
The comet assay has several features which make it an attractive choice for measuring DNA damage, including the need for a relatively low number of cells per sample and the availability of data at the individual cell level [11]. Measurements at the single-cell level allow robust statistical analysis and provide a way to assess variations in response to DNA damaging agents between cells of the same exposed population. The comet assay is used to study processes involving DNA damage in many fields such as environmental toxicology [12], bio-monitoring [13], radiation biology [14], nutritional studies and cancer studies [15], [16]. While the comet assay has widespread use, a common issue in all its applications is the process of analyzing the microscope images. The time needed for scoring these images is one major drawback of the comet assay. Further, the non-availability of free automated tools for this task still poses considerable challenges.
Comets can be identified and scored by visual inspection or by using image analysis software packages [11]. Visual scoring gives a simple qualitative indication of DNA damage. However it is very subjective [17]. In contrast, the use of comet analysis software provides quantitative and reproducible measurements. The currently available comet analysis tools can be broadly classified as manual or automated. Manual analysis typically requires an expert to set threshold brightness values separating the background, to select the nucleus, and to mark the comet head [17], [18], [19]. Automated tools employ image analysis techniques to recognize and measure comets, and are generally much faster than manual scoring. Due to the efficiency gained through automation, one can typically afford to measure larger sample sizes, which is critical for statistically significant results [20]. Algorithms for automated analysis [21], [22], [23], [24], [25] have been proposed in recent years, however, these are coupled with in-house microscope setups and the source code is not accessible to the public. Commercial automated tools such as IMSTAR Pathfinder (www.imstarsa.com) are also available, and have been used in comet assay studies [20] (for a list of commercial comet assay analysis software, see http://www.cometassay.com) but, they are expensive and provide no possibilities for examining and modifying the underlying image processing algorithm.
Here we present OpenComet, a tool specifically developed to address the difficulties in the automatic analysis of comet assay images. In OpenComet, we have implemented novel image processing algorithms for finding comets and segmenting the comet head. The overall analysis time is reduced significantly compared to tools requiring manual selection of comets. Another important advantage of our tool is that it is open source, thus enabling users to modify the program for customization and improvement. OpenComet has been validated on both alkaline and neutral comet assays across different levels of damage. Our validation results demonstrate that the automated image processing methods used by the tool lead to fast and robust comet analysis. A comparison with manual measurements shows that OpenComet achieves high accuracy and significantly shortens the analysis time. We have also compared the features and capabilities of OpenComet with two of the widely used free tools for comet assay image analysis (CaspLab [17] and CometScore [18]) in Table 1. As shown in the table, other than automating the analysis process, OpenComet also overcomes some technical restrictions of these tools.
Table 1.
Comparison of features and capabilities of OpenComet with two of the leading free comet assay analysis software, CometScore and CaspLab.
| Features | OpenComet | CometScore | CaspLab |
|---|---|---|---|
| Scoring | Automated | Manual | Manual |
| Manual input | None/optional manual review | Comet boundary and head position selection | Comet boundary selection |
| Output format | Tab delimited file with XLS extension | Tab delimited text file | Tab delimited text file |
| Saving scored images | Automatic saving | Manual | Manual |
| Background correction | Yes, automated | Yes, based on manually set background cut-off | Yes, manual selection |
| Multiple objective calibration | Yes, 5×–20× objectives | Yes for 5× and 10× objectives. For 20× objective, measurement is difficult | Ideal for 20× objective images. For 5× and 10× images, comet head not found correctly. |
| Input image format | All common image formats | Only BMP | Only TIFF |
| Operating system | Windows, Mac OS X, Linux | Windows | Windows, Mac OS X, Linux |
In the following, we first introduce the interface of OpenComet, and then describe the image processing steps involved in analyzing comets. Next we describe the comet assay experiments used to validate OpenComet. The experiments involved measuring the DNA damage and DNA repair kinetics upon medium sub toxic hydrogen peroxide (H2O2) induced stress. We then show the performance of OpenComet on the images obtained from these experiments.
Materials and methods
OpenComet user interface
OpenComet is deployed as a plug-in for the popular image processing platform, ImageJ. The ImageJ software (www.rsbweb.nih.gov/ij/) can display, process and analyze images, and is mainly intended for use with microscopy images. It is an ideal framework for OpenComet to run in due to its cross-platform nature, its ability to interpret a variety of image formats and due to the fact that it implements a large number of elementary image processing operations. OpenComet, once installed, can be launched from the Plugins menu of ImageJ.
OpenComet has a user-friendly interface (Fig. 1) to select a set of images and run the analysis. The user first selects a set of input images to be analyzed. Any number of images inside a single folder can be selected for analysis, and the images can be of any of the widely used image formats (typically BMP or TIFF). Next, one selects an output folder, where the result spread sheet as well as copies of the input images with the analysis overlay will be saved.
Fig. 1.
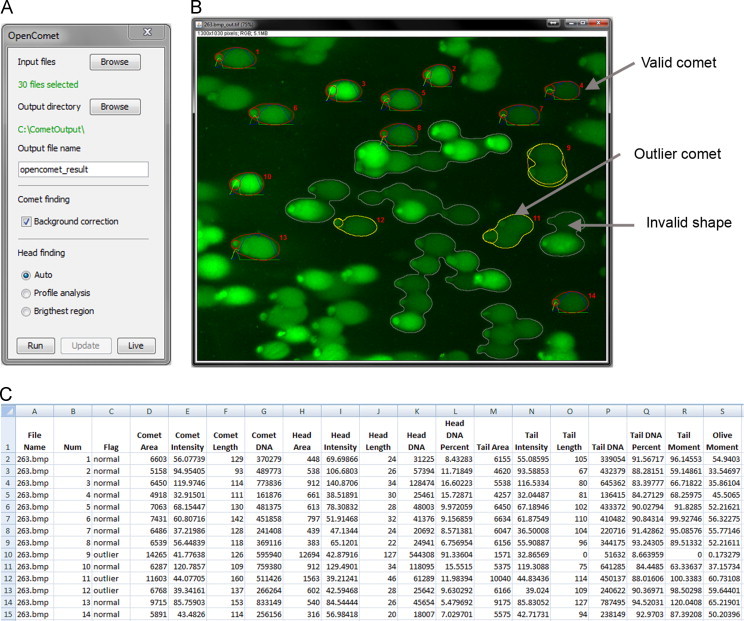
OpenComet interface and outputs. The user interface of OpenComet (A) allows the user to choose input images and run the analysis algorithm. After pressing the Run button, the output image is computed and displayed (B). The output image shows valid, invalid and outlier comets with profile plots and identification numbers. The comet measurements and statistics are exported as a spreadsheet (C). On-click removal of regions from the output image is also available, accompanied by automatic updating of the spreadsheet.
The measurement results are saved in a spreadsheet which includes measurements obtained for each individual comet, as well as statistics for the population of comets extracted from all input images. Further, for each input image, a result image is generated which shows the comet and head outlines, the associated profiles as well as identification numbers to easily link the comets to the measurements. The output images and the spreadsheet are saved automatically in the chosen output folder. After the automated analysis is complete, the user has the option to review the images and click on any comet to remove it from the output if needed.
We have developed a live analysis function in OpenComet, which allows users to analyze images as soon as they are acquired through a microscope. This functionality can be used when launching OpenComet as a plug-in in Micro-Manager [26], an open-source microscope control software, which provides an interface between ImageJ and a large number of microscope models. To start analysis, the user captures an image of the current microscope view through Micro-Manager. The user can then launch OpenComet, and click on the Live button to analyze the captured image. A summary of the live analysis setup is shown in Supplementary Fig. 1. By working on images directly from the microscope, the live analysis function can further reduce the overall time needed to perform a comet assay experiment.
Algorithm for image analysis
The analysis of comet assay images relies on the fact that the intensity of emitted light is linearly related to the amount of DNA in the respective regions of the cell [11], [19]. Therefore, the brightness (or intensity) of image pixels can be directly used to assess the amount of DNA damage. This brightness information can be interpreted irrespective of the particular type of staining used, and thus, OpenComet can score images that are stained with DNA specific fluorescent dyes (EtBr, DAPI, Propidium iodide, SYBR Green, SYBR Gold, YoYo-1) as well as non fluorescent staining (silver nitrate). Comet assay images are often produced as grayscale images. If the provided image contains multiple channels, OpenComet automatically finds the one containing the brightness information and uses this for analysis. We first discuss how OpenComet extracts shapes from the images and determines which ones are valid comets. Then we present the method used for separating the comet head from the tail. Finally, we show the calculations that lead to the assessment of DNA damage. The major steps of the image processing algorithm used by OpenComet are summarized in Fig. 2.
Fig. 2.
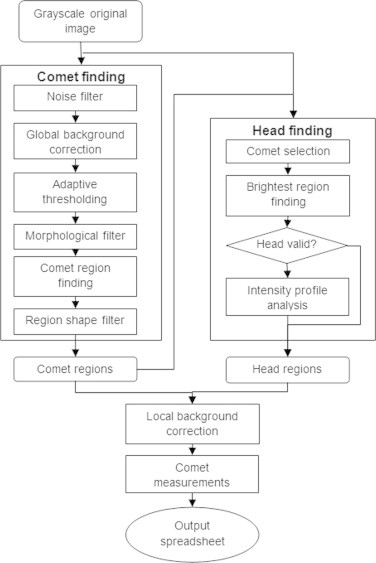
The OpenComet algorithm. The diagram shows the steps of the image processing algorithm involved in analyzing comet assay images. The grayscale image is analyzed to find valid comet regions. Following this, the head is segmented inside each comet. After local background correction, comet measurements are made and the output is generated.
Comet finding
The first task in finding comets is to separate meaningful objects from the background. These objects then need to be either accepted as comets or discarded. Our approach involves extracting for the objects of interest shape parameters such as convexity ratio and the ratio of head displacement. We show that the shape parameters can be used to separate comets from non-comets.
To obtain regions of interest, a threshold intensity is chosen, below which pixels are considered to be part of the background. It is important to choose this threshold adaptively, since comet assay images can differ significantly in terms of illumination. The tool uses Huang's method (implemented in ImageJ), which relies on the intensity histogram of the image and chooses the threshold value by minimizing a measure of fuzziness [27]. After applying the threshold, a binary image is obtained, which contains a set of connected regions (regions of interest) that are distinct from the background. These regions need to be further analyzed and filtered to obtain the actual regions corresponding to comets. Very small regions are discarded as these are due to noise and are not full comets. Furthermore, comets touching the edge of the image need to be filtered out since some of their brightness information is cropped. More sophisticated methods are employed to deal with overlapping comets. Overlapping comets appear as a single bright area in the original image and will form a single connected region after thresholding. Since the intensity content of multiple comets is overlapped in these objects, these should be discarded and should not be included in measurements. We note however that comets with higher damage (and longer tails) are more likely to overlap. Hence if the image contains a large number of overlaps, the measured damage is likely to be biased towards a lower value [6]. While OpenComet attempts to correctly discard all overlaps, one should attempt to minimize their occurrence when performing the comet assay.
To recognize overlaps and other irregular regions, we make two important assumptions about the properties of comets. Firstly, we assume that comets have a convex shape. In other words, comets do not have irregular intrusions from their convex hull. This is due to the regular way in which damaged DNA spreads from the nucleus. To measure this property, we use the convexity ratio, also called solidity, which is the ratio of a region's area and the area of its convex hull [28].
Our second assumption is that comets are symmetric. Due to the fact that comet tails extend towards the anode during electrophoresis, comets can be expected to be aligned along the same axis and to be symmetric with respect to this axis. OpenComet assumes that cells are symmetric with respect to the horizontal axis of the image and that tails extend towards the right hand direction. This orientation is used in the majority of cases. However, occasionally images are captured in different alignments (e.g. top to bottom). In these cases, we recommend rotating the images in ImageJ before analyzing them with OpenComet. After evaluating several measures of symmetry, we found the head displacement ratio to be most robust. This parameter calculates the displacement between the centerline of the front of the region and the centerline of the back of the region, and thus detects shapes misaligned with the horizontal axis.
A small convexity ratio or a large head displacement can be a sign of overlapping or otherwise irregular comets, as demonstrated in Fig. 3. A sample of 150 shapes manually labeled as comets or non-comets shows that defining a minimal convexity threshold and maximal head displacement threshold is a reasonable basis for accepting a shape as a comet.
Fig. 3.
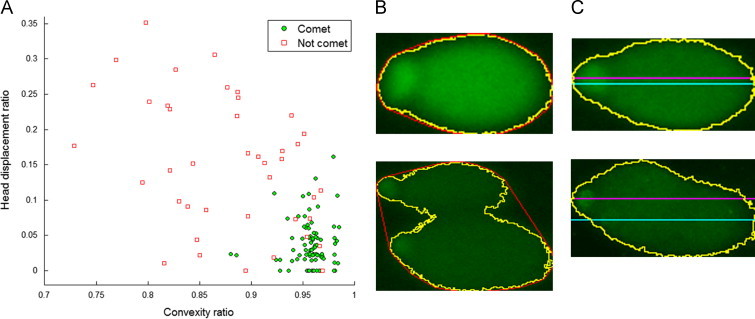
Comet finding and classification based on shape. 150 segmented comets from five images have been manually labeled as comet or not comet (A) and plotted according to convexity ratio and head displacement ratio. A single comet and two overlapping comets are shown in (B) with their respective convex hulls (red). A single comet two overlapping comets are shown in (C), with the front centerline (magenta) and the back centerline (cyan) drawn showing whether the head is aligned with the tail.
The regions filtered out are discarded. The remaining regions are accepted as comets and are analyzed subsequently. In order to further decrease the number of false positives, statistical outlier tests are applied on the shape of the comet. Comets that have irregular height or area will still be kept, but they will be flagged as outliers in both the output image and the measurement spreadsheet.
Head segmentation
After having recognized the regions occupied by comets, a further step of segmentation is needed to find the head of the comet. Separating the head accurately from the rest of the comet is essential, since it strongly influences the calculation of the amount of DNA damage.
Our first method for finding the comet head comes from the assumption that the head is the brightest region of the comet [19]. This method is well suited for lightly damaged cells, which have little or no tail. However the brightness assumption may not always hold, as the relative size and brightness of the head and the tail can vary significantly across experimental setups and levels of damage. In case a cell is heavily damaged, the tail can be bigger and brighter than the head. We therefore introduce a second method for head finding, which overcomes this limitation. The method relies on analyzing the intensity profile of the comet. Comet segmentation based on intensity profile has previously been proposed [25] using Gaussian curve fitting. Our method does not assume that the profile is a mixture of Gaussians, and instead analyses an arbitrary intensity profile signal directly to find the border between the comet head and tail. We first show head finding based on the brightest region assumption and then introduce the method using analysis of the intensity profile.
In the brightest region method we take the comet and find the set of brightest pixels. We do this by determining a brightness threshold T⁎ so that 5% of the pixels are brighter than T⁎:
| (1) |
where (x, y) specifies the coordinates of a pixel, P(x, y) is the brightness of the pixel, C is the set of pixels belonging to the comet and |C| denotes the number of pixels in the comet. I is a function which returns 1 if its argument is true and 0 otherwise. We calculate the center of mass of the brightest pixels (the ones above the threshold) and then take this as the horizontal position of the head center:
| (2) |
The vertical position of the head center, is simply taken on the horizontal centerline of the comet. The head region is defined as a circle around the point with radius equal to the distance of the leftmost point of the comet and the head center. For heavily damaged cells, the brightest pixels may be located in the tail, which results in an incorrect position for . We now introduce the head finding method based on intensity profile analysis, which performs more robustly for heavily damaged cells.
The intensity profile summarizes the distribution of pixel intensities along the horizontal axis. We define the profile as a vector whose length is equal to the length of the comet (in terms of pixel number). The profile is calculated inside a bounding rectangle whose top is denoted by t, height by h and width by w. The comet profile with respect to the bounding rectangle is then calculated as follows:
| (3) |
where again, P(x, y) is the intensity of the pixel at position (x, y), and only pixels inside the comet C are considered. The profile can be thought of as a linear signal, a signature of the intensity along the comet and inside the bounded region. We first need to process this signal and find a characteristic pattern which marks the border between head and tail. We can extract useful patterns from the signal by convolving it with other vectors, referred to as kernels. In general, the convolution of the profile p with a kernel K of length n is given by:
| (4) |
We introduce two convolution kernels used for the analysis of the profile:
| (5) |
Ks is a linear smoothing kernel of length L, which can be adjusted relative to the comet length and Kd is used to compute the discrete differential of the profile.
To find the border between head and tail, we extract the rate of change in intensity (first differential, pd) as well as the convexity (second differential, pdd) of the profile. Before each differentiation, we apply the smoothing kernel to filter out noise while preserving the overall trend:
| (6) |
We suggest that a general pattern can be recognized in these signals, which is robustly preserved across a wide range of different comet shapes and damage levels. At the right-hand side border of the head the rate of intensity change (pd) drops, and at the beginning of the tail the rate of change quickly rises again. We define the border between head and tail as the point where the rate of change rises the quickest after the drop. This point is marked by the first maximum point in pdd after a crossing from negative to positive. Fig. 4 shows comets with their respective profiles and differentials indicating the predicted position of the border between head and tail. The head region is again taken as a circle with diameter spanning the leftmost edge of the comet and the head–tail border.
Fig. 4.
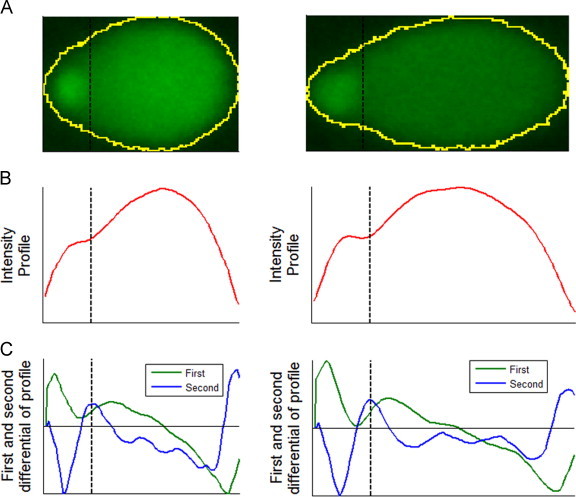
Head segmentation based on profile analysis. Comet areas (A) are summarized by the profile along the horizontal axis (B). The first and second differentials of the profiles are shown in (C). The estimated position of the border between the head and tail is shown with dashed lines across (A–C).
OpenComet allows the user to choose the method of head finding (brightest region or profile analysis). A default automatic option is also available, which first attempts to find the head based on brightness, and if the obtained region is unacceptable, proceeds with the profile analysis. Once the head is found, the algorithm continues with local background correction and comet measurements.
Comet measurements
Comet assay images can have a significant amount of background illumination, and in some cases this is uneven along the image. In order to make reliable measurements, local background brightness needs to be subtracted from the comet. OpenComet automatically chooses a rectangle above or below the comet and calculates a background profile along the horizontal axis. We apply smoothing on the background profile to eliminate noise and then subtract it column wise from the comet intensities.
After correcting intensities with the local background, comet parameters can be extracted that let us estimate DNA damage in the cells. The extent of DNA damage is related to the amount of DNA in the tail. However, the exact parameter to measure damage is often debated [6], [23], [29]. Three measures of DNA damage have been shown to be particularly good indicators of the underlying damage [29]: DNA percentage in tail, tail moment and Olive moment [30]. While tail moment and Olive moment are measured in arbitrary units (and can thus differ in value across image analysis systems), the tail DNA percentage is easily comparable across platforms [6], [29]. OpenComet calculates and outputs these three important damage measures along with other parameters concerning the comet, thus allowing the user to choose the desired one for further analysis. The comet parameters measured by OpenComet are listed in Table 2.
Table 2.
Summary of comet parameters computed by OpenComet. Three measures are given to assess DNA damage (Tail DNA%, tail moment and Olive moment) along with other useful shape and intensity measurements.
| Parameter | Description | Parameter | Description |
|---|---|---|---|
| Comet area | Number of pixels in the comet | Head DNA% | Head DNA content as a percentage of comet DNA content |
| Comet length | Length of the comet region in pixels | Tail area | Number of pixels in the tail |
| Comet DNA content | Sum of pixel intensities inside the comet | Tail length | Length of the tail in pixels |
| Comet average intensity | Comet DNA content divided by comet size | Tail DNA content | Sum of pixel intensities inside the tail |
| Head area | Number of pixels inside the head | Tail average | Tail DNA content divided by tail size |
| Head diameter | Length of the head in pixels | Tail DNA% | Tail DNA content as a percentage of comet DNA content |
| Head DNA content | Sum of pixel intensities inside the head | Tail moment | Tail length times Tail DNA% |
| Head average intensity | Head DNA content divided by head size | Olive moment | Product of tail DNA% and the distance between the intensity-weighted centroids of head and tail |
Experimental setup
Cell lines and drug treatment
The images used for validating OpenComet were obtained from the following experiments. Rat muscle cells (L6, ATCC CRL-1458) were grown in high glucose Dulbecco's modified Eagle's medium (Hyclone, USA) supplemented with 10% FBS (Hyclone, USA), 2 mM l-glutamine (Hyclone), 0.25 mg/ml geneticin (GIBCO) and 1 mM gentamycin sulfate (BioWhittaker) at 37 °C, with 5% CO2, in a humidified atmosphere. L6 cells were plated on day 1 and then treated with 50 µM hydrogen peroxide (Sigma, USA) for 1 h (hr) after 24 h of plating. After 1 h of H2O2 treatment, cells were replenished with fresh medium and trypsinized, and collected at different time points (1 h, 3 h, 6 h, 12 h, 24 h) after H2O2 treatment. The level of DNA damage at each time point was assessed using alkaline comet assay. CometAssay® neutral control cells (Trevigen, USA) were used to perform neutral comet assay. Neutral control cells include a healthy cell population (NC0), which was treated to increase the amount of double-strand break damage linearly in populations NC1, NC2 and NC3.
Comet assay experimental protocol
The comet assay was performed as described by Singh et al. [5], except for a few changes as mentioned below. L6 cells and neutral control cells were combined with molten LM Agarose (Trevigen) (at 37 °C) at a ratio of 1:10 (v/v), and immediately spread onto CometSlide (Trevigen). After 10 min of gelling at 4 °C, the cells were lysed with lysis solution (Trevigen, USA) at 4 °C for 1 h. Upon three washes in distilled water for 5 min each, alkaline comet assay was performed on the slides plated with L6 cells and neutral comet assay was performed on the slides plated with neutral control cells. In case of alkaline comet assay, the slides were placed in a horizontal electrophoresis tank containing electrophoresis solution (0.3 M NaOH (Merck, Germany), and 1 mM EDTA (Bio Rad, USA), pH>13) and allowed to denature for 30 min. Electrophoresis was run for 25 min (1 V/cm). In case of neutral comet assay, the slides were placed in TAE buffer (300 mM sodium acetate (Merck), 10 mM Tris HCl (1st BASE, Singapore), pH 8.5), and electrophoresis was run at constant 20 V for 40 min (1 V/cm). After both alkaline and neutral electrophoresis, the slides were rinsed with 0.4 M Tris, pH 7.5 neutralization buffer for 3× 5 min. The slides were then washed in distilled water and immersed in 70% ethanol for 5 min and dried at 40 °C for 10–15 min, and then stained with SYBR green 1 dye (Molecular probes, Invitrogen, USA). Comet images were captured using a Zeiss Axioplan fluorescent microscope. The images were analyzed using our OpenComet software and CometScore version 1.5 software [18]. The extent of DNA damage was expressed as a measure of percentage of DNA in tail. The Box–Whisker plots were drawn using the ggplot2 package and the R statistical software.
Recommendations for preparing slides
OpenComet has steps specifically aimed at filtering out overlapping comets. However (see also the section on Comet finding), overlapping comets, even if correctly discarded, may introduce a bias in the measured damage on the set of cells. One should therefore attempt to minimize the occurrence of overlaps when performing the comet assay. First, we suggest trypsinization, which is effective in reducing the clumping among cells. Further, we recommend drying the slides at 40 °C for 10–15 min. Drying brings cells in different view levels into a single plane to facilitate observation. We recommend 8000–10,000 cells per slide (Trevigen), however, user optimization may be required for other slides. OpenComet assumes that a comet appears as a single connected region in the image. In order to reliably measure heavily damaged comets, electrophoresis running time can be reduced to prevent separation of comet head and tail.
Results and validation
To test the performance of OpenComet, we conducted several experiments on comet assay images obtained from experiments involving cellular response to oxidative stress. In our first experiment, we used alkaline comet assay images to assess the accuracy of our tool in measuring comets in comparison with manual scoring. Next, to show that our algorithm is robust against variation in comet shapes and sizes, OpenComet was used on a series of neutral comet assay images and on sample images from other software tools. We first look at the results of validation experiments for OpenComet and then provide details about the experimental setup used to obtain the comet assay images.
In our experimental setup for alkaline comet assay, L6 cells were treated with 50 μM H2O2 for 1 h, causing DNA damage. Cells were then allowed to repair this damage over 24 h. Under this medium sub toxic level of oxidative stress, we see a gradual repair process over the recovery time. Control cells indicate no treatment with H2O2. Fig. 5A shows sample images for both control and treated cells at five time points. The images clearly depict the ongoing repair of DNA damage with time.
Fig. 5.
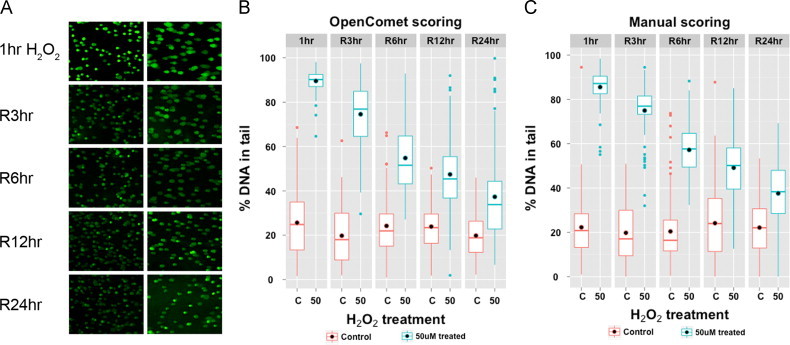
OpenComet analysis of alkaline comet assay images. (A) shows sample images of treated and control cells at five time points of measurement. The percentage of DNA in the tail is plotted as determined by OpenComet (B) and manual scoring (C). Manual scoring was performed using CometScore [18].
We first measured the accuracy of OpenComet in classifying shapes as comets or non-comets. We analyzed 10 randomly chosen images (one from each gel) with OpenComet and counted whether the shapes are recognized as valid, outlier or invalid. We also classified all regions in the same images manually and compared the results. Comets flagged as outliers are considered negatives in the calculations. The results are shown in Table 3 and indicate that the shape and size attributes used for deciding whether a comet is valid are indeed useful.
Table 3.
The accuracy of finding comets based on 10 randomly chosen images from the alkaline comet assay.
| True | Positive | 121 |
| Negative | 102 | |
| False | Positive | 8 |
| Negative | 3 | |
| Sample size | 234 | |
| Sensitivity | 97.6% | |
| Specificity | 92.7% |
We next compared OpenComet with manual scoring in terms of measuring DNA damage. Manual scoring was performed with the CometScore software [18]. All together we have 10 cases (five time points, control and treated), and for each case we score exactly 100 comets both manually and with OpenComet. Choosing a fixed number of comets allows us to compare the measured damage and the time taken to perform the measurements in a consistent manner. In order to quantify the repair process, we measure the percentage of DNA in comet tails for each gel. Fig. 5B depicts the decreasing trend of DNA damage measured with OpenComet. The DNA damage, as measured manually, is shown in Fig. 5C. We see that OpenComet precisely captures the decreasing trend of DNA damage over time, and matches the trend produced by manual measurements.
OpenComet was implemented on a 2.83 GHz, 4 GB RAM desktop computer. It achieved significant speedup compared to the manual measurement process. Manual scoring of 1000 comets (100 comets for each of 10 cases) took a total of 75 min. Analyzing the same number of comets using OpenComet completed in less than 2 min. Both timing results include the overhead of choosing the input images and output folder.
We also validated OpenComet on neutral comet assay images. The comets in these images present different shapes and characteristics from alkaline comet assay images. Fig. 6A shows sample images from the neutral assay performed on Trevigen control cells with different levels of DNA damage. The increasing trend in damage is measured by OpenComet, as shown in Fig. 6B. Thus OpenComet measures comets accurately, irrespective of their difference in size and shape.
Fig. 6.
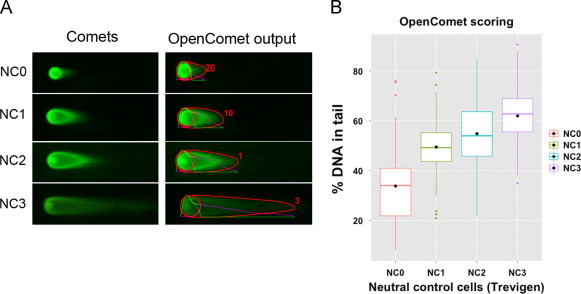
OpenComet analysis of neutral comet assay images. We used OpenComet to analyze neutral comet assay images of industrial standard damaged cells (A). OpenComet captured the increasing trend in the amount of DNA damage across NC0–NC3 cells (B).
In Fig. 5, Fig. 6, we use percentage of DNA in tail as a measure of DNA damage. We have performed further validation using tail moment, another common measure of DNA damage, which is also calculated by OpenComet. We found that the results for tail moment are consistent with those using percentage of DNA in tail. The results are shown in Appendix A, Appendix A.
Finally, we used OpenComet to score sample images provided by other comet analysis software (Supplementary Fig. 4). These images differ significantly from the ones used in our previous experiments and show diverse magnifications and illuminations. The results indicate that our tool can reliably extract a large proportion of comets from these images as well.
Discussion
In this paper we presented OpenComet, a tool for analyzing comet assay images. OpenComet uses robust image processing algorithms for extracting and classifying comets, separating the comet head, and measuring comet parameters. Our validation results show that OpenComet is fast and accurate in analyzing images for both alkaline and neutral comet assays.
An important assumption in the proposed image analysis algorithm is that a comet appears as a single connected region in the image. However, there can be instances when under very high damage conditions, a comet's head and tail effectively appear as two separated regions in the image. Automatically identifying these comets is currently a limitation of OpenComet, and we are exploring extensions of the algorithm to deal with this special case.
OpenComet fully automates the process of analyzing comet assay images. In contrast, existing free software packages often involve manual tagging of cells, resulting in a laborious, time-consuming process. Manual scoring results can be difficult to reproduce and are prone to subjective bias. These tools are also frequently platform dependent, do not recognize all common image formats and do not provide batch image processing capabilities. Commercial tools are commonly sold as a combined microscope and software package at a significant cost. Further, source code is not made available, and the functionality of the software cannot be examined or modified by the user. In contrast, OpenComet is free and can be customized to fit the user's needs. In summary, OpenComet is a useful alternative to currently available free and commercial tools that perform comet assay image analysis.
Conclusions
The comet assay has a well-deserved popularity, as it is simple and economical to perform. The availability of powerful automated and free comet assay imaging software is currently one of the major limitations in using the assay. OpenComet helps to overcome the current limitations in image analysis, making comet assay a more viable method to detect DNA breaks produced by ROS/RNS and other damaging agents.
Implementation and availability
The OpenComet plug-in and source code is available at www.opencomet.org. Instructions for installing and using the tool as well as guides for modifying it are available at the same website. OpenComet is platform independent, and thus works on Windows, Mac OS X and Linux systems. OpenComet is written in Java and deployed as a plug-in for the open-source image processing software ImageJ. It leverages image processing methods and plug-ins accessible through the ImageJ API. The plug-in development interface of ImageJ also allows for convenient modification and recompilation of OpenComet if needed. ImageJ can be downloaded from www.rsbweb.nih.gov/ij/. OpenComet can also be used within Fiji, an extended version of ImageJ containing useful plug-ins and a more convenient interface for modifying and developing plug-ins. The latest version of Fiji is available at www.fiji.sc. Micro-Manager, with which the live analysis feature of OpenComet can be used, is available at www.micro-manager.org. We have used the following versions of the tools in this work: OpenComet 1.3, ImageJ 1.47v, Micro-Manager 1.4.13 and Java 1.6.0.
Footnotes
Supplementary data associated with this article can be found in the online version at doi:10.1016/j.redox.2013.12.020.
Contributor Information
Benjamin M. Gyori, Email: bgyori@nus.edu.sg.
Gireedhar Venkatachalam, Email: gv@nus.edu.sg.
P.S. Thiagarajan, Email: thiagu@comp.nus.edu.sg.
David Hsu, Email: dyhsu@comp.nus.edu.sg.
Marie-Veronique Clement, Email: bchmvc@nus.edu.sg.
Appendix A. Supplementary materials
Supplementary Figure 1. OpenComet live analysis. OpenComet can analyze images captured from a microscope using the live analysis functionality. Micro-Manager is first configured to stream live images through a camera attached to the microscope used in the comet assay experiment. A still image can be snapped by Micro-Manager. By clicking the Live button on the OpenComet interface, the tool analyzes the image saves 17 the measurement results
Supplementary Figure 2. OpenComet analysis of tail moments on alkaline comet assay images. (A) shows sample images of treated and control cells at 5 time points of measurement. The tail moment statistics are plotted as determined by OpenComet (B) and manual scoring (C). Manual scoring was performed using CometScore [18].
Supplementary Figure 3. OpenComet analysis of tail moments on neutral comet assay images. We used OpenComet to analyze neutral comet assay images of industrial standard damaged cells (A). OpenComet captured the increasing trend in the amount of DNA damage across NC0-NC3 cells (B).
Supplementary Figure 4. OpenComet validation on sample images from other comet assay analysis software. All sample images are analyzed by OpenComet and the marked output image is displayed (A-C). (A) Image from CometScore [18], analyzed with default settings. (B) Image from CaspLab [17], analyzed with head finding based on profile analysis. (C) Image obtained from an example comet assay pipeline for CellProfiler available at http://www.cellprofiler.org/examples.shtml, analyzed with default settings and without background correction.
References
- 1.Trachootham D., Lu W., Ogasawara M.A., NR-D Valle, Huang P. Redox regulation of cell survival. Antioxid. Redox Signal. 2008;10:1343–1374. doi: 10.1089/ars.2007.1957. [DOI] [PMC free article] [PubMed] [Google Scholar]
- 2.Collins A.R. Measuring oxidative damage to DNA and its repair with the comet assay. Biochim. Biophys. Acta. 2014;1840(2):794–800. doi: 10.1016/j.bbagen.2013.04.022. [DOI] [PubMed] [Google Scholar]
- 3.Halliwell B. Why and how should we measure oxidative DNA damage in nutritional studies? How far have we come? Am. J. Clin. Nutr. 2000;72:1082–1087. doi: 10.1093/ajcn/72.5.1082. [DOI] [PubMed] [Google Scholar]
- 4.Collins A.R., Horvathova E. Oxidative DNA damage, antioxidants and DNA repair: applications of the comet assay. Biochem. Soc. Trans. 2001;29:337. doi: 10.1042/0300-5127:0290337. [DOI] [PubMed] [Google Scholar]
- 5.Singh N.P., McCoy M.T., Tice R.R., Schneider E.L. A simple technique for quantitation of low levels of DNA damage in individual cells. Exp. Cell Res. 1988;175:184–191. doi: 10.1016/0014-4827(88)90265-0. [DOI] [PubMed] [Google Scholar]
- 6.Collins A.R. The comet assay for DNA damage and repair: principles, applications, and limitations. Mol. Biotechnol. 2004;26:249–261. doi: 10.1385/MB:26:3:249. [DOI] [PubMed] [Google Scholar]
- 7.Olive P.L., Banáth J.P. The comet assay: a method to measure DNA damage in individual cells. Nat. Protoc. 2006;1:23–29. doi: 10.1038/nprot.2006.5. [DOI] [PubMed] [Google Scholar]
- 8.Ostling O., Johanson K.J. Microelectrophoretic study of radiation-induced DNA damages in individual mammalian cells. Biochem. Biophys. Res. Commun. 1984;123:291–298. doi: 10.1016/0006-291x(84)90411-x. [DOI] [PubMed] [Google Scholar]
- 9.Olive P.L., Wlodek D., Banáth J.P. DNA double-strand breaks measured in individual cells subjected to gel electrophoresis. Cancer Res. 1991;51:4671–4676. [PubMed] [Google Scholar]
- 10.Pfuhler S., Wolf H.U. Detection of DNA-crosslinking agents with the alkaline comet assay. Environ. Mol. Mutagen. 1996;27:196–201. doi: 10.1002/(SICI)1098-2280(1996)27:3<196::AID-EM4>3.0.CO;2-D. [DOI] [PubMed] [Google Scholar]
- 11.Kumaravel T.S., Vilhar B., Faux S.P., Jha A.N. Comet assay measurements: a perspective. Cell Biol. Toxicol. 2009;25:53–64. doi: 10.1007/s10565-007-9043-9. [DOI] [PubMed] [Google Scholar]
- 12.Jha A.N. Ecotoxicological applications and significance of the comet assay. Mutagenesis. 2008;23:207–221. doi: 10.1093/mutage/gen014. [DOI] [PubMed] [Google Scholar]
- 13.Dusinska M., Collins A.R. The comet assay in human biomonitoring: gene–environment interactions. Mutagenesis. 2008;23:191–205. doi: 10.1093/mutage/gen007. [DOI] [PubMed] [Google Scholar]
- 14.Olive P.L. Impact of the comet assay in radiobiology. Mutat. Res. 2009;681:13–23. doi: 10.1016/j.mrrev.2007.11.001. [DOI] [PubMed] [Google Scholar]
- 15.Wasson G.R., McKelvey-Martin V.J., Downes C.S. The use of the comet assay in the study of human nutrition and cancer. Mutagenesis. 2008;23:153–162. doi: 10.1093/mutage/gen003. [DOI] [PubMed] [Google Scholar]
- 16.McKenna D.J., McKeown S.R., McKelvey-Martin V.J. Potential use of the comet assay in the clinical management of cancer. Mutagenesis. 2008;23:183–190. doi: 10.1093/mutage/gem054. [DOI] [PubMed] [Google Scholar]
- 17.Konca K., Lankoff A., Banasik A., Lisowska H., Kuszewski T. A cross-platform public domain PC image-analysis program for the comet assay. Mutat. Res. 2003;534:15–20. doi: 10.1016/s1383-5718(02)00251-6. [DOI] [PubMed] [Google Scholar]
- 18.CometScore Comet Scoring Software, Version 1.5, TriTek Corp. Available: 〈http://autocomet.com/〉, Accessed: 5.10.12.
- 19.Helma C., Uhl M. A public domain image-analysis program for the single-cell gel-electrophoresis (comet) assay. Mutat. Res. 2000;466:9–15. doi: 10.1016/s1383-5718(99)00232-6. [DOI] [PubMed] [Google Scholar]
- 20.Sharma A.K., Soussaline F., Sallette J., Dybdahl M. The influence of the number of cells scored on the sensitivity in the comet assay. Mutat. Res. 2012;749(1-2):70–75. doi: 10.1016/j.mrgentox.2012.07.003. [DOI] [PubMed] [Google Scholar]
- 21.Böcker W., Rolf W., Bauch T., Müller W.U., Streffer C. Automated comet assay analysis. Cytometry. 1999;35:134–144. [PubMed] [Google Scholar]
- 22.Frieauff W., Hartmann A., Suter W. Automatic analysis of slides processed in the comet assay. Mutagenesis. 2001;16:133–137. doi: 10.1093/mutage/16.2.133. [DOI] [PubMed] [Google Scholar]
- 23.Dehon G., Catoire L., Duez P., Bogaerts P., Dubois J. Validation of an automatic comet assay analysis system integrating the curve fitting of combined comet intensity profiles. Mutat. Res. 2008;650:87–95. doi: 10.1016/j.mrgentox.2007.08.013. [DOI] [PubMed] [Google Scholar]
- 24.Stang A., Brendamour M., Schunck C., Witte I. Automated analysis of DNA damage in the high-throughput version of the comet assay. Mutat. Res. 2010;698(1):1–5. doi: 10.1016/j.mrgentox.2010.02.014. [DOI] [PubMed] [Google Scholar]
- 25.Sansone M., Zeni O., Esposito G. Automated segmentation of comet assay images using Gaussian filtering and fuzzy clustering. Med. Biol. Eng. Comput. 2012;50:523–532. doi: 10.1007/s11517-012-0882-z. [DOI] [PubMed] [Google Scholar]
- 26.Stuurman N., Amdodaj N., Vale R. Micro-Manager: open source software for light microscope imaging. Microsc. Today. 2007;15:42–43. [Google Scholar]
- 27.Huang L.K., Wang M.J. Image thresholding by minimizing the measures of fuzziness. Pattern Recognit. 1995;28:41–51. [Google Scholar]
- 28.Acharya T., Ray A.K. Wiley-Interscience; Hoboken, NJ: 2005. Image processing: principles and applications. [Google Scholar]
- 29.Kumaravel T.S., Jha A.N. Reliable comet assay measurements for detecting DNA damage induced by ionising radiation and chemicals. Mutat. Res. 2006;605:7–16. doi: 10.1016/j.mrgentox.2006.03.002. [DOI] [PubMed] [Google Scholar]
- 30.Olive P.L., Banáth J.P., Durand R.E. Heterogeneity in radiation-induced DNA damage and repair in tumor and normal cells measured using the “comet” assay. Radiat. Res. 1990;122:86–94. [PubMed] [Google Scholar]
Associated Data
This section collects any data citations, data availability statements, or supplementary materials included in this article.
Supplementary Materials
Supplementary Figure 1. OpenComet live analysis. OpenComet can analyze images captured from a microscope using the live analysis functionality. Micro-Manager is first configured to stream live images through a camera attached to the microscope used in the comet assay experiment. A still image can be snapped by Micro-Manager. By clicking the Live button on the OpenComet interface, the tool analyzes the image saves 17 the measurement results
Supplementary Figure 2. OpenComet analysis of tail moments on alkaline comet assay images. (A) shows sample images of treated and control cells at 5 time points of measurement. The tail moment statistics are plotted as determined by OpenComet (B) and manual scoring (C). Manual scoring was performed using CometScore [18].
Supplementary Figure 3. OpenComet analysis of tail moments on neutral comet assay images. We used OpenComet to analyze neutral comet assay images of industrial standard damaged cells (A). OpenComet captured the increasing trend in the amount of DNA damage across NC0-NC3 cells (B).
Supplementary Figure 4. OpenComet validation on sample images from other comet assay analysis software. All sample images are analyzed by OpenComet and the marked output image is displayed (A-C). (A) Image from CometScore [18], analyzed with default settings. (B) Image from CaspLab [17], analyzed with head finding based on profile analysis. (C) Image obtained from an example comet assay pipeline for CellProfiler available at http://www.cellprofiler.org/examples.shtml, analyzed with default settings and without background correction.