

Abstract
The recognition events that mediate adaptive cellular immunity and regulate antibody responses depend on intercellular contacts between T cells and antigen presenting cells (APC)1. T cell signaling is initiated at these contacts when surface-expressed antigen receptors (TCR) recognize peptide fragments (antigens) of pathogens bound to Major Histocompatibility Complex molecules (pMHC) on APCs. This, along with engagement of adhesion receptors, leads to the formation of a specialized junction between T cells and APCs, known as the immunological synapse (IS)3, which mediates efficient delivery of effector molecules and intercellular signals across the synaptic cleft2. T cell recognition of pMHC and the adhesion ligand Intercellular Adhesion Molecule-1 (ICAM-1) on supported planar bilayers recapitulates the domain organization of the immunological synapse (IS)4–5, which is characterized by central accumulation of TCR5, adjacent to a secretory domain3, both surrounded by an adhesive ring4–5. Although accumulation of TCR at the IS center correlates with T cell function4, this domain is itself largely devoid of TCR signaling activity5–6, and is characterized by an unexplained immobilization of TCR-pMHC complexes relative to the highly dynamic IS periphery4–5. Here we show that centrally accumulated TCR is located on the surface of extracellular microvesicles that bud at the IS center. Tumor susceptibility gene 101 (TSG101)6 sorts TCR for inclusion in microvesicles, while vacuolar protein sorting 4 (VPS4) 7–8 mediates scission of microvesicles from the T cell plasma membrane. The HIV polyprotein GAG co-opts this process for budding of virus-like particles. B cells bearing cognate pMHC receive TCR from T cells and initiate intracellular signals in response to isolated synaptic microvesicles. We conclude that the immunological synapse orchestrates TCR sorting and release in extracellular microvesicles. These microvesicles deliver transcellular signals across antigen-dependent synapses by engaging cognate pMHC on APC.
The nature of the biophysical environment that governs molecular domain organization at the IS center remains unclear. Confinement of pMHC4, TCR5 and cytoplasm (Supplementary Fig. 1) suggests that a general diffusion barrier separates TCR and cytoplasm at the IS center from the rest of the T cell. To better understand the basis for the observed central confinement of pMHC, TCR and cytoplasm at the IS, we investigated CD4+ T cell IS formation using high resolution optical imaging, by total internal reflection fluorescence microscopy (TIRFM), integrated with transmission electron microscopy (TEM), and electron tomography.
Murine AND T cells form TCR microclusters in response to engagement by the cognate class II pMHC molecule I-Ek complexed with the moth cytochrome C peptide MCC 88–103 (MCC/I-Ek)6. Over ~10 minutes, TCR microclusters, together with bound pMHC4–6,9, are transported on the cell surface9 to the IS center, where they are consolidated into an immobilized domain6. To follow ultrastructural changes associated with IS formation, AND T cells were fixed after 5, 10, 15 and 20 minutes of interaction with supported lipid bilayers containing MCC/I-Ek and ICAM-1, and imaged first by TIRFM and then by TEM. As a control, we used the non-cognate pMHC β2m/I-Ek, which did not arrest motility or induce IS formation in AND T cells (Supplementary Fig. 2a). TEM time-series of AND T cells forming IS on antigen-containing bilayers revealed changes in cell morphology that were characteristic of antigen-induced cell polarization (Supplementary Fig. 2b–d). Strikingly, at the 10 minute time-point, the center of the T cell contact interface displayed an unexpected change in morphology, from a planar plasma membrane in continuous close apposition with the planar bilayer (Fig. 1 a) to the appearance of numerous microvesicles (Fig. 1 b and Supplementary Fig. 2e), ~70 nm in diameter (Supplementary Fig. 3a), that were contained within a central extracellular cavity (Fig. 1 b). Microvesicle formation was antigen-specific, as they did not form with bilayers containing β2m/I-Ek (Fig. 1 a and Supplementary Fig. 2e), and could be modulated by the potency of the activating ligand, or by provision of costimulation10 (Fig. 1 f and Supplementary Discussion). To more clearly visualize the distribution of microvesicles and verify their dissociation from the plasma membrane, we performed dual-axis tomography (Supplementary Video 1) on four serial sections through the IS, each ~150–250 nm in thickness. The associated three-dimensional model (Fig. 1 c–e and Supplementary Videos 2–3) of the joined tomograms demonstrated that discrete extracellular microvesicles, with no connection to overlying plasma membrane (Supplementary Fig. 4a–b), predominate in the central cavity, along with, and occasional membrane projections and membrane buds of nascent microvesicles (Supplementary Fig. 4c–i).
Figure 1. Antigen-induced release of TCR-enriched microvesicles at the center of IS.

a., b. Transmission electron micrographs of AND T cells interacting with supported lipid bilayers (SLB) containing ICAM-1, and the indicated pMHC (underlined). Inset, low magnification images of the same cells. Scale bar, 500 nm; inset scale bar, 2 μm; red arrowheads, extracellular microvesicles; white arrowheads, plasma membrane. c. A three-dimensional ultrastructural model of the IS center. The model was constructed from dual-axis tomograms of 4 serial sections of a single IS (numbered in d.). MVB, Multivesicular body; ILV, intraluminal vesicle; scale bar 250 nm. d. Model in c. with intracellular components and plasma membrane removed. Scale bar, 250 nm. e. Model in d. rotated 90° in the x-axis. Examples of an extracellular microvesicle (i), tethered vesicle (ii), and plasma membrane projection (iii) are indicated. Dotted lines, section boundaries; scale bar, 250 nm. f. Quantitation of microvesicle production by AND T cells in response to MCC/I-Ek (100 molec./ μm2) or the weak agonist K99A/I-Ek (100 molec./ μm2), or with additional costimulation provided by CD80 and CD48 on bilayers (200 molec./ μm2 for both). Microvesicle production by OTII T cells, in response to OVA/I-Ab pMHC ligand (100 molec./ μm2), was also measured. N is indicated above bars. Results are pooled from two independent experiments. g. Overlay of TCR (red) and F-actin (green) fluorescence in TIRFM images of the AND T cell IS. Scale bar, 3 μm. h. A three-dimensional model of the IS center constructed from an electron-tomogram of the first en face section of the cell interface in g.. T cell plasma membrane, green; microvesicles, orange. The model is overlayed on a slice of the segmented en face tomogram, and shown separately in i.. (scale bar in l., 500 nm., which also applies to h.–i. and m.–o.). Overlay of TCR (j.) and F-actin (k.) fluorescence in g., shown as a heat map, with the en face electron micrograph of the same cell. White dashed boxes and asterisk in g., j.–k. indicate the orientation of the IS center in relation to the tomogram and model overlays in h.–i., and l.–o.. l.–m (asterisk position indicated in i.). Overlay of microvesicles modeled in i. (white), scaled and aligned with the TCR fluorescence in j. (l.) and F-actin in k. (m.). n.–o. Overlay of the T cell plasma membrane in modeled in i. (white) scaled and aligned with the TCR fluorescence in j. (n.) and F-actin in k. (o.).
Comparison of the distributions of TCR and microvesicles at the IS demonstrated that they were spatially correlated (Supplementary Fig. 3b–d). To establish whether TCR present at the IS center was associated with microvesicles, we developed a novel method for optical-EM correlation, based on registration of TIRFM and ‘en face’ TEM images of the IS (Supplementary Fig. 5). Electron tomography of en face sections of T cell-bilayer interfaces confirmed the presence of microvesicles within a roughly circular extracellular cavity at the IS center (Fig. 1 h,i and Supplementary Videos 4–5). Optical-EM correlation then allowed us to assign molecular distributions to IS ultrastructure in en face sections. This revealed that TCR fluorescence at the IS (Fig. 1 g,j) corresponded almost exclusively to extracellular microvesicles contained within the cavity at the IS center (Fig. 1 l,n). The characteristic F-actin depletion at the IS center11 (Fig. 1 g,k) is also circumscribed by the plasma membrane boundary of the central cavity (Fig. 1 o), reflecting interruption of cytoplasmic continuity at the IS center. The annular ICAM-1/LFA-1 adhesive domain, which surrounds centrally accumulated TCR (and associated MCC/I-Ek), is wholly contained within the plasma membrane border of the central cavity (Supplementary Fig. 6), which effectively precludes membrane-tethered LFA-1 from binding ICAM-1 at the IS center. Our finding that TCR is present in extracellular microvesicles also accounts for the inability of centrally accumulated TCR to exchange with TCR elsewhere in the T cell (Supplementary Fig. 1 a–b), and for the confined cytoplasmic diffusion observed at the IS center (Supplementary Fig. 1 c).
After 30–45 minutes, AND T cells break IS symmetry and resume motility12. Migrating T cells left behind 80% of TCR in particles on the bilayer (Supplementary Figs. 7a,c, and 8a, and Supplementary Video 6). Optical-EM correlation of AND T cells resuming motility after IS formation confirmed that these particles were extracellular TCR-enriched microvesicles released from the IS center (Fig. 2a,b). The microvesicles diffused apart, which allowed us to characterize their composition by indirect immunofluorescence labeling and TIRFM (Supplementary Fig. 8b). TCR-enriched microvesicles were devoid of tyrosine phosphorylation (Fig. 2c), consistent with termination of TCR signaling. TCR-enriched microvesicles clustered MCC/I-Ek, but not β2m/I-Ek, on bilayers (Fig. 2d and Supplementary Figs. 7 d and 9), establishing that TCR was on the external surface of microvesicles and was capable of binding cognate pMHC.
Figure 2. TCR-enriched microvesicles are post-signaling extracellular products of T cell activation that retain pMHC-binding competence.

Optical-EM correlation of sessile AND T cells forming an IS in response to MCC/I-Ek and ICAM-1 (a.) and resuming motility (b.), showing the distributions of F-actin (green) and TCR (red) in relation to released microvesicles deposited on the bilayer (arrowheads). Scale bar 4 μm. c. Quantitation of phosphotyrosine (pY) fluorescence intensity in arbitrary units (AU) of released TCR-enriched microvesicles (V) and their originating cells (C) detected by indirect immunofluorescence labeling and TIRFM. d. Enrichment of fluorescently labeled cognate MCC/I-Ek or non-binding β2m/I-Ek by released TCR-enriched microvesicles. Fold pMHC enrichment is defined as: (pMHC fluorescence intensity colocalized with TCR-enriched microvesicles)/ (free bilayer pMHC fluorescence intensity). Error bars represent s.e.m.
To investigate the mechanism by which microvesicles were produced, we next studied the role of the endosomal sorting complex required for transport (ESCRT) I member TSG101, which was previously implicated in ubiquitin-dependent sorting of TCR to the IS center6. ESCRT I proteins, such as TSG101, typically carry out the first in a series of steps leading to vesicle budding and fission13. We suppressed TSG101 expression in AND T cells by small interfering RNA (siRNA), and treated cells with non-targeting small oligo-RNA (sRNA) as a control (Supplementary Fig. 10a). As expected, AND T cells, in which TSG101 expression was suppressed, failed to translocate TCR, and bound MCC/I-Ek, to the IS center, while central TCR accumulation was unaffected by treatment with control sRNA (Supplementary Fig. 10 b,c). Optical-EM correlation revealed that suppression of TSG101 resulted in accumulation of TCR, together with bound MCC/I-Ek, in a ring around the central cavity at the IS center (Fig. 3a) while treatment with control sRNA had no effect on TCR incorporation into microvesicles (Supplementary Fig. 10 d). Suppression of TSG101 reduced, but did not abolish, microvesicle production (Supplementary Fig. 11). Notably, the remaining microvesicles present at the IS center were devoid of TCR, demonstrating that TSG101 was necessary for sorting of TCR into microvesicles (Fig. 3a).
Figure 3. Biogenesis of TCR-enriched microvesicles is mediated by ESCRT proteins and antagonized by HIV GAG.

a. Optical-EM correlation of TCR and and MCC/I-Ek distributions of a representative AND T cell following siRNA-mediated TSG101 suppression. Scale bar 3 μm. b. Electron micrographs of en face sections of human CD4+ T cells forming IS in response to TCR engagement. Cells were transfected with a construct encoding dominant negative VPS4 fused to GFP (VPS4dn-GFP) or GFP only. Red boxes and arrowheads indicate regions imaged at higher magnification in right panels. Arrowheads in c. indicate nascent vesicles tethered to the plasma membrane. d. Quantitation of limiting membrane-tethered microvesicles expressed as a percentage of total microvesicles within central compartments of the IS in cells expressing indicated constructs. Means and s.d. are shown, P value is for Student’s t-test. N is indicated above data bars. Results are pooled from two independent experiments. e–g. Representative optical-EM correlation of the IS in human CD4+ T cells transfected with a construct encoding HIV GAG fused to GFP (GAG-GFP, green). Red, TCR; scale bar, 3 μm. e. T cell without central GAG-GFP accumulation resuming migration and releasing TCR-enriched microvesicles (arrowhead). f. T cell forming an IS with centrally accumulated GAG-GFP. g. T cell with centrally accumulated GAG-GFP resuming motility and releasing GAG-GFP-containing microvesicles (arrowheads). h. Higher magnification image of boxed region in g. showing internal juxta-membrane density in GAG-containing microvesicles. Arrowhead, plasma membrane; scale bar, 500 nm.
We went on to investigate the role of the ESCRT III complex, which is responsible for the final steps in vesicle fission. We used primary human CD4+ T cells which, like AND murine T cells, produce TCR-enriched microvesicles at the IS center (Supplementary Fig. 12). We transfected human CD4+ T cells with a construct encoding a dominant-negative mutant of human VPS4 (E228Q), that prevents ATP binding, fused to GFP (VPS4dn-GFP)13. Expression of VPS4dn-GFP disrupts the function of endogenous VPS413, which binds to and catalytically disassembles14 membrane-associated ESCRT III oligomers and is thought to be obligatory for sustaining membrane budding reactions15–16. As a control, we transfected human CD4+ T cells with a construct encoding GFP alone. Control T cells formed microvesicles at the IS center, the majority of which were separated from the limiting plasma membrane of the central cavity (Fig. 3b,d). In marked contrast, the IS of VPS4dn-GFP transfected T cells contained nascent microvesicles, within a fragmented central compartment, which remained tethered to the limiting plasma membrane (Fig. 3b–d) at constricted bud necks (Fig 3c). Consistent with the role of VPS4 ‘downstream’ of early acting ESCRTs, VPS4dn-GFP did not affect TCR sorting to the IS center (Supplementary Fig. 13), although its distribution at the IS was altered when compared to wild-type VPS4 (Supplementary Fig. 14). These observations suggest that VPS4 is involved in fission of TCR-rich membrane buds, thereby producing TCR-enriched microvesicles at the IS center13,17.
The ESCRT pathway is also exploited by the HIV structural polyprotein GAG8,13 for membrane budding and release of HIV from the plasma membrane of infected cells. This prompted us to test whether GAG might interfere with the biogenesis of TCR-enriched microvesicles in human CD4+ T cells. We expressed a construct encoding GAG fused to GFP (GAG-GFP) in primary human CD4+ T cells, and analyzed IS formation by optical-EM correlation. Transfected T cells adhered poorly to supported bilayers containing ICAM-1 alone, with small GAG-GFP puncta present throughout the contact interface (Supplementary Fig. 15b–c). Strikingly, TCR engagement lead to robust recruitment of GAG-GFP to the contact interface (Supplementary Fig. 15b–c), where it accumulated at the IS center, displacing TCR (Fig. 3f and Supplementary Fig. 15d–e), and resulting in the release of GAG-GFP containing microvesicles, which are analogous to virus like particles (VLP) that are produced during HIV infection (Fig. 3g,h and Supplementary Fig. 15f–g). Conversely, in T cells with low GAG-GFP expression, TCR accumulated normally at the IS center (Supplementary Fig. 15d–e), resulting in the release of TCR-enriched microvesicles (Fig. 3e and Supplementary Fig. 15f–g). The ESCRT-binding domain of GAG is required for its recruitment and central accumulation at the IS following TCR engagement (Supplementary Fig. 16 and Supplementary Discussion). Taken together, these findings suggest that GAG antagonizes ESCRT-dependent sorting of TCR into microvesicles, and in this context TCR ligation direct the polarized budding of VLPs at the center of the IS.
To verify that microvesicles played a physiological role in cellular interactions, we next asked whether AND T cells produce TCR-enriched microvesicles in conjugates with antigen-bearing B cells. As expected, AND T cells readily accumulated TCR at the IS center in conjugates with MCC-pulsed congenic B10.Br B cells (Supplementary Fig. 17 a–b). In ~40% of T-B cell conjugates (Fig. 4b), small puncta of TCR could be detected in B cells ‘distal’ to the IS, consistent with T-B synaptic transfer of TCR-containing microvesicles, while no T cell polarization or TCR transfer was detected in conjugated B cells pulsed with β2m peptide (Supplementary Fig. 17a–b). Since TSG101 is critical for the production of TCR-enriched microvesicles in the planar bilayer model, we next investigated whether TCR transfer to live B cells is affected by siRNA-mediated suppression of TSG1016. In conjugates of TSG101-suppressed AND T cells and MCC-pulsed B cells, transfer of TCR was reduced by ~80% (Fig. 4a–b), relative to conjugates treated with control sRNA, despite effective TCR polarization to the IS (Supplementary Fig. 17 b). As previously described, transfer of pMHC from B-T cell was also observed (Fig. 4a,c and Supplementary Fig. 17 a)18–19. However, this was unaffected by TSG101 silencing in the T cell (Fig. 4a,c), demonstrating that TSG101 selectively controls TCR transfer to B cells during bidirectional membrane exchange in T-B cell conjugates19.
Figure 4. TSG101 selectively controls TCR transfer to B cells which signal in response to pMHC engagement by microvesicle-tethered TCR.
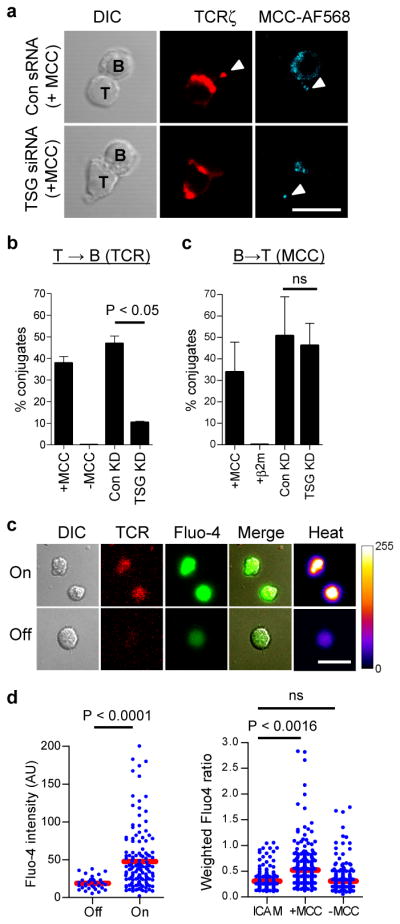
a. Confocal microscopy of AND T cells, treated with TSG101 suppressing siRNA (TSG siRNA) or control oligo-RNA (Con sRNA), forming conjugates with congenic splenic B cells loaded with fluorescent MCC peptide (cyan). T = 30 min.; red, TCRζ; arrowheads, transferred TCR and fluorescent MCC peptide; scale bar, 10 μm. b. Quantitation of TCR transfer to B cells in T-B conjugates. c. Quantitation of MCC peptide transfer to T cells in T-B conjugates. Means from three independent experiments are shown in b.–c. error bars represent s.d. d. Live B cells loaded with calcium-sensitive fluorescent dye Fluo-4 were imaged by confocal microscopy on bilayers containing deposited TCR-enriched microvesicles (T = 30 min.). Panels show DIC and fluorescence images of TCR-enriched microvesicle patches on bilayers (red) and Fluo-4 fluorescence in B cells (green and heat map). Shown are examples of B cells interacting with TCR-containing microvesicles (On), or on bilayer areas without detectable TCR-enriched microvesicles (Off). Scale bar, 10 μm. e. Quantitation of Flou-4 fluorescence intensity of B cells ‘On’ or ‘Off’ TCR-enriched microvesicles. Data are representative of two experiments. f. Quantitation of Fluo-4 intensity of B cells pulsed with MCC peptide or without antigen, after 30 min incubation on bilayers containing ICAM-1 alone, or with bilayers containing deposited TCR-enriched microvesicles. Fluorescence values were divided by the mean Flou-4 intensity of B cells treated with 1 μM ionomycin at the end of the experiment. Data pooled from two independent experiments. Blue dots, fluorescence intensity in individual cells; red bars, sample mean; P value, one-way ANOVA corrected for all comparisons.
We next asked whether isolated microvesicles induce signaling in antigen-presenting B cells. Engagement of MHC II molecules on B cells triggers tyrosine phosphorylation and intracellular calcium signaling, by coupling to the B cell antigen receptor signaling machinery20, resulting in cell proliferation in primed B cells21. We therefore asked whether B cells presenting cognate MCC/I-Ek complexes are activated by specific TCR present on microvesicles. We introduced B cells, loaded with the Ca2+-sensitive dye Fluo-4, onto bilayers containing TCR-enriched microvesicles, from which T cells had been removed (Supplementary Fig. 17c), and monitored Ca2+ signaling by confocal microscopy (Fig. 4d and Supplementary Fig. 17d). B cells pulsed with MCC were motile on bilayers, but stopped and displayed sustained increase in intracellular Ca2+ on encountering TCR-enriched microvesicle patches on bilayers (Fig. 4d–e). In contrast, B cells not loaded with MCC did not display an increase in Ca2+ relative to controls (i.e., cells on bilayers with ICAM-1 alone, Fig. 4f). Thus, B cell signaling by pMHC is initiated by cognate recognition of TCR on microvesicles. In support of a role for TCR-enriched microvesicles during human T-B cell interaction, we find that Raji B cells, in superantigen-induced conjugates with human CD4+ T cells22, receive TCR puncta that activate phospholipase Cγ1 (PLCγ1) - a key mediator of intracellular Ca2+ signaling23 (Supplementary Fig. 18).
Our finding that the IS center is an extracellular cavity, filled with TCR-enriched microvesicles by an ESCRT-dependent mechanism, provides a fundamentally new paradigm for supramolecular domain organization at the IS (Supplementary Fig. 19a). Shedding of TCR in microvesicles constitutes a novel mechanism for TCR ‘down-regulation’, following engagement by pMHC, that acts in parallel with receptor internalization24. Our observations raise the possibility that other immune cells known to accumulate immunoreceptors at the synapse center, such as B25 and NK26 cells, may also release them in microvesicles for intercellular communication. Cognate recognition of TCR-enriched microvesicles by pMHC on B cells may provide ‘help’ to B cells that is calibrated to the pMHC density present on their surface, pointing to a plausible mechanism for avidity-adjusted delivery of T cell help to B cells27. Finally, we find that TCR-enriched microvesicle biogenesis is a native pathway in T cells, triggered by antigen-recognition, that may be co-opted by HIV proteins for polarized retroviral transmission at antigen-dependent immunological synapses (Supplementary Fig. 19b).
Methods
Proteins, peptides, and antibodies
Soluble I-Ek-his12 and ICAM-1-his12 were expressed in insect cells (S2) and isolated by affinity and FPLC purification as previously described6,28. All fluorophores for amine and maleimide coupling were purchased from Molecular Probes (Invitrogen). ICAM-1 was amine labeled using SE-Cy5 or SE-AF405. MCC, K99A and β2m peptides were synthesized by FMOC chemistry and single AF488, AF633 and AF568 SE fluorophores were attached at their amino-termini before side-chain deprotection, TFA cleavage from resin, and HPLC purification. Peptide labeling with fluorophores was confirmed by mass spectrometry and purity was > 98%. Loading of peptides onto I-Ek-his12 was performed under acidic conditions as previously described5, and MCC/I-Ek-his12 complexes purified by FPLC, yielding f/p ratios of 0.7–1.1. HLA-DR4 was expressed purified, refolded in vitro with HA peptide, and BirA biotinylated as previously described29. Fab′ fragments of mouse TCRβ-specific antibody H57 was produced by papain cleavage and purified by ion-exchange chromatography5. Fab′ fragments of human CD3ε-specific antibody UCHT1 were produced by pepsin cleavage to F(ab′)2 fragments, reduced with 0.5 mM β-mercaptoethanol to yield Fab′ fragments with free (cysteine) thiols at their C-termini, and conjugated to biotin-maleimide (Pierce) to yield monobiotinylated Fab′ fragments. Monobiotinylated UCHT1 Fab′ fragments were labeled with SE Alexa fluorophores at f/p ratio of ~3, and used in bilayers to engage and follow engaged TCR at the IS of human T cells29. Monobiotinylation of mouse CD3ε-specific antibody 2C11 was performed as previously described30. Mouse TCRζ-specific monoclonal antibody H146 was amine-labeled with SE AF633. Secondary antibodies and F(ab′)2 fragments, fluorescently labeled streptavidin and phalloidin (Molecular Probes, Invitrogen), rabbit polyclonal antibody to ZAP-70 and β-actin (Cell Signaling Technology), mouse monoclonal antibody 4G10 against phosphor-tyrosine labeled with AF488 (Millipore), anti-TSG101 and anti-CD81 rabbit polyclonal antibodies (Santa Cruz Biotechnology) were purchased and used as per the vendor’s instructions for immunofluorescent labeling and Western blots. Duramycin-linked biotin (DLB), was used in conjunction with fluorescently labeled streptavidin (Invitrogen) to detect phosphatidylethanolamine (PE), and fluorescently labeled annexin V (Invitrogen) was used to label phosphatidylserine (PS). Secondary antibodies for infra-red detection in Western blots were from LI-COR Biosciences.
Mice, cells, and cell purification
Mice used in this work were housed under pathogen-free conditions in the Skirball Institute Central Animal Facility in accordance with local and NIH regulations, and euthanized according to the guidelines of the Panel on Euthanasia of the American Veterinary Medical Association. AND.B10 and B10.Br mice were mated, and F1 progeny used for experiments at 6–8 weeks of age3. Spleens and lymph nodes from F1 AND mice were macerated and, following RBC lysis, incubated with 3 μM MCC peptide and 50 U recombinant human IL-2 in complete OK-DMEM media to expand T cells. AND CD4+ T cells were purified from cultures at day 4 of culture for siRNA suppression, or day 6 for all other experiments, by negative selection using mouse CD4+ T cell isolation kit II (Miltenyi Biotec) (purity was > 95%). B cells were isolated from macerated spleens harvested from B10.Br mice using anti-mouse CD43 and CD4 magnetic beads for negative selection (Miltenyi Biotec), yielding > 98% CD19+ B cells. B cells were incubated overnight with 100 ng/ml LPS (Sigma) and 50 μM of the indicated peptides for T cell conjugation and Ca2+ experiments. Spleens and lymph nodes from PA-GFP mice, that express a photo-activatable mutant of GFP31 in all haematopoeitic cells27, were macerated through a 40 μm sieve, and CD4+ T cells purified from released cells by negative selection. PA-GFP CD4+ T cells were incubated for 6 days in OK-DMEM media, with 50 U recombinant IL-2, in anti-mouse CD3/CD28 antibody coated flat-bottomed microtiter plates. Human polyclonal CD4+ T cells were isolated by negative selection (RosetteSep, Stemcell Technologies) from peripheral blood leukapheresis fractions from healthy donors (New York Blood Center). Cell purity, as determined by anti-CD4/CD3 antibody labeling and flow-cytometry was > 95%. Freshly isolated polyclonal human CD4+ T cells were rested overnight in complete RPMI supplemented with pyruvate, and either transfected and sorted by FACS, or used directly for experiments, within 48 hrs of isolation. Human influenza hemagglutinin peptide-specific CD4+ T cell clone HA:D729 was expanded for 10 days using irradiated human PBMC in complete media with 5 U/ml IL-2, 2 μg/ml PHA, 10% FBS and 1% human serum.
Plasmids, cell transfection, cell sorting, and siRNA suppression
Details of human GAG-GFP, VPS-4-GFP, VPS4dn-GFP 13, ALIX-GFP, CHMP4B-GFP9, GAG-mCherry and the L-domain mutant of GAG fused to mCherry33 have been described previously. Freshly isolated human CD4+ T cells were transfected with 5–8 μg of plasmid DNA, prepared using Purelink HiPure Maxiprep kits (Invitrogen), using program U-014 of an Amaxa II nucleoporator and human T cell nucleofection reagents (Lonza) as recommended by the manufacturer. Transfected cells were sorted for GFP expression by FACS (BD FACSAria II) using a 100 μm nozzle, fitted with a receptacle cooled to 4°C. Sorted cells were rested for 4–8 hrs in complete RPMI, and used for experiments within 24 hrs of transfection. Methods used for siRNA mediated TSG101 suppression in AND T cells, including RNA sequences and targeting validation, are described in detail elsewhere6. Briefly, AND CD4+ T cells were purified at day 4 of expansion and nucleoporated with 200 nM of targeting siRNA or non-targeting control oligo-RNA using program X001 on an Amaxa II Nucleoporator and Nuclefection reagents for mouse T cells (Lonza). A second siRNA Nucleofection was performed after 48 hrs rest, and TSG101 levels in cells determined by Western blot 48 hrs after the second Nucleofection, and used in experiments.
Supported lipid bilayers
Preparation of liposomes and planar bilayer formation are described in detail elsewhere5,28. Briefly, for coupling of polyhistidine tagged ICAM-1 and pMHCs, equal volumes of DOPC liposomes (0.4 mM), and liposomes containing 25 mol% Ni2+-NTA-DGS and 75 mol% DOPC (0.4 mM) were mixed and deposited onto clean glass aqueducts of the FCS2 flow-chambers (Bioptechs). Lipid droplets were trapped by overlaying glass coverslips cleaned using peroxidated H2SO4. Chambers were flooded with supplemented Hepes buffered saline (20mM Hepes, 140 mM NaCl, 5mM KCl, 6 mM glucose, 1mM CaCl, 2 mM MgCl, 1% human serum albumin (HSA), pH 7.2), subsequently referred to as HBS/HSA, and flushed to remove excess liposomes, leaving deposited DOPC bilayers containing 12.5 mol% Ni2+-NTA-DGS. Bilayers were uniformly fluid as measured by photobleaching/recovery. Following blocking for 30 min with 5% casein supplemented with 100 μM NiCl2, to saturate NTA sites, fluorescently labeled (or unlabeled) pMHC and ICAM-1 were incubated on bilayers for 30 min with polyhistidine tagged proteins. Protein concentrations required to achieve desired densities on bilayers was calculated from calibration curves constructed from flow-cytometric measurements of bilayer-associated fluorescence of attached proteins on bilayers formed on glass beads, compared to reference beads containing known numbers of the appropriate fluorophore (Bangs Laboratories Inc.). For attachment of mono-biotinylated proteins and polyhistidine-tagged proteins, DOPC bilayers containing 12.5 mol% Ni2+-NTA-DGS and 0.05 mol% cap biotin PE were used. Unlabeled (Prozyme) or fluorescently labeled streptavidin (Molecular Probes) was then coupled to biotin headgroups, and following extensive washing, bilayers were incubated with biotinylated proteins at concentrations determined by bead calibration assays to measure bilayer densities of biotiniyated proteins. All lipids were purchased from Avanti Polar Lipids.
Microfabrication
Metal-patterned substrates were prepared using a standard lift-off approach34. Coverslips were spin-coated with a layer of 25kDa poly(methyl-methacrylate) (PMMA) followed by a second layer of PMMA, and finally a charge dispersion layer of Aquasave (Mitsubishi Rayon Co., New York, NY). The PMMA resist was patterned and developed using standard electron-beam lithography processes. A thin (8-nm) layer of Cr was then deposited onto the patterned surfaces using an electron beam evaporation system. The remaining PMMA and overlying metal were then removed in acetone, leaving a pattern of 20 μm × 20 μm grids, defined by lines of 3 μm width, on the coverslip surface.
Total internal reflection fluorescence microscopy (TIRFM)
A Nikon Ti microscope, controlled by Nikon Elements software was used for all TIRFM experiments. The instrument was fitted with: 100x TIRF objective - NA 1.49, Andor iXon EMCCD camera, 405 nm, 491 nm, 561 nm and 633 nm laser lines, appropriate CFP/FITC/Cy3/Cy5 emission filters, SRIC cube (IRM), a programmable mechanized stage, and infra-red autofocus (Perfect Focus). Cultured T cells were incubated in OK-DMEM media without IL-2 for 2 hrs, washed and resuspended at a density of 107 cells/ml in HBS/HSA equilibrated to 37°C, for injection into flow chambers prepositioned on the microscope stage and equilibrated to 37°C using a flow chamber heating adapter. For immunofluorescent labeling, all procedures were performed in flow-cells. T cells attached to lipid bilayers were fixed with 2% PFA for 10 min at 37°C and washed with PBS to remove fixative and, where necessary, permeabilized for 3 min with 0.1% saponin in PBS. Samples were washed, quenched with 50 mM glycine/PBS, and blocked for 1 hr with 5% BSA/PBS, before labeling with directly labeled antibodies, or unlabeled primary antibodies and appropriate fluorescently labeled secondary antibodies or F(ab′)2 fragments (Molecular Probes). For optical-EM correlation, lipid bilayers were formed on grid substrates deposited on coverslips (described above), resulting in square fluid bilayer patches within grids, surrounded by a continuous bilayer. T cells on grids were fixed as above, and imaged using overlapping fields by TIRFM. Following optical mapping of grids, coverslips were processed for electron microscopy as described below.
Sample preparation and sectioning for electron microscopy
T cells on supported lipid bilayers were fixed in flowcells by injecting a solution of 1% glutaraldehyde, 3% PFA, 0.3% tannic acid in 0.1 M cacodylate buffer, pH 7.4 for 1 hr at room temperature and processed for electron microscopy as previously described12. Flow chambers were disassembled and fixed cells on glass coverslips removed and post-fixed with 1% osmium tetroxide in 0.1M cacodylate buffer, pH 7.4 for 1 hr at room temperature. Samples were then dehydrated in a solution series containing 25–100% ethanol, and flat-embedded by placing upturned BEEM capsules containing liquid epoxy resin (Epon) over bilayer regions of coverslips. Capsules were stabilized with weights to ensure firm contact with coverslips, and cured at 60°C for 48 hrs. Capsules were detached from coverslips by immersion in liquid nitrogen, polymerized resin blocks isolated, which contained embedded T cells and underlying bilayers on the (macroscopically) flat surface previously in contact with the coverslip. Blocks were used directly for en face sectioning, acquired as described below, re-embedded in Epon to obtain cross-sectional views of the T cell-bilayer interface, in 200 nm sections collected, using a Leica UCT ultramicrotome, orthogonal to the plane of the embedded bilayer35. At least three serial sections of the same cell were used to determine the plane nearest to the cell center. To acquire en face sections for optical correlation, block sides were trimmed, without perturbing the block face, to a region ~1–2 mm2, containing grid impressions and bilayer-attached T cells. The sample block was positioned on the ultramicrotome sample holder with the block face parallel to the knife-edge in the sectioning plane (Supplementary Fig. 5a), and the sample advanced to acquire a 50 nm section from the block surface. Sections were gathered on 200 hex-mesh thin bar copper grids (EMS).
Transmission electron microscopy (TEM)
Conventional projection images were recorded on a Phillips CM12 transmission electron microscope, fitted with a Gatan 4k × 2.7k digital camera. Electron tomography data collection was performed in a system under the control of serialEM software. Dual tilt axis tomographic series (tilt angle ± 70°) were recorded at 200kV in a Tecnai F20 electron microscope at the New York Structural Biology Center. Images were acquired with a 4096 X 4096 CCD camera and binned by a factor of 2 at 8.85 nm pixel size. Image alignment and tomographic reconstructions were obtained using the Protomo software package. Fiducial-free single axis tomograms were combined using IMOD36 and tomogram segmentation performed using the Amira software package. Models were constructed and rendered from segmented tomograms in IMOD37. Tomograms of serial sections were aligned manually, guided by organelle membrane boundaries and the supported planar bilayer density. Segmentation and modeling was performed using IMOD38. Phagophore morphology was interpreted as previously described39.
Optical-EM correlation
Optical maps of T cells on grid bilayers acquired by TIRFM were used to screen en face sections of grid areas by electron microscopy at low magnification. The first 50 nm en face section containing the T cell-bilayer interface, but not subsequent sections, retained impressions from the 8 nm deep chrome grids, enabling location of individual cells in optical maps for high magnification imaging by electron microscopy and tomography. Fluorescence images were scaled to the same pixel dimensions of high magnification EM images and converted from 14-bit to 8-bit depth, preserving the aspect ratio of images. These images were then translated and rotated to match cell contours, and overlay of aligned images yielded optical-EM correlations40. We observed minor cell sample shrinkage in the peripheries of the cell contact interface, likely due to fixation/dehydration of EM samples, however, membrane contours within the contact center were very well preserved, likely due to stronger adhesion, and diminished membrane fluctuations with the bilayer substrate in this region. Tomogram models of the IS center were similarly processed to yield optical-tomogram correlations of the same cell.
Live confocal microscopy of Ca2+ signaling in B cells
Imaging was performed on a Zeiss LSM 510 confocal microscope. Live cell imaging was performed in FCS flow chambers maintained at 37°C using a heating adapter, within an environmental chamber equilibrated to 37°C. For Ca2+ imaging, LPS activated B cells (incubated with or without peptides) were incubated in neat RPMI with 4 μM Fluo-4 AM (invitrogen) for 20 min at 37°C, washed and incubated in complete RPMI for 20 min. Cells were resuspended in warmed HBS/HSA buffer at 5 × 10⁶/ml and introduced into heated flow chambers for intracellular Ca2+ imaging using 488/515-30 BP ex/em filters for Fluo-4 and 546/600 LP ex/em filters for detecting TCR, labeled with AF-568 conjugated H57 Fab′ fragments. Transmitted DIC images were recorded with 450 nm illumination. 8-bit images were acquired serially using an x40 oil objective, NA 1.3, at 1024 × 1024 pixel resolution. Flow chambers contained bilayers with ICAM-1 alone (200 molec./μm2), or containing isolated TCR-enriched microvesicle patches. To isolate TCR-enriched microvesicles on bilayers, AND T cells were allowed to form IS on bilayers containing MCC/I-Ek (100 molec./μm2) and ICAM-1 (200 molec./μm2) for 60 min, after which T were removed by washing flow chambers with cold HBS/HSA, that promotes de-adhesion by inactivating integrins. After screening to ensure removal of T cells, Fluo-4 loaded B cells were introduced into flow chambers, and imaged in contiguous fields after 30 min interaction with microvesicles, to survey B cell Ca2+ signaling, as measured by B cell Flou-4 fluorescence intensity, in response to TCR microvesicles. For some experiments, where imaging runs were separated by long periods, necessitating independent Fluo-4 loading of separate batches of B cells, 1 μM ionomycin was introduced in flow chambers to determine maximal Ca2+ levels, at the end of each imaging run. This allowed correction for differences in Flou-4 loading - expressed as individual B cell Fluo-4 fluorescence intensities/mean ionomycin induced fluorescence intensity - resulting in weighted Fluo-4 ratios.
Confocal microscopy of T-B cell conjugates
For experiments using murine T-B conjugates, LPS activated B cells (incubated with or without peptides) were mixed with equal numbers of AND T cells (treated with siRNA or untreated) in warmed OK-DMEM medium, and brought into contact by centrifugation at 250 g for 2 min. Cells were incubated at 37°C for 30 min, following which, media was aspirated and replaced with 2% PFA to fix cells. Cells were deposited on cleaned coverslips and permeabilized, blocked and labeled as for fluorescent labeling of TIRFM samples above, with extensive washing, by 6 exchanges with PBS, between each processing step. Following immunofluorescent labeling, coverslips were mounted on glass slides using Antifade Gold (Molecular Probes) and cured in the dark at room temperature for 24 hrs. Images of cell conjugates were acquired with an x63 Plan-Apochromat oil objective, NA 1.4.
For experiments involving human T-B conjugates, superantigen-specific CD4+ T cells were expanded from human PBMC by incubation with 100 ng/ml of the superantigen SEE (staphylococcal enterotoxin E, Toxin Technology Inc., USA) in complete RPMI media. Following culture at 37°C/5% CO2 for 5 days, CD4+ T cells were isolated by negative selections (EasySep, Stemcell Technologies), and expanded for a further 7–10 days with 10U/ml recombinant IL-2 (R&D Systems). Quiescent CD4+ T cells were mixed in 1:1 ratio with the human Raji B cells (ATCC CCL-86), which express HLA-DR, in the presence of 1μg/ml SEE to form superantigen induced conjugates. Cells were fixed in 3% PFA after 60 minutes incubation at 37°C, permeabilised and stained with primary antibodies against TCR CD3ε (clone OKT3) and an appropriate fluorescently labeled secondary antibody. For labeling of PLCγ1 phosphorylated at tyrosine 783 (Cell Signaling Technology) in addition to TCR, all incubations and labeling were performed in media/buffers containing 0.5 mM sodium orthovanadate. For selective inhibition of SYK tyrosine kinase in Raji B cells, cell conjugates were formed by gentle centrifugation, and incubated in complete RPMI for 30 minutes. Culture supernatant was then replaced, without disturbing cell pellets, with media containing 200 nM SYK inhibitor V (EMD Millipore), and cells incubated for a further 30 minutes at 37°C prior to fixing for antibody labeling. Confocal imaging was performed as for murine T-B conjugates.
Image processing
All fluorescence images were background subtracted. Measurements from TIRFM images were made at native 14-bit depth. For optical EM correlations, images were scaled and converted to 8-bit depth. Confocal images were acquired at 8-bit depth. Measurements were performed using Metamorph, ImageJ and Photoshop software. For presentation in figures, images were adjusted identically across related groups for brightness and contrast.
Statistical analysis
Linear regression, Student’s t-test, and one-way ANOVA (corrected for all pairwise comparisons) were performed using Prism software. P values < 0.05 were considered statistically significant, P values > 0.05 were considered not statistically significant and denoted as “n.s.” in figures. Pearson’s correlation coefficient (Rr) was calculated from corresponding interface regions from two channels in TIRFM images using ImageJ.
Supplementary Material
Acknowledgments
We thank Gerhard Schütz for suggesting the photoactivation experiment, Wes Sundquist for providing GAG-GFP and, VPS4-GFP, and VPS4dn-GFP constructs, Paul Bieniasz for GAG-mCherry, GAGΔL-mCherry, ALIX-GFP and CHMP4B-GFP constructs, staff at the New York Structural Biology Center for help with EM tomography, and members of the Dustin laboratory for helpful discussions. We thank Jeremy Nance for the gift of biotinylated DLB. This work as supported in part by a Cancer Research Institute fellowship and NIH grant K99AI093884 (K.C.), a Wellcome Trust Principal Research Fellowship (M.L.D.) and NIH grants AI043542, AI045757, AI055037, AI088377, AI093884 and EY016586 (Nanomedicine Development Center).
Footnotes
Author Contributions
K.C., M.L.D. and D.L.S. conceived the study, K.C. and J.L. designed and performed the experiments, E.W.G.R. performed en face sectioning, L.K. and J.T. designed and fabricated optical-EM reference grids, K.W.W. and S.G. made essential reagents, K.C. and M.L.D. wrote the manuscript. All authors edited the manuscript.
Supplementary Information is linked to the online version of the paper at www.nature.com/nature.
Competing financial interests: The authors declare no competing financial interests.
Reprints and permissions information is available at www.nature.com/reprints
References
- 1.Lanzavecchia A. Antigen-specific interaction between T and B cells. Nature. 1985;314:537–9. doi: 10.1038/314537a0. [DOI] [PubMed] [Google Scholar]
- 2.Stinchcombe JC, Majorovits E, Bossi G, Fuller S, Griffiths GM. Centrosome polarization delivers secretory granules to the immunological synapse. Nature. 2006;443:462–5. doi: 10.1038/nature05071. [DOI] [PubMed] [Google Scholar]
- 3.Monks CR, Freiberg BA, Kupfer H, Sciaky N, Kupfer A. Three-dimensional segregation of supramolecular activation clusters in T cells. Nature. 1998;395:82–6. doi: 10.1038/25764. [DOI] [PubMed] [Google Scholar]
- 4.Grakoui A, et al. The immunological synapse: a molecular machine controlling T cell activation. Science. 1999;285:221–7. doi: 10.1126/science.285.5425.221. [DOI] [PubMed] [Google Scholar]
- 5.Varma R, Campi G, Yokosuka T, Saito T, Dustin ML. T cell receptor-proximal signals are sustained in peripheral microclusters and terminated in the central supramolecular activation cluster. Immunity. 2006;25:117–27. doi: 10.1016/j.immuni.2006.04.010. [DOI] [PMC free article] [PubMed] [Google Scholar]
- 6.Vardhana S, Choudhuri K, Varma R, Dustin ML. Essential role of ubiquitin and TSG101 protein in formation and function of the central supramolecular activation cluster. Immunity. 2010;32:531–40. doi: 10.1016/j.immuni.2010.04.005. [DOI] [PMC free article] [PubMed] [Google Scholar]
- 7.Babst M, Wendland B, Estepa EJ, Emr SD. The Vps4p AAA ATPase regulates membrane association of a Vps protein complex required for normal endosome function. EMBO J. 1998;17:2982–93. doi: 10.1093/emboj/17.11.2982. [DOI] [PMC free article] [PubMed] [Google Scholar]
- 8.von Schwedler UK, et al. The protein network of HIV budding. Cell. 2003;114:701–13. doi: 10.1016/s0092-8674(03)00714-1. [DOI] [PubMed] [Google Scholar]
- 9.Mossman KD, Campi G, Groves JT, Dustin ML. Altered TCR signaling from geometrically repatterned immunological synapses. Science. 2005;310:1191–3. doi: 10.1126/science.1119238. [DOI] [PubMed] [Google Scholar]
- 10.Linsley PS, et al. Binding of the B cell activation antigen B7 to CD28 costimulates T cell proliferation and interleukin 2 mRNA accumulation. J Exp Med. 1991;173:721–30. doi: 10.1084/jem.173.3.721. [DOI] [PMC free article] [PubMed] [Google Scholar]
- 11.Kaizuka Y, Douglass AD, Varma R, Dustin ML, Vale RD. Mechanisms for segregating T cell receptor and adhesion molecules during immunological synapse formation in Jurkat T cells. Proc Natl Acad Sci U S A. 2007;104:20296–301. doi: 10.1073/pnas.0710258105. [DOI] [PMC free article] [PubMed] [Google Scholar]
- 12.Sims TN, et al. Opposing effects of PKCtheta and WASp on symmetry breaking and relocation of the immunological synapse. Cell. 2007;129:773–85. doi: 10.1016/j.cell.2007.03.037. [DOI] [PubMed] [Google Scholar]
- 13.Garrus JE, et al. Tsg101 and the vacuolar protein sorting pathway are essential for HIV-1 budding. Cell. 2001;107:55–65. doi: 10.1016/s0092-8674(01)00506-2. [DOI] [PubMed] [Google Scholar]
- 14.Saksena S, Wahlman J, Teis D, Johnson AE, Emr SD. Functional reconstitution of ESCRT-III assembly and disassembly. Cell. 2009;136:97–109. doi: 10.1016/j.cell.2008.11.013. [DOI] [PMC free article] [PubMed] [Google Scholar]
- 15.Wollert T, Wunder C, Lippincott-Schwartz J, Hurley JH. Membrane scission by the ESCRT-III complex. Nature. 2009;458:172–7. doi: 10.1038/nature07836. [DOI] [PMC free article] [PubMed] [Google Scholar]
- 16.Stuchell-Brereton MD, et al. ESCRT-III recognition by VPS4 ATPases. Nature. 2007;449:740–4. doi: 10.1038/nature06172. [DOI] [PubMed] [Google Scholar]
- 17.Sachse M, Strous GJ, Klumperman J. ATPase-deficient hVPS4 impairs formation of internal endosomal vesicles and stabilizes bilayered clathrin coats on endosomal vacuoles. J Cell Sci. 2004;117:1699–708. doi: 10.1242/jcs.00998. [DOI] [PubMed] [Google Scholar]
- 18.Martinez-Martin N, et al. T cell receptor internalization from the immunological synapse is mediated by TC21 and RhoG GTPase-dependent phagocytosis. Immunity. 2011;35:208–22. doi: 10.1016/j.immuni.2011.06.003. [DOI] [PMC free article] [PubMed] [Google Scholar]
- 19.He T, et al. Bidirectional membrane molecule transfer between dendritic and T cells. Biochem Biophys Res Commun. 2007;359:202–8. doi: 10.1016/j.bbrc.2007.05.099. [DOI] [PubMed] [Google Scholar]
- 20.Lang P, et al. TCR-induced transmembrane signaling by peptide/MHC class II via associated Ig-alpha/beta dimers. Science. 2001;291:1537–40. doi: 10.1126/science.291.5508.1537. [DOI] [PubMed] [Google Scholar]
- 21.Cambier JC, Lehmann KR. Ia-mediated signal transduction leads to proliferation of primed B lymphocytes. J Exp Med. 1989;170:877–86. doi: 10.1084/jem.170.3.877. [DOI] [PMC free article] [PubMed] [Google Scholar]
- 22.Mittelbrunn M, et al. Unidirectional transfer of microRNA-loaded exosomes from T cells to antigen-presenting cells. Nat Commun. 2011;2:282. doi: 10.1038/ncomms1285. [DOI] [PMC free article] [PubMed] [Google Scholar]
- 23.Marshall AJ, Niiro H, Yun TJ, Clark EA. Regulation of B-cell activation and differentiation by the phosphatidylinositol 3-kinase and phospholipase Cgamma pathway. Immunol Rev. 2000;176:30–46. doi: 10.1034/j.1600-065x.2000.00611.x. [DOI] [PubMed] [Google Scholar]
- 24.Liu H, Rhodes M, Wiest DL, Vignali DA. On the dynamics of TCR:CD3 complex cell surface expression and downmodulation. Immunity. 2000;13:665–75. doi: 10.1016/s1074-7613(00)00066-2. [DOI] [PubMed] [Google Scholar]
- 25.Fleire SJ, et al. B cell ligand discrimination through a spreading and contraction response. Science. 2006;312:738–41. doi: 10.1126/science.1123940. [DOI] [PubMed] [Google Scholar]
- 26.Vanherberghen B, et al. Human and murine inhibitory natural killer cell receptors transfer from natural killer cells to target cells. Proc Natl Acad Sci U S A. 2004;101:16873–8. doi: 10.1073/pnas.0406240101. [DOI] [PMC free article] [PubMed] [Google Scholar]
- 27.Victora GD, et al. Germinal center dynamics revealed by multiphoton microscopy with a photoactivatable fluorescent reporter. Cell. 2010;143:592–605. doi: 10.1016/j.cell.2010.10.032. [DOI] [PMC free article] [PubMed] [Google Scholar]
- 28.Dustin ML, Starr T, Varma R, Thomas VK. Supported planar bilayers for study of the immunological synapse. Curr Protoc Immunol. 2007;Chapter 18(Unit 18):13. doi: 10.1002/0471142735.im1813s76. [DOI] [PubMed] [Google Scholar]
- 29.Schubert DA, et al. Self-reactive human CD4 T cell clones form unusual immunological synapses. J Exp Med. 2012;209:335–52. doi: 10.1084/jem.20111485. [DOI] [PMC free article] [PubMed] [Google Scholar]
- 30.Fleire SJ, Batista FD. Studying cell-to-cell interactions: an easy method of tethering ligands on artificial membranes. Methods Mol Biol. 2009;462:145–54. doi: 10.1007/978-1-60327-115-8_9. [DOI] [PubMed] [Google Scholar]
- 31.Patterson GH, Lippincott-Schwartz J. A photoactivatable GFP for selective photolabeling of proteins and cells. Science. 2002;297:1873–7. doi: 10.1126/science.1074952. [DOI] [PubMed] [Google Scholar]
- 32.Jouvenet N, Zhadina M, Bieniasz PD, Simon SM. Dynamics of ESCRT protein recruitment during retroviral assembly. Nat Cell Biol. 2011;13:394–401. doi: 10.1038/ncb2207. [DOI] [PMC free article] [PubMed] [Google Scholar]
- 33.Jouvenet N, Bieniasz PD, Simon SM. Imaging the biogenesis of individual HIV-1 virions in live cells. Nature. 2008;454:236–40. doi: 10.1038/nature06998. [DOI] [PMC free article] [PubMed] [Google Scholar]
- 34.Tsai J, Sun E, Gao Y, Hone JC, Kam LC. Non-Brownian diffusion of membrane molecules in nanopatterned supported lipid bilayers. Nano Lett. 2008;8:425–30. doi: 10.1021/nl072304q. [DOI] [PMC free article] [PubMed] [Google Scholar]
- 35.Milstein O, et al. Nanoscale increases in CD2–CD48-mediated intermembrane spacing decrease adhesion and reorganize the immunological synapse. J Biol Chem. 2008;283:34414–22. doi: 10.1074/jbc.M804756200. [DOI] [PMC free article] [PubMed] [Google Scholar]
- 36.Winkler H, Taylor KA. Accurate marker-free alignment with simultaneous geometry determination and reconstruction of tilt series in electron tomography. Ultramicroscopy. 2006;106:240–54. doi: 10.1016/j.ultramic.2005.07.007. [DOI] [PubMed] [Google Scholar]
- 37.Kremer JR, Mastronarde DN, McIntosh JR. Computer visualization of three-dimensional image data using IMOD. J Struct Biol. 1996;116:71–6. doi: 10.1006/jsbi.1996.0013. [DOI] [PubMed] [Google Scholar]
- 38.Marsh BJ, Mastronarde DN, Buttle KF, Howell KE, McIntosh JR. Organellar relationships in the Golgi region of the pancreatic beta cell line, HIT-T15, visualized by high resolution electron tomography. Proc Natl Acad Sci U S A. 2001;98:2399–406. doi: 10.1073/pnas.051631998. [DOI] [PMC free article] [PubMed] [Google Scholar]
- 39.Hayashi-Nishino M, et al. A subdomain of the endoplasmic reticulum forms a cradle for autophagosome formation. Nat Cell Biol. 2009;11:1433–7. doi: 10.1038/ncb1991. [DOI] [PubMed] [Google Scholar]
- 40.Keene DR, Tufa SF, Lunstrum GP, Holden P, Horton WA. Confocal/TEM overlay microscopy: a simple method for correlating confocal and electron microscopy of cells expressing GFP/YFP fusion proteins. Microsc Microanal. 2008;14:342–8. doi: 10.1017/S1431927608080306. [DOI] [PubMed] [Google Scholar]
Associated Data
This section collects any data citations, data availability statements, or supplementary materials included in this article.