Abstract
Cochlear implant electrical stimulation of the auditory system to rehabilitate deafness has been remarkably successful. Its deployment requires both an intact auditory nerve and a suitably patent cochlear lumen. When disease renders prerequisite conditions impassable, such as in neurofibromatosis type II and cochlear obliterans, alternative treatment targets are considered. Electrical stimulation of the cochlear nucleus and midbrain in humans has delivered encouraging clinical outcomes, buttressing the promise of central auditory prostheses to mitigate deafness in those who are not candidates for cochlear implantation. In this study we explored another possible implant target: the auditory thalamus. In anesthetized cats, we first presented pure tones to determine frequency preferences of thalamic and cortical sites. We then electrically stimulated tonotopically organized thalamic sites while recording from primary auditory cortical sites using a multichannel recording probe. Cathode-leading biphasic thalamic stimulation thresholds that evoked cortical responses were much lower than published accounts of cochlear and midbrain stimulation. Cortical activation dynamic ranges were similar to those reported for cochlear stimulation, but they were narrower than those found through midbrain stimulation. Our results imply that thalamic stimulation can activate auditory cortex at low electrical current levels and suggest an auditory thalamic implant may be a viable central auditory prosthesis.
Keywords: cathodic stimulation, anodic stimulation, medial geniculate body, deafness, auditory thalamic implant
the preeminent sensory rehabilitation device is the cochlear implant. No other sensory implant has been able to match its success at restoring function (Wilson and Dorman 2008; Zeng et al. 2008). Both children and adults benefit from cochlear implantation for treatment of profound hearing loss or complete deafness. Yet there remain distinct clinical populations who are not candidates for cochlear electrical stimulation. Individuals afflicted with bilateral auditory nerve loss (neurofibromatosis type II) or with obliterated cochlear lumens (e.g., meningitis complication) cannot be served with the cochlear implant (Evans et al. 2005; Grayeli et al. 2003, 2008; Schwartz et al. 2008). To meet the needs of those who are unsuitable for cochlear implantation there has been an ongoing search for other treatment targets to mitigate deafness through central auditory electrical stimulation. A guiding principle of this search is that the auditory station must be accessible and have an orderly representation of best frequency. One candidate site is the auditory nerve, which may be electrically stimulated using penetrating electrodes. Compared with the cochlear implant, more precise frequency-specific excitation and higher temporal resolution are possible (Middlebrooks and Snyder 2007, 2008). Although physiologically elegant, this more invasive approach cannot be clinically deployed in individuals without functional auditory nerves. Another site is the cochlear nucleus (CN), a prominent, early brain stem station that has already been targeted for surface array electrical stimulation (Kanowitz et al. 2004; Marangos et al. 2000; Otto et al. 2008; Shepherd and McCreery 2006). The very best hearing outcomes of the auditory brain stem implant (ABI), an FDA-approved device, match those achieved with the cochlear implant (Colletti et al. 2012). The ABI has a penetrating electrodes variant, which may enable more optimal sound-processing strategies (McCreery 2008). Potential benefits of the ABI may be curtailed if the CN is damaged by primary disease or during posterior fossa surgery (Colletti et al. 2009). In underserved deaf neurofibromatosis type II patients, this is indeed the case (Schwartz et al. 2008). ABI clinical outcomes are inconsistent and typically inferior to the cochlear implant. The quest to deliver better auditory rehabilitation motivated central auditory prosthesis development for the midbrain, and now the thalamus. The midbrain candidate site is the central nucleus of the inferior colliculus (ICC), which may be accessed with a penetrating lead (Lim and Anderson 2006; Lim et al. 2007; Samii et al. 2007). The ICC has a laminar organization of best frequency, which makes it an attractive target for electrical stimulation (Schreiner and Langner 1997). However, the ICC has multiple synaptic input domains that originate from brain stem structures (Cant and Benson 2006, 2007; Loftus et al. 2010). Overlapping maps of multiple parameters, such as modulation frequency, bandwidth, and latency, create additional challenges to control stimulation input finely using circumferential electrodes that envelope the penetrating lead. When the auditory midbrain implant (AMI) was tested in a pilot clinical trial, it showed promise in restoring some auditory function. Variations in clinical outcomes (Lim et al. 2008, 2009) may be partially attributed to considerable differences in AMI positioning in and around the ICC.
Another station that may be a promising site for an auditory implant is the thalamus. The thalamus is part of the forebrain and precedes the cortex in central auditory system hierarchy. The thalamus is a necessary gateway for acoustic information: after auditory information from the thalamus is relayed to the cortex it is splintered into many disparate and massively interconnected cortical fields (Winer 1992). The thalamus is tonotopically organized via a laminar substrate, and it is an obligatory, lemniscal center through which tonotopic information must flow (Cetas et al. 2003; Morest 1965; Rodrigues-Dagaeff et al. 1989; Rouiller et al. 1989). Since it has a laminar organization, it may be targeted much the same way as the midbrain. Low-frequency regions of the thalamus are more readily accessible than those of the distant apical cochlea. Relative to the ICC, the thalamus is anatomically compact. A multichannel deep brain stimulation lead adapted to the thalamus could conceivably control multiple stimulation parameters (Winer 1992). Furthermore, since the auditory thalamic implant (ATI) would be in contact with afferents, it would be able to stimulate cortical neural elements directly and likely have low stimulation energy requirements. From a surgical perspective, the ATI procedure would be modeled after deep brain stimulation surgery for treatment of movement disorders. ATI placement using a standard craniocaudal approach with a lateral-to-medial trajectory would access a variety of frequencies for electrical stimulation, because best frequency gradients are organized craniocaudally and mediolaterally (Imig and Morel 1985). Emerging technologies in ultrahigh density and current steering deep brain stimulation lead designs (http://www.sapiensneuro.com/) may enable precise stimulation of a broad array of thalamic neurons to encode complex sounds. Because ATI implant surgery would be performed under local anesthesia, awake and interactive patients would be able to report on auditory sensations to verify satisfactory implant placement. A posterior fossa craniotomy would not be required. This advantage of the ATI would overcome device positioning challenges inherent in unconscious patients undergoing posterior fossa craniotomy for ABI and AMI surgery. Given these potential merits of the ATI, it is important to understand how electrical stimulation of the thalamus is reflected in cortical processing.
In this initial effort we evaluated ATI feasibility by examining the response properties of cortical sites to thalamic stimulation. Prior studies have examined cortical responses to cochlear and midbrain electrical stimulation, but responses to thalamic stimulation have not yet been investigated (Bierer and Middlebrooks 2002; Kral et al. 2009; Lim and Anderson 2006, 2007a; Raggio and Schreiner 1994, 1999, 2003; Schreiner and Raggio 1996). This study had two main goals: 1) to determine how electrical stimulation of thalamic neurons would be reflected in primary auditory cortical responses and 2) to compare cortical responses from thalamic electrical stimulation to that from cochlear and midbrain stimulation. We first determined frequency preferences of neurons both in the ventral division of the auditory thalamus (vMGB) and in primary auditory cortex (AI) using acoustic stimuli. Thalamic sites were then electrically stimulated with tungsten electrodes while responses to this stimulation were simultaneously recorded in AI using a multichannel silicon probe.
METHODS
This study was carried out in strict accordance with recommendations in the Guide for the Care and Use of Laboratory Animals of the National Institutes of Health. The protocol (AN086113-01B) was approved by the University of California, San Francisco Committee for Animal Research. The electrophysiological recording methods were previously described in detail (Imaizumi and Schreiner 2007; Miller et al. 2002). A brief description follows.
Anesthesia and surgery.
Five young adult female cats with clean and otoscopically normal outer and middle ears were sedated with an initial dose of ketamine (22 mg/kg) and acepromazine (0.11 mg/kg) and then anesthetized with pentobarbital sodium (Nembutal; 15–30 mg/kg) for the surgical procedure. The animal's temperature was maintained with a thermostatic heating pad. Bupivicaine was applied to incisions and pressure points. Surgery consisted of a tracheotomy, reflection of the soft tissues of the scalp, craniotomy over AI, and durotomy. After surgery, to maintain an areflexive state, the animal received a continuous infusion of ketamine/diazepam (2–5 mg·kg−1·h−1 ketamine/0.2–0.5 mg·kg−1·h−1 diazepam in lactated Ringer solution). All procedures were administered in accordance with the approved protocol.
Recording procedures.
Each animal was stabilized in a stereotaxic apparatus, which was inside a sound-shielded anechoic chamber (IAC, Bronx, NY). Stimuli were delivered through hollow ear bars via a closed electrostatic speaker system to the ear contralateral to the exposed cortex (diaphragm speaker elements from Stax, Tokyo, Japan). Speaker output was calibrated using a Brüel and Kjær sound pressure meter (type 1613; Copenhagen, Denmark). In cortex, extracellular recordings were made using multichannel NeuroNexus Technologies silicon recording probes. The probes contained four linearly spaced shanks, with four linearly spaced recording channels on each shank. The spacing between shanks was either 125 or 200 μm, selected for ease of probe placement depending on the density of cortical surface vasculature. The spacing between recording channels was 100 μm. The contact size of each channel was 177 μm2. Each channel had impedance between 1 and 2 MΩ at 1 kHz. Probes were inserted into AI so that recordings were made at depths from 700 to 1,100 μm, corresponding to layers 3b/4 (Huang and Winer 2000). For thalamic recordings, tungsten electrodes were used (∼500 kΩ at 1 kHz, 125-μm diameter; Microprobe, Gaithersburg, MD).
Thalamic recordings were made in the vMGB. Penetration trajectories were directly along the z-axis (superior-inferior axis) of the stereotaxic frame. Auditory thalamus was identified by locked responses to 50-ms noise bursts presented every 500 ms. We identified the ventral division by its distinct tonotopy, which follows a laminar organization. The dorsal and medial divisions of the MGB typically do not display clear tonotopy, sharp tuning, or short latencies. vMGB was identified ∼5 mm anterior to the interaural plane and 10 mm lateral of the midline.
To stimulate the thalamus electrically, we used monopolar stimulation through a tungsten electrode. Electrical stimulus waveforms were cathode-leading biphasic pulses (200 μs/phase, 100-μs interphase gap). The interstimulus interval was 500 ms. Currents levels were varied in 2.5-dB steps between 20 nA and 35.6 μA and presented in a pseudorandom order. Stimulus signals were generated by a Tucker-Davis Technologies RP2 module (Alachua, FL) and delivered to a custom-manufactured, isolated, voltage-to-current converter. In some cases pulse trains were used to stimulate the vMGB. Pulse trains were cathode-leading biphasic pulses (200 μs/phase, 100-μs interphase gap) delivered at 120 pulses/s.
All recording locations were in AI, as verified through initial multiunit mapping and determined by topography of the tonotopic gradient and bandwidth modules on the crest of the ectosylvian gyrus (Imaizumi and Schreiner 2007). For each animal, a digital photo was taken that captured the posterior and anterior ectosylvian sulci. The image was imported into Illustrator software (Adobe Systems, San Jose, CA), and recording positions were marked on the image during the experiment.
For cortical recordings, we used a Tucker-Davis Technologies System 3 platform. Signals were digitized using a Medusa PA16 preamplifier and then acquired via RA16 amplifier modules. Filter settings for the RA16 modules were a 60-Hz notch filter, 600-Hz high-pass filter, and 5,000-Hz low-pass filter. Thresholding of recorded signals was performed using TDT Brainware software. Data analysis was based on multiunit responses. Spikes were detected when they crossed a threshold that was three standard deviations greater than the background neural signal. Artifacts from electrical stimulation were identified by summing the neural traces from all electrical stimulation trials. The artifact window was the time between when the signal first deviated from the baseline by 5% of the maximum artifact value and when it returned to less than 5% of the maximum artifact value. Responses in the artifact window were not included in the analysis.
Stimulation procedures.
At each recording or stimulation position, neuronal responses were probed with pure tones. Pure tones were 50 ms in duration, had 5-ms cosine-squared onset/offset ramps, and presented every 300 ms. The frequency and level of each tone was chosen from 45 frequencies and 15 levels, resulting in a set of 675 different tones. The set was presented in a pseudorandom sequence (Cheung et al. 2001; Schreiner and Sutter 1992). Level steps were 5 dB and spanned a 70-dB range. The maximum pure tone level was between 70 and 90 dB SPL. Frequencies were logarithmically spaced. After completion of the experiments, frequency response areas (FRAs) were constructed based on the number of spikes in response to each tone.
Data analysis: electrical stimulation.
For each recording site, we determined cortical responses to a set of thalamic electrical stimulation levels. Response vs. current curves or activation curves usually start at a baseline response value and then saturate at higher current levels. Each activation curve was fitted with the following sigmoidal function:
where RLow is the lower response asymptote, RHigh is the upper response asymptote, w is a shape parameter, C is the current, and C50% represents the midpoint current value that satisfies F(C50%) = 0.5(RLow + RHigh). Following previous studies (Bierer and Middlebrooks 2002; Lim and Anderson 2006), we identified two further points on the activation curve: the current levels that elicited responses that were 25% and 75% greater than RLow. The current at the 25% level was defined as the threshold. The dynamic range, DR, was calculated in decibels as the logarithmic difference between the 25% and 75% value: DR = 20log10 (C75%/C25%).
The normalized mean squared error (NMSE) is the mean squared error divided by the variance in the data, NMSE = mean(ei2)/var(Ri), where ei = Ri − Fi, the error between the responses and the sigmoidal fit. Ri are the responses at the current values used in the study, and Fi are the sigmoidal fit values. For any site to be included in the analyses, the NMSE had to be less than or equal to 0.1.
RESULTS
We investigated the responses at 656 AI recording sites to electrical stimulation at a total of 15 vMGB sites derived from 5 separate experiments. Responses to pure tones were recorded in both vMGB and AI. This approach allowed us to record acoustically evoked frequency response areas (FRAs) from thalamus and cortex and thalamus-based, electrically driven responses from AI.
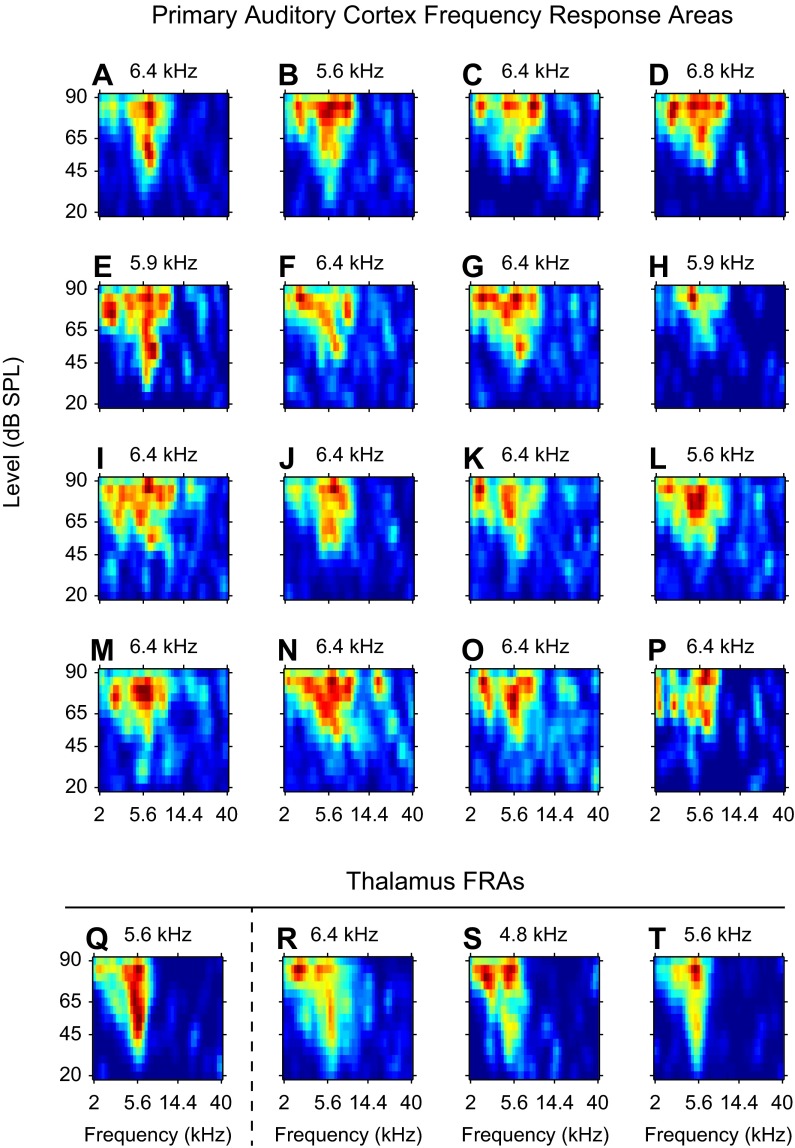
For each experiment, frequency contour locations of the AI tonotopic map were localized. We then searched until we identified a region of the auditory thalamus that exhibited robust responses to tones and tonotopic organization, hallmarks of the vMGB (see methods for details). When vMGB was located, a multichannel recording probe was inserted into a region of AI with similar frequency preferences. Using pure tone stimuli, we determined thalamic FRAs, which were usually low threshold, short latency, narrowly tuned, and vigorously responsive (Fig. 1, Q–T). Next, cortical FRAs were similarly determined, although their shapes were less stereotyped (Fig. 1, A–P). From each FRA we estimated the characteristic frequency (CF): the frequency at which the lowest sound level evoked a driven response.
Fig. 1.
Example frequency response areas (FRAs) from primary auditory cortex (AI) and the ventral division of the medial geniculate body (vMGB). A–P: FRAs for 16 AI cortical sites recorded from 1 multichannel probe penetration. Each probe had 4 shanks, with 4 recording channels per shank. The estimated characteristic frequency (CF) is noted above each FRA. Q: FRA from a recording site in the vMGB that was later electrically stimulated. When the thalamic site in Q was electrically stimulated, AI responses were recorded at the locations in A–P. R–T: 3 additional example thalamic FRAs recorded from different locations in the thalamus.
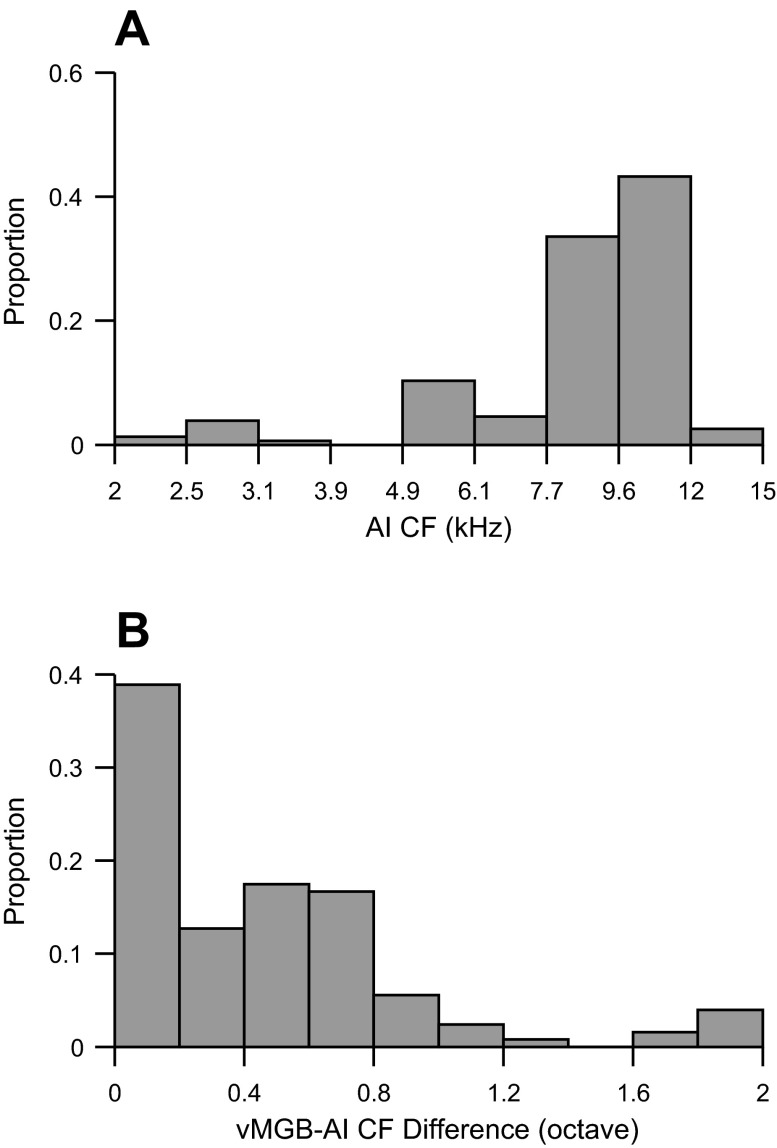
CF distributions in AI and vMGB showed two main features. First, the distribution of CFs for cortical sites was bounded between 5 and 15 kHz. The majority of sites were from the 8-to 12-kHz region. These values correspond to CFs that are normally present at the center of the ectosylvian gyrus. Second, vMGB and AI sites were purposefully brought into close CF alignment (Fig. 2B). In doing so, we focused on characterizing cortical responses from vMGB electrical stimulation when CFs from the two auditory stations were similar. The majority of CFs were well matched between vMGB and AI, with differences less than 0.8 octaves and a high proportion of recordings where the match was within 0.2 octaves. This report documents cortical responses to vMGB stimulation that occurred in CF-matched tonotopic regions.
Fig. 2.
CF distribution. A: CFs of sampled cortical sites. B: difference between CFs from simultaneously sampled vMGB and AI sites.
After recording FRAs, we then electrically stimulated a single thalamic site while recording from 16 cortical sites. Poststimulus time histograms (Fig. 3) were constructed. Fairly vigorous cortical responses were observed for current levels at and above 3 μA. Cortical responses began to saturate after 20 μA and plateaued by 27 μA of electrical stimulation.
Fig. 3.
Cortical poststimulus time histograms (PSTHs) for cathodic thalamic electrical stimulation. An example PSTH from 1 cortical recording site is shown. Increasing electrical stimulation levels lead to increasing cortical responses. Gray boxes represent the duration of the recorded electrical artifact.
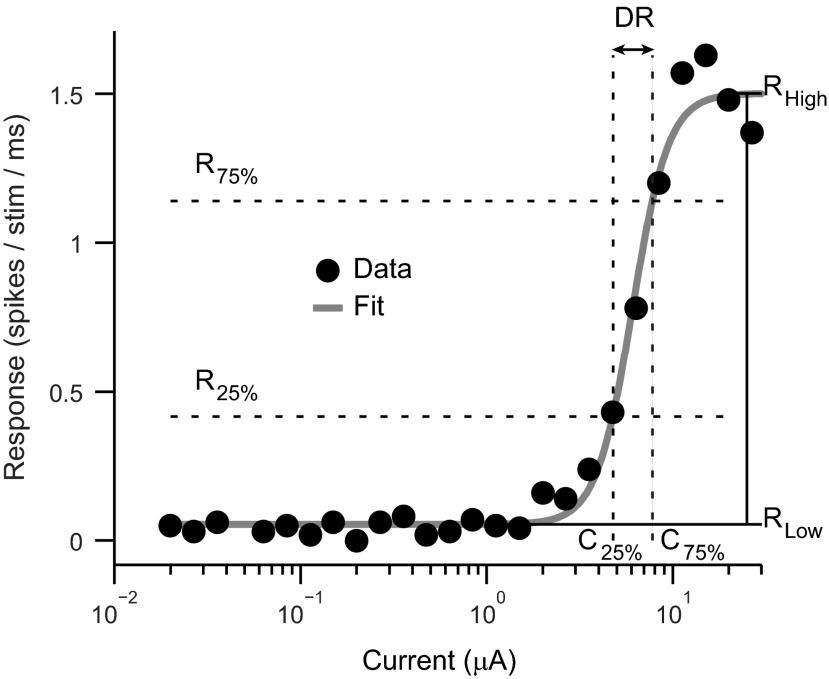
To quantify how responses changed with current, we plotted strength of response vs. current level (Fig. 4). Responses were obtained from a 10-ms window immediately following the stimulus artifact (larger response windows did not materially change results). The monotonic activation curve shape was stereotypical of our data set and therefore implies that we effectively covered the dynamic range for the majority of cortical sites.
Fig. 4.
Example cortical activation curve. Responses from a recording site evoked by thalamic electrical stimulation are shown. The activation curve was fitted with a sigmoidal function, and multiple parameters were obtained: RLow, lower asymptotic response level; RHigh, upper asymptotic response level; R25% and R75%, response levels 25% and 75% above RLow; C25% and C75%, currents corresponding to the response levels 25% and 75% above RLow; and DR, dynamic range (in dB) between C25% and C75%.
We fitted a sigmoidal function to each activation curve. Fitting a parametric function to the data compensated for the confounding factor of response variability and allowed us to robustly estimate response parameters. Multiple parameters were extracted from the curve fits, which were used to characterize the response features of cortical sites to thalamic stimulation.
After fitting, we identified the baseline response rate as well as the rate at which the response plateaued with increasing current level. Using these two asymptotic values, and the fit, we identified two response levels and the currents that corresponded to them: 1) the response 25% above the baseline rate, R25%, and the corresponding current, C25%; and 2) the response 75% above the baseline rate, R75%, and the corresponding current, C75%. The current, C25%, was used to identify the threshold current needed to evoke a response. This threshold calculation was chosen to be consistent with reports on cochlear and midbrain stimulation (Bierer and Middlebrooks 2002; Lim and Anderson 2006). We also computed the dynamic range value in decibels (dB). Adopting the method of a previous study, the dynamic range was estimated across the 25-to-75% stimulation interval: DR = 20log10 (C75%/C25%) (Bierer and Middlebrooks 2002).
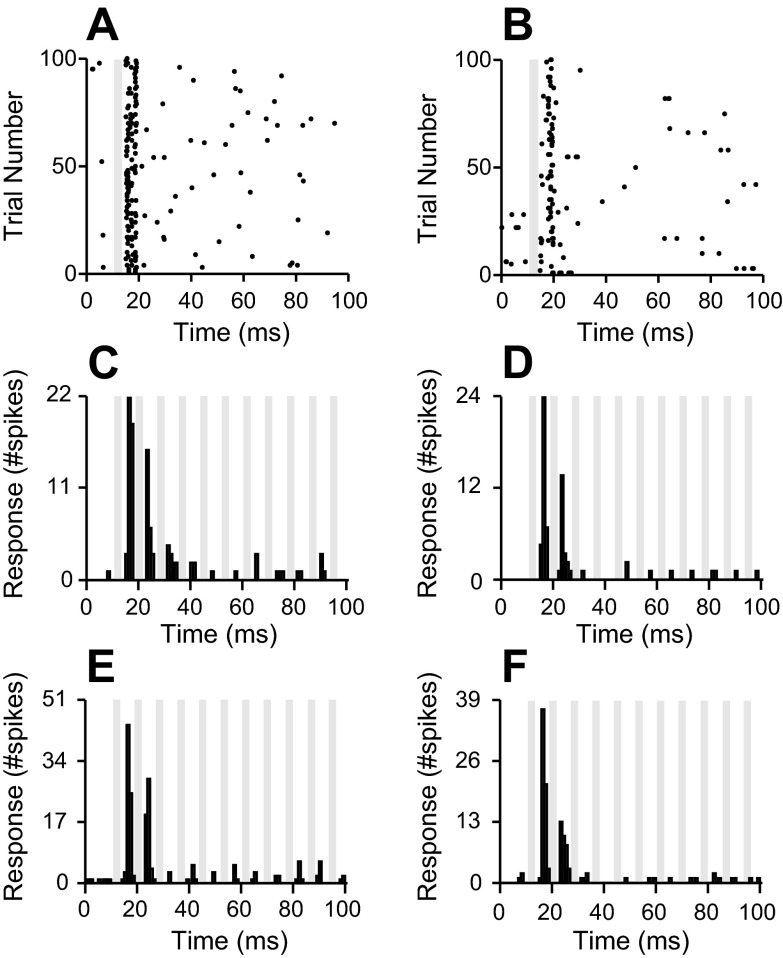
We performed control experiments to verify cortical responses were consistent with orthodromic, as opposed to antidromic, stimulation. Antidromic stimulation would induce cortical responses that do not reflect neural processing, characterized by minimal response variability and failure to show neural response fatigue. In contrast, orthodromic stimulation would activate cortical sites through neural pathways, characterized by substantial response timing variability and decremental cortical responses with repeated electrical stimulation pulses. We found that response rasters at cortical sites evoked by thalamic stimulation displayed response variability that was consistent with orthodromic stimulation (Fig. 5, A and B). To test for response fatigue, we presented pulse trains at high rates, 120 pulses/s. Consistent with orthodromic activation, cortical responses responded maximally to the first pulse and then decreased with increasing pulse number (Fig. 5, C–F). The cortical activation profiles we observed are consistent with orthodromic stimulation.
Fig. 5.
Cortical response rasters and pulse train responses. A and B: example responses from 2 cortical sites to 20-μA single-pulse vMGB electrical stimulation show neural response variability. C–F: example responses from 4 cortical sites to electrical stimulation pulse trains at 20-μA current levels. Pulse train frequency was 120 pulses/s. Response profiles confirm antidromic fatigue. Gray bars indicate electrical stimulation artifacts.
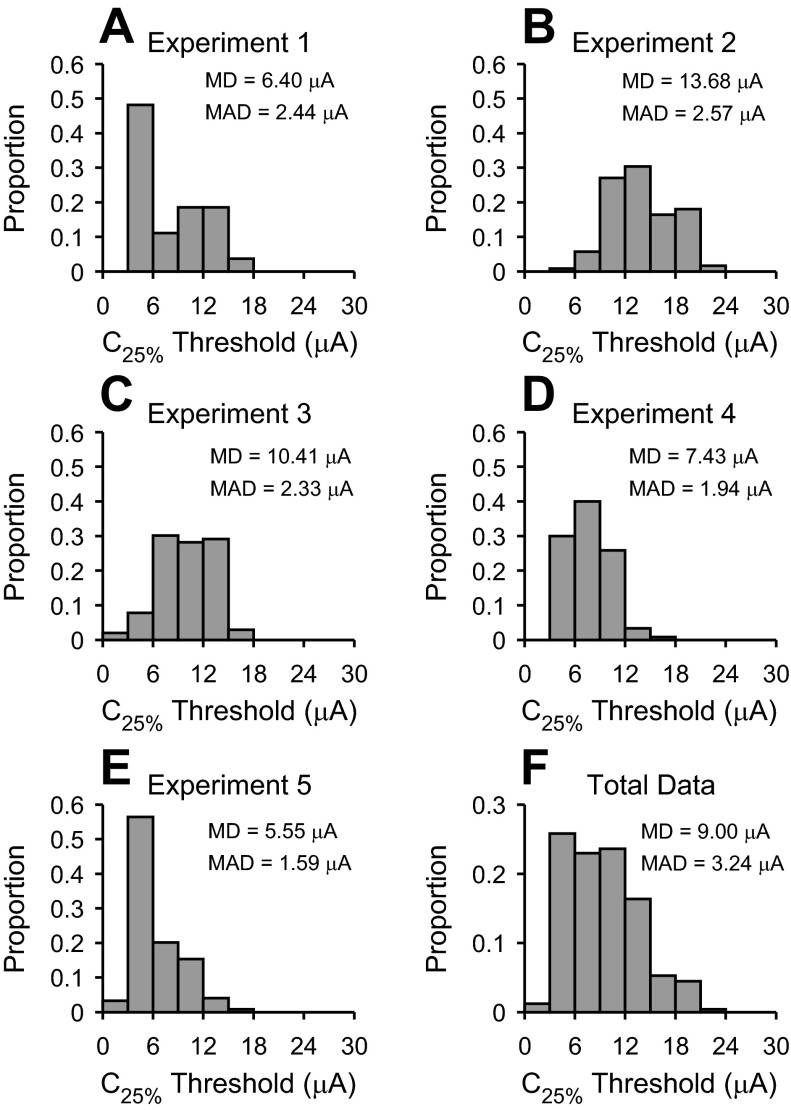
From the sigmoidal fits we estimated threshold for each recording site in AI (Fig. 6). We analyzed sites where a fit was obtained and where the C75% level could be estimated (Fig. 4). The first main parameter extracted was C25% or threshold, which represents the current level needed to drive responses at a cortical site to 25% of maximum value. Threshold values in different cases were always less than 24 μA. Threshold medians of all cases were less than 15 μA. Electrical stimulation of vMGB sites at low-to-moderate levels was sufficient to drive responses at cortical sites. Across the combined data set, the population median (MD) was 9.00 μA and median absolute deviation (MAD) was 3.24 μA. The distribution was skewed to lower threshold values (Fig. 6F). Cortical sites respond to relatively low current levels of vMGB electrical stimulation.
Fig. 6.
C25% threshold level for cathodic thalamic electrical stimulation. A–E: threshold distributions from 5 experiments. F: distribution of thresholds obtained by combining all data in A–E. MD, median; MAD, median absolute deviation.
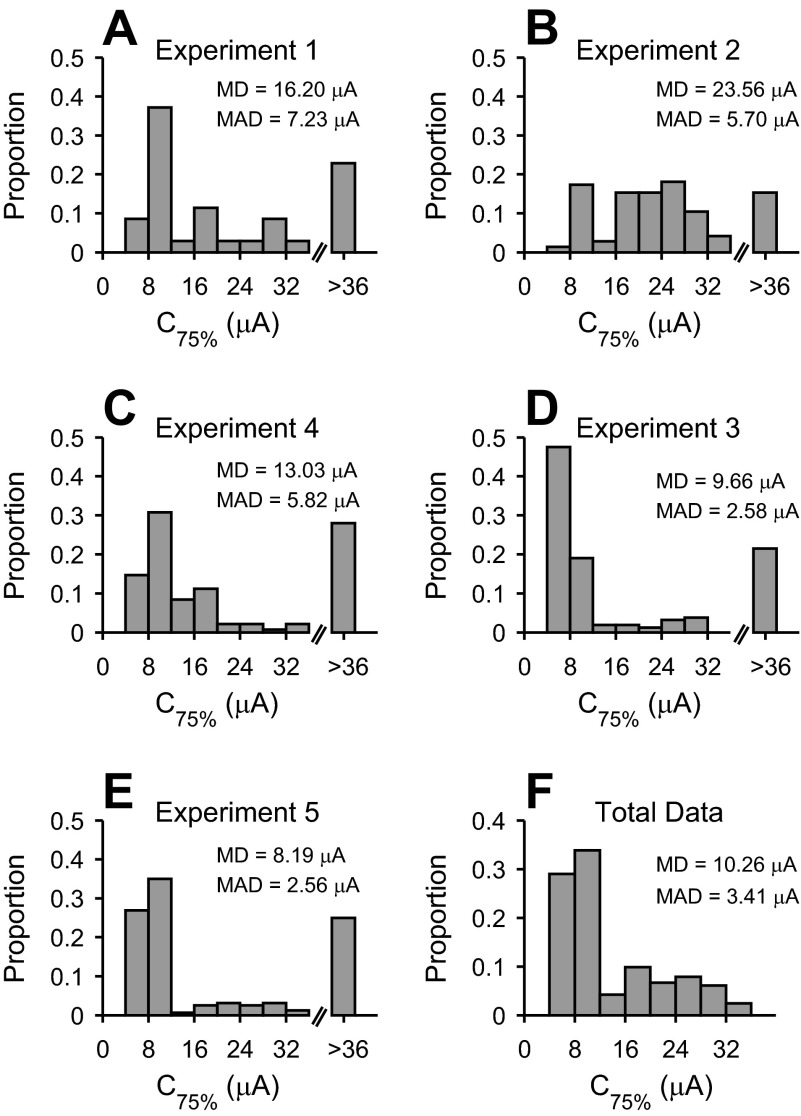
The second main parameter extracted from sigmoidal fits was C75%. This measure represents the current level that drives the response to 75% of maximum value. C75% values are important because they describe current levels that are necessary to drive cortical responses toward saturation. Across cases, C75% values showed consistent patterns, with the majority of values less than 16 μA (Fig. 7, A–E). This indicates that to sample the dynamic range at the majority of cortical sites, 16-μA or lower currents are required. An additional aspect to note is that in a minority of sites, C75% could not be measured. For those sites, we obtained a significant sigmoidal fit to the data, although the C75% could not be measured because the activation curve had not saturated. Our experimental apparatus was not able to deliver sufficiently high currents to reach saturation. Overall, ∼20% of cortical sites could not be driven to saturation. Over the complete set of sites where C75% values could be estimated, the median value was 10.26 μA (MAD = 3.41 μA) (Fig. 7F). The majority of cortical sites could be driven to saturation at current levels less than 36 μA.
Fig. 7.
Upper-response current levels for cathodic thalamic electrical stimulation. C75% corresponds to 75% of the maximum response value (see Fig. 4). A–E: C75% value distributions from 5 different experiments. The last bin (>36) indicates sites where C75% could not be determined using the applied electrical stimulation current levels. F: C75% distribution obtained by combining all data in A–E.
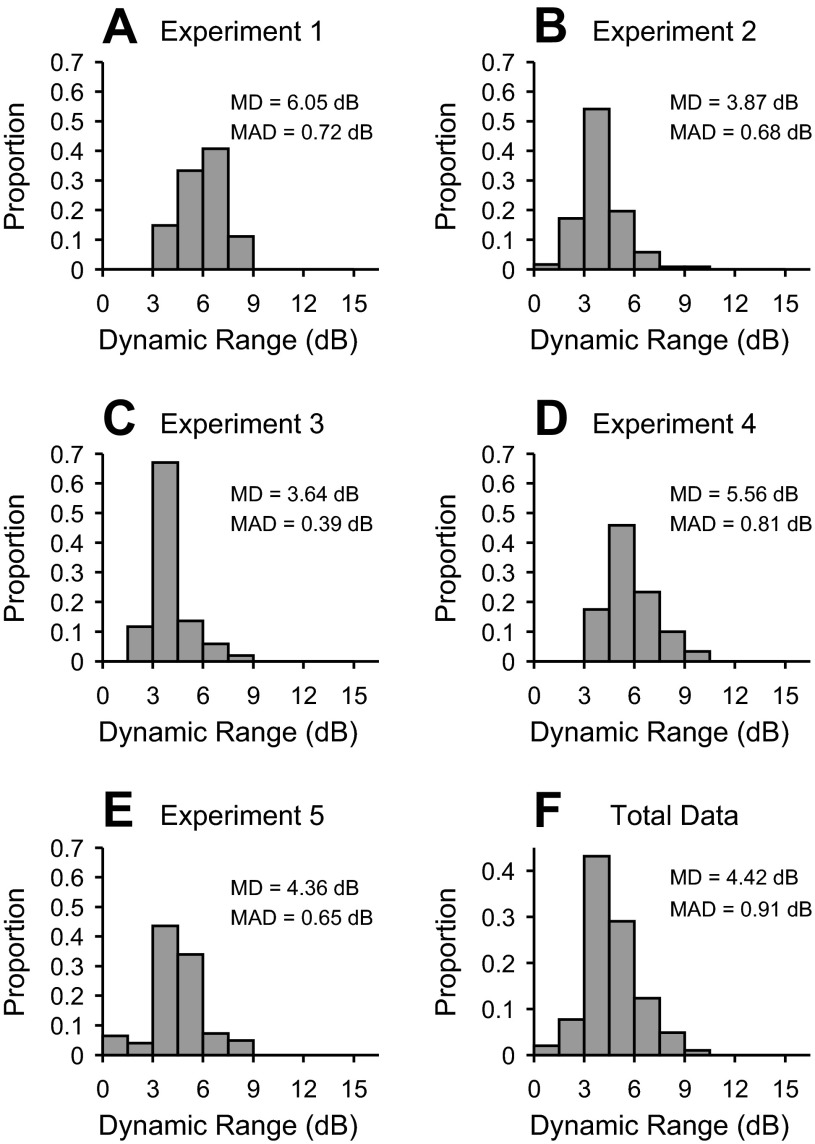
It is particularly important to discern the dynamic range of cortical responses to electrical stimulation. A larger dynamic range indicates that sensitivity may be coded over an extended set of currents. Smaller ranges indicate that acoustic parameters are encoded over a restricted set of electrical parameters. We found that dynamic ranges were relatively consistent across all cases (Fig. 8, A–E). Dynamic ranges in each case were usually between 2 and 9 dB. Additionally, the distribution of individual cases was unimodal and qualitatively invariant. Over the entire population of cases, the dynamic ranges were strongly unimodal, with a median of 4.42 μA (MAD = 0.91 μA).
Fig. 8.
Dynamic range for cathodic thalamic electrical stimulation. A–E: dynamic range (in dB) from 5 different experiments. F: dynamic range distribution obtained by combining all data in A–E.
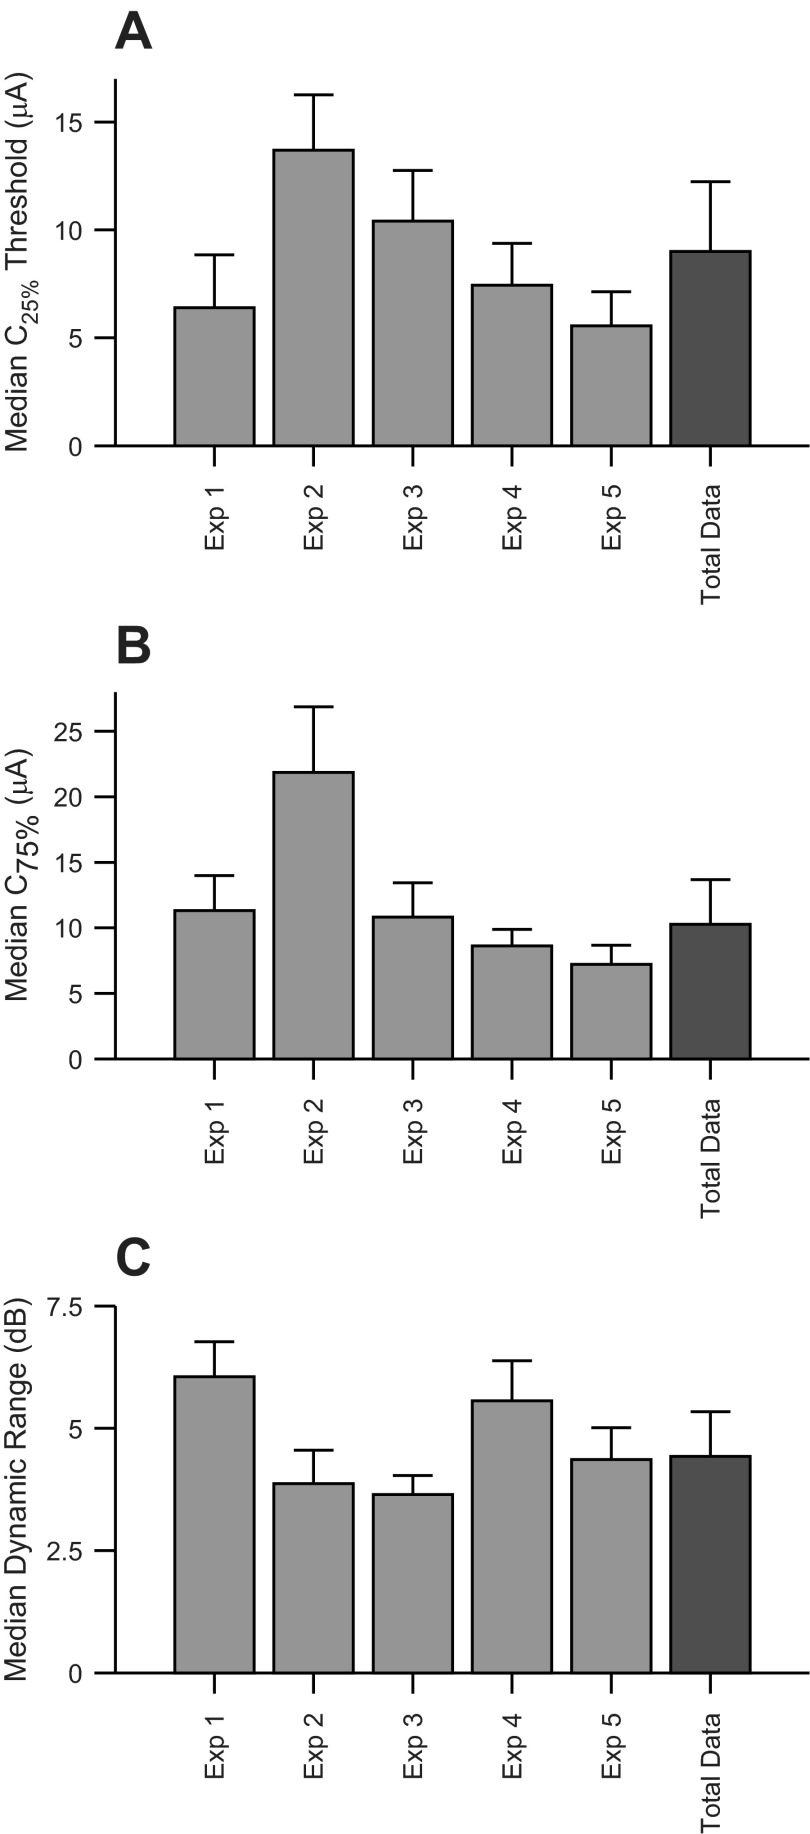
Across cases, electrical stimulation response parameters were relatively consistent. For C25% or threshold, individual cases had median values between 5 and 14 μA (Fig. 9A). The population (“Total Data”) median threshold value was 9.00 μA (MAD = 3.5 μA). For C75%, individual cases had median values between 7 and 22 μA (Fig. 9B), and the population median was 10.3 μA (MAD = 6.9 μA). Finally, dynamic range variation among individual cases was between 3 and 6 dB (Fig. 9C), and the population median was 4.42 dB (MAD = 1.21 dB). Across all five cases, threshold, C75%, and dynamic range values were relatively consistent.
Fig. 9.
Summary of cortical response measures. A: median threshold current levels for all 5 experiments (Exp 1–5) and combined total data. B: median C75% values. C: median dynamic range values. Error bars represent MAD.
Activation as a function of characteristic frequency.
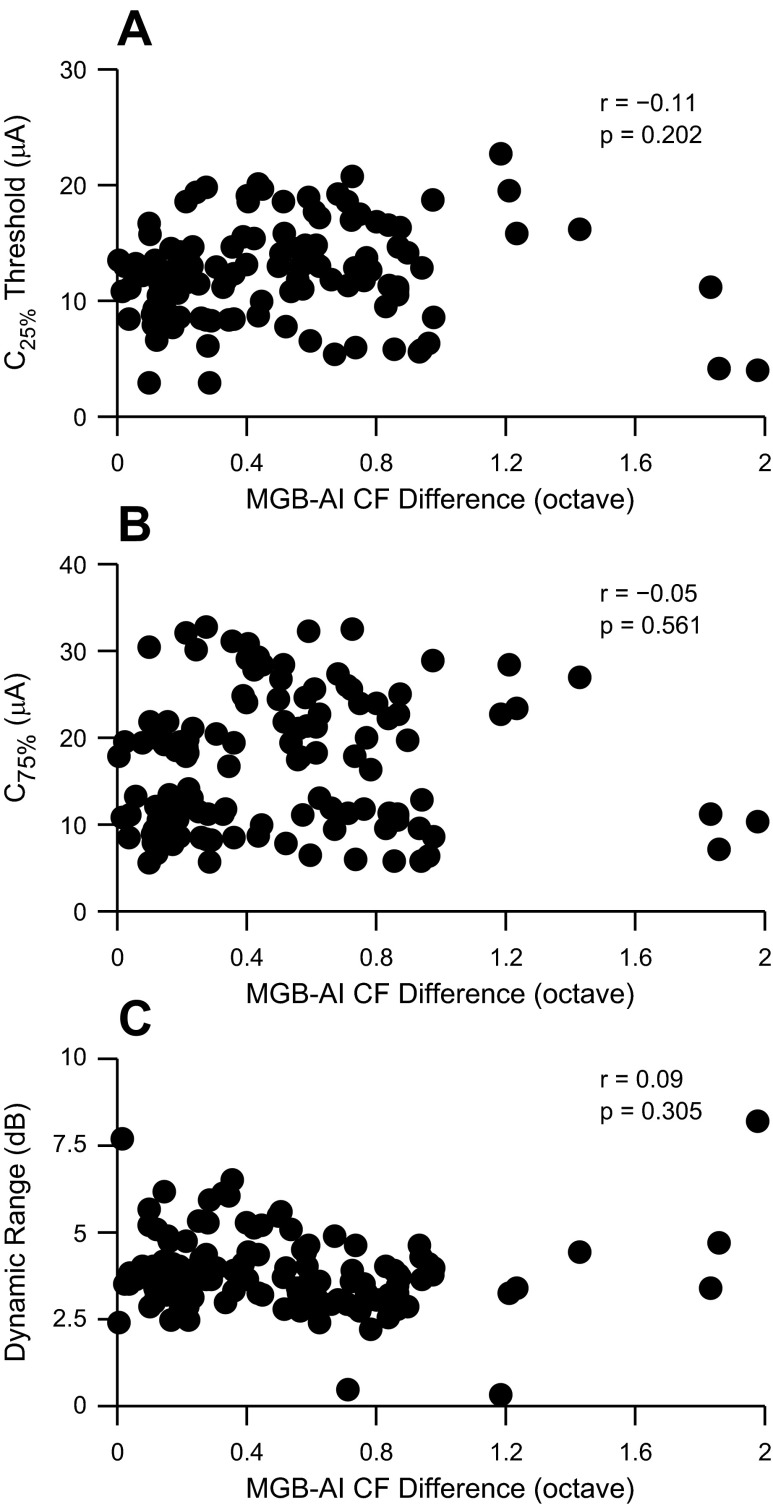
Thalamic projections to auditory cortex are topographic. Monosynaptically connected thalamocortical pairs usually have CFs within 1/3 octave (Miller et al. 2001a, 2001b). In this study, we focused on CF-matched locations between vMGB and AI. The vast majority of recordings were for thalamocortical CF differences of less than 1 octave (see Fig. 2B). Over this range, threshold was not significantly correlated (Fig. 10A) with CF difference (r = −0.11, P = 0.20, t-test). Additionally, neither C75% values (r = −0.05, P = 0.56, t-test) nor dynamic ranges (r = 0.09, P = 0.31, t-test) were correlated (Fig. 10, B and C) with CF difference. This result is broadly consistent with earlier mapping reports, where threshold changes were observed only when CF differences were greater than 1.5 octaves (Raggio and Schreiner 1999). Thus, for the generally CF-matched vMGB and AI sites described in this report, we could not detect significant correlations between cortical response parameters and slightly misaligned thalamocortical CF pairs.
Fig. 10.
Threshold (C25%), upper response current level (C75%), and dynamic range vs. vMGB-AI CF difference. A: threshold vs. CF difference (r = −0.11, P = 0.202, t-test). B: C75% vs. CF difference (r = −0.05, P < 0.561, t-test). C: dynamic range vs. CF difference (r = 0.09, P = 0.305, t-test). To differentiate points, abscissa points were jittered.
DISCUSSION
Cochlear implantation rehabilitation requires a suitably patent cochlea lumen and an intact auditory nerve. Since those conditions are not met in certain disorders that cause deafness, notably neurofibromatosis type II and labyrinthitis ossificans (El-Kashlan et al. 2003; Grayeli et al. 2008; Rauch et al. 1997), other auditory stations need to be explored for possible implantation. This motivated our study, which was the initial foray into understanding the effect of thalamic electrical stimulation on cortical activity patterns. We found that cortical response threshold and dynamic range to cathodic vMGB stimulation were relatively low and narrow, respectively. In the following, we discuss these results in the context of other electrical stimulation targets.
Summary of auditory station electrical stimulation sites.
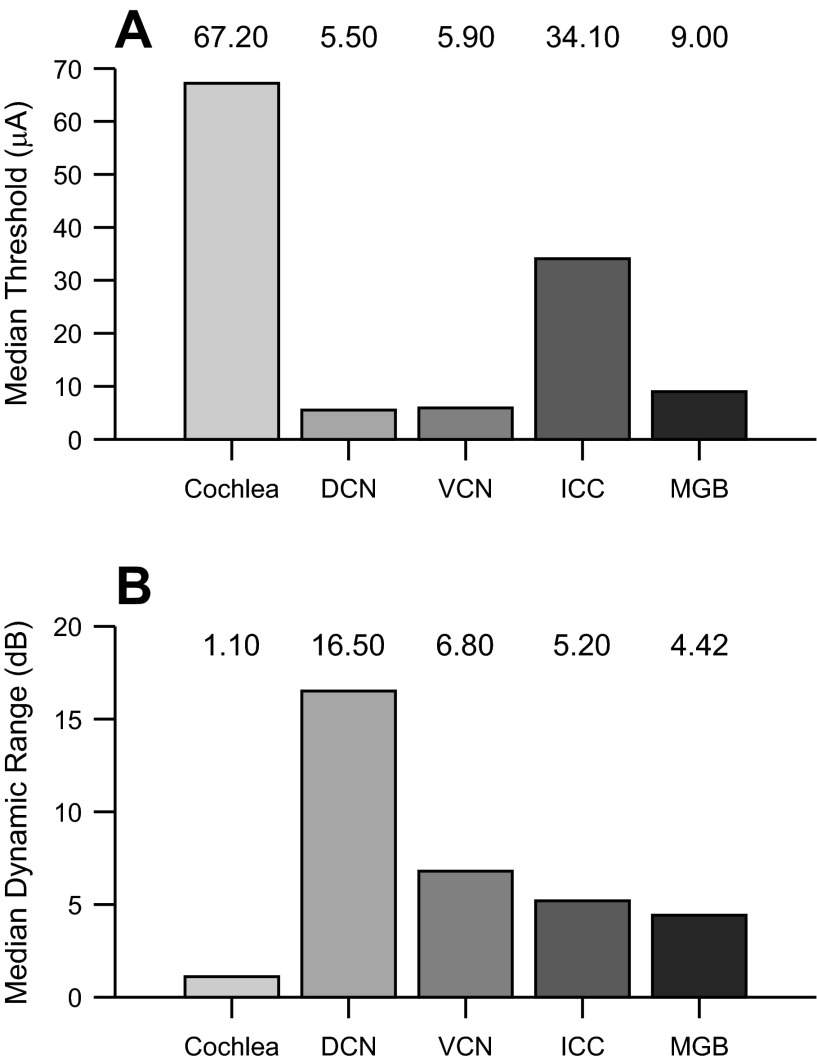
If the thalamus is to be a viable candidate for an auditory implant, then a comparison of cortical responses evoked from thalamic stimulation to responses evoked from cochlear and other central stations would provide an informative overview (Fig. 11). Previous studies used cathodic stimulation in the cochlea, dorsal cochlear nucleus (DCN), ventral cochlear nucleus (VCN), and the ICC in conjunction with cortical recordings (Bierer and Middlebrooks 2002; Lim and Anderson 2006; Takahashi et al. 2005). We first note that some differences may be due to charge density discrepancies in the various studies. Additionally, whereas the cochlear and ICC studies applied the same analysis as described in this report, the DCN and VCN study extracted threshold and dynamic range metrics by identifying how the neural response changed from spontaneous activity. Additionally, the DCN and VCN data were originally grouped according to low- and high-frequency regions, which we have averaged together in Fig. 11. Recognizing those caveats, we found threshold values from thalamic stimulation were comparable to those from DCN and VCN stimulation and were lower than those from cochlear or ICC stimulation (Fig. 11A). For example, cochlear stimulation had median cortical thresholds of ∼67 μA, although the 5th percentile was 37 μA and the 95th percentile was 119 μA, indicating a fairly wide range (Bierer and Middlebrooks 2002). Nonetheless, thresholds for thalamic stimulation were much lower than those for cochlear stimulation.
Fig. 11.
Summary of results for median threshold and median dynamic range for electrical stimulation of key auditory stations. A: median threshold of cortical responses to cochlear, dorsal cochlear nucleus (DCN), ventral cochlear nucleus (VCN), midbrain (ICC), and thalamic (vMGB) electrical stimulation. B: median dynamic range of cortical responses to electrical stimulation at key lemniscal auditory stations. Data for cochlear and midbrain stimulation (Bierer and Middlebrooks 2002; Lim and Anderson 2006) and for DCN and VCN stimulation (Takahashi et al. 2005) were replotted.
Thresholds for ICC electrical stimulation were found to be ∼30 μA (Lim and Anderson 2006), which is 3–4 times greater than for thalamic stimulation. Lower ICC threshold values were later reported by Lenarz et al. (2006), although the visual analysis technique employed in that report did not have the benefits of standardized methodology used by Lim and Anderson (2006). Given this, we compared our results to the earlier study (Lim and Anderson 2006). Cochlear thresholds were higher, which may be partially accounted for by modiolar and other osseous factors that impede current flow to the auditory nerve. Midbrain thresholds are also higher than thalamic thresholds, which may imply that the collicular-thalamic pathway is either relatively difficult to activate or that midbrain spatial topographies need to be carefully considered (Calixto et al. 2012; Lim and Anderson 2007b; Neuheiser et al. 2010). Indeed, with midbrain stimulation, threshold could not be identified in 8 of 88 sites because the current level could not be made high enough (Lim and Anderson 2006). The much lower thalamic threshold values indicate that an ATI may potentially provide a more power-efficient means of electrical stimulation than the AMI or cochlear implant.
We also compared the dynamic ranges of cortical responses to electrical stimulation. Thalamic stimulation dynamic range is similar to VCN and ICC stimulation (Fig. 11B). Cochlear stimulation dynamic range is the narrowest of all auditory stations. Taken together, thalamic electrical stimulation evokes cortical responses at a low current level and with a dynamic range that is comparable to other central auditory nuclei.
Threshold differences.
We found the majority of cortical responses saturated when thalamic stimulation current levels of 36 μA were reached. In contrast, midbrain stimulation did not saturate cortical responses at the highest levels that were used, 56 μA. One possible explanation for this difference may be due to charge density variations in the experimental preparations. Another explanation may be that thresholds decrease along the tectothalamocortical pathway. The magnitude of the decrease, however, is puzzling, since the change occurs over a single synapse. Perhaps the collicular-geniculate synapse is challenging to traverse, or the potential presence of inhibitory feedforward connections between colliculus and thalamus (Winer et al. 1996) may impede an effective transmission, although these possibilities likely need to be reconciled in future work. If higher thresholds are characteristic of the midbrain, then that indicates the thalamus would be an advantageous target for development of a more power-efficient central auditory implant.
Still, there may be multiple possible reasons for lower thresholds from electrical stimulation of the thalamus compared with the midbrain. First, compared with the vMGB, the ICC is a large laminated structure. Each layer contains maps of multiple properties, among which are temporal modulation, spectral modulation, bandwidth, and latency (Rodriguez et al. 2010; Schreiner and Langner 1988). Since the thalamus is smaller, highly compact, and one synapse removed, it may have been easier to effectively drive cortical responses, because greater precision may be required to relate midbrain stimulation sites with cortical recording locations. Second, studies in cats have demonstrated a significant inhibitory, monosynaptic feedforward projection from the midbrain to the thalamus (Winer et al. 1996). An uncoordinated/unbalanced stimulation of the excitatory and inhibitory feedforward system may result in a much less effective activation of the thalamus and subsequent stations due to undifferentiated inhibitory or disinhibitory action. By contrast, electrical stimulation below the midbrain may result in a more coordinated or balanced output of midbrain excitation and inhibition to the thalamus. Third, the ICC is the site of converging anatomical inputs from different brain stem nuclei. Stimulating regions in the ICC may only partially activate inputs to the thalamus, and thus cortex (Calixto et al. 2012). In contrast, thalamus receives information from the ICC after the multiple lines of information from functional domains have been processed and integrated. Fourth, it is challenging to record from CF-matched regions between the midbrain and the cortex or between the thalamus and the cortex. We used the cat, which allowed us easy access to AI. Our procedure was to first make an initial map of AI, then find a responsive thalamic site, and then insert our probe into a region with similar frequency preferences. This allowed our stimuli to cover the full acoustic and electrical stimulation response range of AI neurons. Because it also can be challenging to sample the full extent of ICC, insufficiently sampled midbrain and AI neurons also may have led to differences between the two studies (Lim and Anderson 2006).
The thalamic stimulation thresholds in our study differ from reported cochlear thresholds (Bierer and Middlebrooks 2002; Raggio and Schreiner 1994). A possible reason may be due to intrinsic cochlear anatomy: modiolar wall and neural survival factors. Using a different threshold estimation technique, Raggio and Schreiner (1994) reported stimulation thresholds of ∼1,000 μA. The Bierer and Middlebrooks study (2002) used cathodic biphasic pulses, whereas Raggio and Schreiner (1994) used anodic biphasic pulses. Different experimental conditions may have contributed to these different values, but it strongly appears that stimulus polarity has a substantial effect on cortical responses. When cathodic biphasic stimulation was used, thalamic thresholds were significantly lower than reported cochlear thresholds.
We also may compare our results to related in vitro work. One confounding factor in such a comparison is that the slice preparation may damage corticothalamic projections. With this caveat, we identified a pertinent thalamocortical slice study that examined the relationship between thalamic electrical stimulation and cortical extracellular responses (Rose and Metherate 2001). As a control, thresholds for orthodromic stimulation were compared with those for antidromic stimulation. Orthodromic thresholds result from stimulating thalamic afferents, and the mean cortical response threshold was 28 μA. Antidromic stimulation of corticothalamic projections resulted in a mean threshold of 214 μA. This implies that low-current thalamic stimulation activates relatively few corticothalamic cells and that it can strongly activate certain thalamocortical cells. Thus thalamic stimulation can be used to assess thalamocortical function (Rose and Metherate 2001).
The orthodromic stimulation thresholds reported by Rose and Metherate (2001) are higher than those in our study. However, the stimulation method also was different in the slice study: the pulses were monophasic and anodic. Monophasic pulses may produce differing results, although based on results from cochlear stimulation (Raggio and Schreiner 1994), the greatest difference probably resulted from using anodic stimulation. These factors may have contributed to differences found between the two studies.
There are three other differences that should be considered. First, compared with the intact animal, the slice preparation reduces the number of thalamocortical afferents that are available to drive AI responses. Second, it is difficult to ascertain functionally matched locations of AI in slice. Although the general spatial location of auditory fields can be described, the location of AI is often variable. Therefore, stimulation of vMGB may result in higher thresholds if the accompanying region is not AI but is another field. Third, we recorded multiunit activity, whereas the slice study used local field potentials (LFPs). Furthermore, the slice study did not measure spikes and LFPs at the same recording site. Thus the difference between multiunit activity and LFP thresholds cannot be determined until a study examines simultaneously recorded LFP and multiunit activity from the same recording site.
In the intact animal, the only other study in the literature that examined cortical responses to thalamic stimulation was performed in the visual system (Logothetis et al. 2010). The report examined how lateral geniculate nucleus (LGN) stimulation affected the blood oxygen level-dependent (BOLD) response in monkey primary visual cortex (V1). Significant suprathreshold V1 responses occurred for 10-μA anodic biphasic stimulation (see their supplementary Fig. 2). Although the authors did not systematically probe lower electrical stimulation levels, the results make it clear that appreciably lower current levels could have evoked responses. Since anodic stimulation was used, it is likely that much lower thresholds could have been achieved using cathodic stimulation. Additionally, BOLD signals measure cortical activity over a larger area than multiunit responses. Responses at current levels below 10 μA could have been recorded if the multiunit activity metric had been used. Thus, in the only other thalamic electrical stimulation study in the intact animal, the response thresholds were in reasonable concord with our report.
CF dependence of response parameters.
In this study we focused on finely sampling the activation curves of cortical sites that had CFs similar to those in the vMGB. This experimental approach practically precluded reconstruction of electrical stimulation topographic maps. Accordingly, our data are not appropriate to evaluate how electrical stimulation parameters vary with CF difference. However, insight drawn from AI response maps to cochlear electrical stimulation by Raggio and Schreiner (1999) would indicate that cortical responses can be similar over a considerable spatial extent. For acutely implanted cats, similar thresholds were found over regions covering at least 2 mm, corresponding to ∼2–2.5 octaves of the cochleotopic gradient (Imaizumi and Schreiner 2007). Thus, if recording sites do not vary by more than this amount, then CF-dependent thresholds will be difficult to observe. Since our experiments were designed as an initial foray to explore the feasibility of a thalamic stimulator for deafness, we focused on CF-matched locations and did not find strong CF dependencies.
That great care must be taken to find an effect of CF difference on response parameters was reported by Lim and Anderson (2006). They stimulated in the midbrain while recording from multiple locations in AI. They then calculated two threshold values: those for midbrain-cortical sites that had similar best frequencies (BF) and those for the AI sites that had the lowest thresholds. The mean threshold was 34.1 μA for BF-aligned sites, whereas it was 31.2 μA for the lowest threshold-aligned sites. This implies that sites that were not CF aligned could give the same or lower threshold values. Furthermore, the shape of the distributions was nearly identical (BF-aligned sites: SD = 17.4 μA, minimum value = 9.3 μA; lowest threshold-aligned sites: SD = 17.3 μA, minimum value = 9.3 μA). Overall, 45% of stimulated ICC sites elicited the lowest threshold responses at similar BF AI sites. Thus, although there is variability in matching threshold and BF, there does appear to be a threshold dependence on CF difference.
Lim and Anderson (2006) also studied the relationship of the maximum response to BF. They first identified the AI sites that evoked the greatest activity, and then noted BFs of the midbrain and AI sites. There was a tight correlation for BFs of the most active sites. Therefore, although they did not find that threshold was significantly correlated with BF, they did find that the maximum response varied with BF. These results parallel those in our report and, when considered with those from Raggio and Schreiner (1999) and Kral et al. (2009), suggest that to uncover the spatial distribution of AI responses to midbrain and thalamic electrical stimulation, large cortical regions, on the order of multiple octaves, need to be examined.
Outlook.
Initial insights into the feasibility of an auditory thalamic implant are encouraging. Guided by threshold and dynamic range information established in this exploratory investigation, further studies are required to assess neuronal and perceptual response features to parametric spatial and temporal variations in electrical thalamic stimulation. Complementary animal and human experiments will be helpful to define requirements for a thalamic speech processor, craft the global architecture for a family of thalamic deep brain stimulation leads for evaluation and to document the safety profile for chronic auditory thalamic stimulation. The delivery of a clinically deployable ATI to mitigate deafness in those patients who are not candidates for cochlear implantation appears achievable.
GRANTS
This research was supported by National Institutes of Health Grants DC011396 (S. W. Cheung) and DC02260 and MH077970 (C. E. Schreiner); The Coleman Fund; and Hearing Research, Incorporated.
DISCLOSURES
No conflicts of interest, financial or otherwise, are declared by the authors.
AUTHOR CONTRIBUTIONS
C.A.A., J.Y.S., and S.W.C. conception and design of research; C.A.A., J.Y.S., and S.W.C. performed experiments; C.A.A., J.Y.S., and S.W.C. analyzed data; C.A.A., J.Y.S., C.E.S., and S.W.C. interpreted results of experiments; C.A.A. and J.Y.S. prepared figures; C.A.A. and J.Y.S. drafted manuscript; C.A.A., J.Y.S., C.E.S., and S.W.C. edited and revised manuscript; C.A.A., J.Y.S., C.E.S., and S.W.C. approved final version of manuscript.
REFERENCES
- Bierer JA, Middlebrooks JC. Auditory cortical images of cochlear-implant stimuli: dependence on electrode configuration. J Neurophysiol 87: 478–492, 2002 [DOI] [PubMed] [Google Scholar]
- Calixto R, Lenarz M, Neuheiser A, Scheper V, Lenarz T, Lim HH. Co-activation of different neurons within an isofrequency lamina of the inferior colliculus elicits enhanced auditory cortical activation. J Neurophysiol 108: 1199–1210, 2012 [DOI] [PubMed] [Google Scholar]
- Cant NB, Benson CG. Multiple topographically organized projections connect the central nucleus of the inferior colliculus to the ventral division of the medial geniculate nucleus in the gerbil, Meriones unguiculatus. J Comp Neurol 503: 432–453, 2007 [DOI] [PubMed] [Google Scholar]
- Cant NB, Benson CG. Organization of the inferior colliculus of the gerbil (Meriones unguiculatus): differences in distribution of projections from the cochlear nuclei and the superior olivary complex. J Comp Neurol 495: 511–528, 2006 [DOI] [PMC free article] [PubMed] [Google Scholar]
- Cetas JS, Price RO, Crowe J, Velenovsky DS, McMullen NT. Dendritic orientation and laminar architecture in the rabbit auditory thalamus. J Comp Neurol 458: 307–317, 2003 [DOI] [PubMed] [Google Scholar]
- Cheung SW, Bedenbaugh PH, Nagarajan SS, Schreiner CE. Functional organization of squirrel monkey primary auditory cortex: responses to pure tones. J Neurophysiol 85: 1732–1749, 2001 [DOI] [PubMed] [Google Scholar]
- Colletti L, Shannon R, Colletti V. Auditory brainstem implants for neurofibromatosis type 2. Curr Opin Otolaryngol Head Neck Surg 20: 353–357, 2012 [DOI] [PubMed] [Google Scholar]
- Colletti V, Shannon R, Carner M, Veronese S, Colletti L. Outcomes in nontumor adults fitted with the auditory brainstem implant: 10 years' experience. Otol Neurotol 30: 614–618, 2009 [DOI] [PubMed] [Google Scholar]
- El-Kashlan HK, Ashbaugh C, Zwolan T, Telian SA. Cochlear implantation in prelingually deaf children with ossified cochleae. Otol Neurotol 24: 596–600, 2003 [DOI] [PubMed] [Google Scholar]
- Evans DG, Moran A, King A, Saeed S, Gurusinghe N, Ramsden R. Incidence of vestibular schwannoma and neurofibromatosis 2 in the North West of England over a 10-year period: higher incidence than previously thought. Otol Neurotol 26: 93–97, 2005 [DOI] [PubMed] [Google Scholar]
- Grayeli AB, Bouccara D, Kalamarides M, Ambert-Dahan E, Coudert C, Cyna-Gorse F, Sollmann WP, Rey A, Sterkers O. Auditory brainstem implant in bilateral and completely ossified cochleae. Otol Neurotol 24: 79–82, 2003 [DOI] [PubMed] [Google Scholar]
- Grayeli AB, Kalamarides M, Bouccara D, Ambert-Dahan E, Sterkers O. Auditory brainstem implant in neurofibromatosis type 2 and non-neurofibromatosis type 2 patients. Otol Neurotol 29: 1140–1146, 2008 [DOI] [PubMed] [Google Scholar]
- Huang CL, Winer JA. Auditory thalamocortical projections in the cat: laminar and areal patterns of input. J Comp Neurol 427: 302–331, 2000 [DOI] [PubMed] [Google Scholar]
- Imaizumi K, Schreiner CE. Spatial interaction between spectral integration and frequency gradient in primary auditory cortex. J Neurophysiol 98: 2933–2942, 2007 [DOI] [PubMed] [Google Scholar]
- Imig TJ, Morel A. Tonotopic organization in ventral nucleus of medial geniculate body in the cat. J Neurophysiol 53: 309–340, 1985 [DOI] [PubMed] [Google Scholar]
- Kanowitz SJ, Shapiro WH, Golfinos JG, Cohen NL, Roland JT., Jr Auditory brainstem implantation in patients with neurofibromatosis type 2. Laryngoscope 114: 2135–2146, 2004 [DOI] [PubMed] [Google Scholar]
- Kral A, Tillein J, Hubka P, Schiemann D, Heid S, Hartmann R, Engel AK. Spatiotemporal patterns of cortical activity with bilateral cochlear implants in congenital deafness. J Neurosci 29: 811–827, 2009 [DOI] [PMC free article] [PubMed] [Google Scholar]
- Lenarz M, Lim HH, Patrick JF, Anderson DJ, Lenarz T. Electrophysiological validation of a human prototype auditory midbrain implant in a guinea pig model. J Assoc Res Otolaryngol 7: 383–398, 2006 [DOI] [PMC free article] [PubMed] [Google Scholar]
- Lim HH, Anderson DJ. Antidromic activation reveals tonotopically organized projections from primary auditory cortex to the central nucleus of the inferior colliculus in guinea pig. J Neurophysiol 97: 1413–1427, 2007a [DOI] [PubMed] [Google Scholar]
- Lim HH, Anderson DJ. Auditory cortical responses to electrical stimulation of the inferior colliculus: implications for an auditory midbrain implant. J Neurophysiol 96: 975–988, 2006 [DOI] [PubMed] [Google Scholar]
- Lim HH, Anderson DJ. Spatially distinct functional output regions within the central nucleus of the inferior colliculus: implications for an auditory midbrain implant. J Neurosci 27: 8733–8743, 2007b [DOI] [PMC free article] [PubMed] [Google Scholar]
- Lim HH, Lenarz M, Lenarz T. Auditory midbrain implant: a review. Trends Amplif 13: 149–180, 2009 [DOI] [PMC free article] [PubMed] [Google Scholar]
- Lim HH, Lenarz T, Anderson DJ, Lenarz M. The auditory midbrain implant: effects of electrode location. Hear Res 242: 74–85, 2008 [DOI] [PubMed] [Google Scholar]
- Lim HH, Lenarz T, Joseph G, Battmer RD, Samii A, Samii M, Patrick JF, Lenarz M. Electrical stimulation of the midbrain for hearing restoration: insight into the functional organization of the human central auditory system. J Neurosci 27: 13541–13551, 2007 [DOI] [PMC free article] [PubMed] [Google Scholar]
- Loftus WC, Bishop DC, Oliver DL. Differential patterns of inputs create functional zones in central nucleus of inferior colliculus. J Neurosci 30: 13396–13408, 2010 [DOI] [PMC free article] [PubMed] [Google Scholar]
- Logothetis NK, Augath M, Murayama Y, Rauch A, Sultan F, Goense J, Oeltermann A, Merkle H. The effects of electrical microstimulation on cortical signal propagation. Nat Neurosci 13: 1283–1291, 2010 [DOI] [PubMed] [Google Scholar]
- Marangos N, Stecker M, Sollmann WP, Laszig R. Stimulation of the cochlear nucleus with multichannel auditory brainstem implants and long-term results: Freiburg patients. J Laryngol Otol Suppl 114: 27–31, 2000 [DOI] [PubMed] [Google Scholar]
- McCreery DB. Cochlear nucleus auditory prostheses. Hear Res 242: 64–73, 2008 [DOI] [PubMed] [Google Scholar]
- Middlebrooks JC, Snyder RL. Auditory prosthesis with a penetrating nerve array. J Assoc Res Otolaryngol 8: 258–279, 2007 [DOI] [PMC free article] [PubMed] [Google Scholar]
- Middlebrooks JC, Snyder RL. Intraneural stimulation for auditory prosthesis: modiolar trunk and intracranial stimulation sites. Hear Res 242: 52–63, 2008 [DOI] [PubMed] [Google Scholar]
- Miller LM, Escabí MA, Read HL, Schreiner CE. Functional convergence of response properties in the auditory thalamocortical system. Neuron 32: 151–160, 2001a [DOI] [PubMed] [Google Scholar]
- Miller LM, Escabí MA, Read HL, Schreiner CE. Spectrotemporal receptive fields in the lemniscal auditory thalamus and cortex. J Neurophysiol 87: 516–527, 2002 [DOI] [PubMed] [Google Scholar]
- Miller LM, Escabí MA, Schreiner CE. Feature selectivity and interneuronal cooperation in the thalamocortical system. J Neurosci 21: 8136–8144, 2001b [DOI] [PMC free article] [PubMed] [Google Scholar]
- Morest DK. The laminar structure of the medial geniculate body of the cat. J Anat 99: 143–160, 1965 [PMC free article] [PubMed] [Google Scholar]
- Neuheiser A, Lenarz M, Reuter G, Calixto R, Nolte I, Lenarz T, Lim HH. Effects of pulse phase duration and location of stimulation within the inferior colliculus on auditory cortical evoked potentials in a guinea pig model. J Assoc Res Otolaryngol 11: 689–708, 2010 [DOI] [PMC free article] [PubMed] [Google Scholar]
- Otto SR, Shannon RV, Wilkinson EP, Hitselberger WE, McCreery DB, Moore JK, Brackmann DE. Audiologic outcomes with the penetrating electrode auditory brainstem implant. Otol Neurotol 29: 1147–1154, 2008 [DOI] [PubMed] [Google Scholar]
- Raggio MW, Schreiner CE. Neuronal responses in cat primary auditory cortex to electrical cochlear stimulation. I. Intensity dependence of firing rate and response latency. J Neurophysiol 72: 2334–2359, 1994 [DOI] [PubMed] [Google Scholar]
- Raggio MW, Schreiner CE. Neuronal responses in cat primary auditory cortex to electrical cochlear stimulation. III. Activation patterns in short- and long-term deafness. J Neurophysiol 82: 3506–3526, 1999 [DOI] [PubMed] [Google Scholar]
- Raggio MW, Schreiner CE. Neuronal responses in cat primary auditory cortex to electrical cochlear stimulation: IV. Activation pattern for sinusoidal stimulation. J Neurophysiol 89: 3190–3204, 2003 [DOI] [PubMed] [Google Scholar]
- Rauch SD, Herrmann BS, Davis LA, Nadol JB., Jr Nucleus 22 cochlear implantation results in postmeningitic deafness. Laryngoscope 107: 1606–1609, 1997 [DOI] [PubMed] [Google Scholar]
- Rodrigues-Dagaeff C, Simm G, De Ribaupierre Y, Villa A, De Ribaupierre F, Rouiller EM. Functional organization of the ventral division of the medial geniculate body of the cat: evidence for a rostro-caudal gradient of response properties and cortical projections. Hear Res 39: 103–125, 1989 [DOI] [PubMed] [Google Scholar]
- Rodriguez FA, Read HL, Escabi MA. Spectral and temporal modulation tradeoff in the inferior colliculus. J Neurophysiol 103: 887–903, 2010 [DOI] [PMC free article] [PubMed] [Google Scholar]
- Rose HJ, Metherate R. Thalamic stimulation largely elicits orthodromic, rather than antidromic, cortical activation in an auditory thalamocortical slice. Neuroscience 106: 331–340, 2001 [DOI] [PubMed] [Google Scholar]
- Rouiller EM, Rodrigues-Dagaeff C, Simm G, De Ribaupierre Y, Villa A, De Ribaupierre F. Functional organization of the medial division of the medial geniculate body of the cat: tonotopic organization, spatial distribution of response properties and cortical connections. Hear Res 39: 127–142, 1989 [DOI] [PubMed] [Google Scholar]
- Samii A, Lenarz M, Majdani O, Lim HH, Samii M, Lenarz T. Auditory midbrain implant: a combined approach for vestibular schwannoma surgery and device implantation. Otol Neurotol 28: 31–38, 2007 [DOI] [PubMed] [Google Scholar]
- Schreiner CE, Langner G. Laminar fine structure of frequency organization in auditory midbrain. Nature 388: 383–386, 1997 [DOI] [PubMed] [Google Scholar]
- Schreiner CE, Langner G. Periodicity coding in the inferior colliculus of the cat. II. Topographical organization. J Neurophysiol 60: 1823–1840, 1988 [DOI] [PubMed] [Google Scholar]
- Schreiner CE, Raggio MW. Neuronal responses in cat primary auditory cortex to electrical cochlear stimulation. II. Repetition rate coding. J Neurophysiol 75: 1283–1300, 1996 [DOI] [PubMed] [Google Scholar]
- Schreiner CE, Sutter ML. Topography of excitatory bandwidth in cat primary auditory cortex: single-neuron versus multiple-neuron recordings. J Neurophysiol 68: 1487–1502, 1992 [DOI] [PubMed] [Google Scholar]
- Schwartz MS, Otto SR, Shannon RV, Hitselberger WE, Brackmann DE. Auditory brainstem implants. Neurotherapeutics 5: 128–136, 2008 [DOI] [PMC free article] [PubMed] [Google Scholar]
- Shepherd RK, McCreery DB. Basis of electrical stimulation of the cochlea and the cochlear nucleus. Adv Otorhinolaryngol 64: 186–205, 2006 [DOI] [PubMed] [Google Scholar]
- Takahashi H, Nakao M, Kaga K. Accessing ampli-tonotopic organization of rat auditory cortex by microstimulation of cochlear nucleus. IEEE Trans Biomed Eng 52: 1333–1344, 2005 [DOI] [PubMed] [Google Scholar]
- Wilson BS, Dorman MF. Cochlear implants: a remarkable past and a brilliant future. Hear Res 242: 3–21, 2008 [DOI] [PMC free article] [PubMed] [Google Scholar]
- Winer JA. The functional architecture of the medial geniculate body and the primary auditory cortex. In: The Mammalian Auditory Pathway, edited by Webster DB, Popper AN, Fay RR. New York: Springer, 1992, p. 222–409 [Google Scholar]
- Winer JA, Saint Marie RL, Larue DT, Oliver DL. GABAergic feedforward projections from the inferior colliculus to the medial geniculate body. Proc Natl Acad Sci USA 93: 8005–8010, 1996 [DOI] [PMC free article] [PubMed] [Google Scholar]
- Zeng FG, Rebscher S, Harrison W, Sun X, Feng H. Cochlear implants: system design, integration, evaluation. IEEE Rev Biomed Eng 1: 115–142, 2008 [DOI] [PMC free article] [PubMed] [Google Scholar]


