

Abstract
Bronchial wall area percent (WA% = 100 × wall area/total bronchial cross sectional area) is a standard computed tomographic (CT) measure of central airway morphology utilized in smokers with chronic obstructive pulmonary disease (COPD). Although it provides significant clinical correlations, the range of reported WA% is narrow. This suggests limited macroscopic change in response to smoking or that remodeling proportionally affects the airway wall and lumen dimensions such that their ratio is preserved. The objective of this study is to assess central airway wall area (WA), lumen area (Ai), and total bronchial area (Ao) from CT scans of 5,179 smokers and 92 never smoking normal subjects. In smokers, WA, Ai, and Ao were positively correlated with forced expiratory volume in 1 s (FEV1) expressed as a percent of predicted (FEV1%), and the WA% was negatively correlated with FEV1% (P < 0.0001 for all comparisons). Importantly, smokers with lower FEV1% tended to have airways of smaller cross-sectional area with lower WA. The increases in the WA% across GOLD stages of chronic obstructive pulmonary disease (COPD) can therefore not be due to increases in WA. The data suggest two possible origins for the WA% increases: 1) central airway remodeling resulting in overall reductions in airway caliber in excess of the decreased WA or 2) those with COPD had smaller native airways before they began smoking. In both cases, these observations provide an explanation for the limited range of values of WA% across stages of COPD.
Keywords: lumen, wall area, chronic obstructive pulmonary disease, computed tomographic scan
smoking-related airway disease is believed to manifest on computed tomographic (CT) scan as airway wall thickening with encroachment on the airway lumen (10). For the purposes of functional, genetic, and epidemiological investigations utilizing CT scans of the chest, this remodeling process is most commonly presented as wall area percent (WA% = wall area/total bronchial cross-sectional area × 100). Additional measures of bronchial morphology such as wall area (WA), lumen area (Ai), and total bronchial area (Ao = WA + Ai) have been explored but are poorer predictors of lung function (5, 10). In fact, although not reaching statistical significance, Nakano et al. (10) reported that the Ao of the apical segment of the right upper lobe (RB1) may be directly correlated to a subject's forced expiratory volume in 1 s (FEV1) expressed as a percent of predicted (FEV1%); those with greater Ao in RB1 bronchi tended to have less obstruction determined spirometrically.
Although there are highly statistically significant correlations between the airway WA% and the FEV1, forced vital capacity (FVC), and FEV1/FVC (7, 10), there is a very narrow range of WA% found in a cohort of subjects with chronic obstructive pulmonary disease (COPD) spanning all degrees of disease severity. Coxson et al. noted that in the fifth-generation airway, WA% ranged between ∼68 and 75% in a cohort whose FEV1 was 40–120% of predicted (2). The direct relationship between both Ao and Ai with lung function suggests that those with more severe COPD have smaller airways with narrower lumens. If smoking-related central airway remodeling manifests as geometrically similar reductions in all components of the airway (specifically WA, Ao, and Ai), a summary statistic such as the WA%, being a dimensionless ratio, would be relatively insensitive to this process despite the magnitude of these changes.
We therefore sought to further examine the nature of central airway remodeling in smokers and more specifically how airway WA is related to the Ao across different spirometric stages of COPD severity. Based on prior work by Tiddens et al. (15), we anticipated that those subjects with the greatest wall areas would have the most severe expiratory airflow obstruction. To carry out this investigation, we examined CT, epidemiological, and spirometric data from over 5,000 subjects enrolled in the COPDGene Study, including 92 life-long nonsmokers with normal lung function.
MATERIALS AND METHODS
The COPDGene Study has been described in detail previously (13). Briefly, the goal of this study was to recruit ∼10,000 non-Hispanic White and African-American smokers aged 45–80 yr for the purposes of identifying genetic predictors of the disease. Included in this investigation were additional airway data from 92 never-smokers with normal lung function and no history of lung disease (19). Subjects with active lung diseases other than asthma, emphysema, or COPD were excluded. The COPDGene Study was approved by the institutional review board (IRB) of all participating centers.
Spirometric measures of lung function [FEV1, FVC, and the ratio of FEV1 to FVC (FEV1/FVC)] were performed using the Easy-One spirometer (ndd Medical Technologies, Andover, MA) before and after administration of a short-acting inhaled bronchodilating medication (albuterol) per American Thoracic Society recommendations (1). These measures were expressed as a percent of predicted values for age, height, race, and gender (3). From these data, subjects could be classified into the GOLD stages of disease severity (12). Smokers with no evidence of spirometric obstruction (FEV1/FVC > 0.7) were categorized as being “at risk” for the development of COPD. In our investigation, smokers with a proportionally reduced FEV1 and FVC with preserved ratio (GOLD U) were excluded from analysis (17).
CT scans.
Volumetric CT scans of the chest were performed at both maximal inflation and relaxed exhalation (13). Morphometric assessment of the airways was performed on the maximally inflated scans using VIDA software (Vida Diagnostics, Iowa City, IA), as described previously (8). Briefly, the lumen-wall and wall-parenchymal boundaries were localized simultaneously in 3D using both density information (i.e., transition in density between structures) as well as a priori assumptions of biologically plausible airway structures. These borders were then represented in a graph structure, and an optimization process was used to detect the final edges (8, 16). The image resolution was dependent on both the slice thickness (z), which ranged from 0.5 to 0.75 mm, and the in-plane pixel size, which was determined by the field of view (FOV). The image voxel size in COPDGene ranged from 0.2 to 0.6 mm3, with a mean value of 0.3 mm3.
For the purposes of this investigation, data were collected from the segmental and subsegmental generations of the apical segment of the right upper lobe (RB1) and the posterior-basal segmental and subsegmental bronchi of the right lower lobe (RB10). Measures of airway WA, Ai, Ao, and WA% were calculated. Low attenuation areas (LAA) thought to reflect emphysematous destruction of the lung parenchyma were defined using a Hounsfield Unit threshold of −950 (%LAA-950).
Analysis.
Data are presented as means ± SD and compared using t-tests. Univariate linear regression was used to examine the relationship between CT measures of airway morphology (WA, Ai, Ao, WA%) and lung function assessed by FEV1 expressed as percent predicted (FEV1%). The dependence of airway morphology on FEV1% was expressed as Pearson correlation coefficients. Airway morphology was further adjusted for sex, height, age at the time of CT scanning, and %LAA-950 in subsequent multivariate linear regression. Differences in airway morphology (WA, Ao, Ai, WA%) were compared across GOLD stages using ANOVA. Statistical analysis was performed using SAS 9.2 (Carey, NC). P values of <0.05 were considered statistically significant.
RESULTS
We first examined central airway morphology among smokers. Baseline characteristics of this group are outlined in Table 1. A total of 5,179 COPDGene Study subjects with complete segmental airway CT data were included in this investigation. A subset of 2,717 of these subjects also had additional complete subsegmental RB1 and RB10 airway data available for analysis. For all comparisons, there was a direct relationship between WA and FEV1% (P < 0.0001), a direct relationship between Ai and FEV1% (P < 0.0001), a direct relationship between Ao and FEV1% (P < 0.0001), and an inverse relationship between WA% and FEV1% (P < 0.0001) for both the segmental (n = 5,179) and subsegmental (n = 2,717) airway generations of RB1 and RB10 (Table 2). Statistically significant associations between the WA, Ai, Ao, and WA% and the FEV1% held after adjustment for sex, height, and age (data not shown).
Table 1.
Demographics and lung function for the never-smokers and smokers cohorts
| Segmental | Subsegmental | |
|---|---|---|
| Never-smoking subjects | ||
| n | 92 | 91 |
| Men (%) | 29 (31.5%) | 29 (31.9%) |
| Age, yr | 62.7 ± 9 | 62.7 ± 9 |
| FEV1% | 103.5 ± 13.8 | 103.6 ± 13.9 |
| Smokers | ||
| n | 5,179 | 2,717 |
| Men (%) | 2,905 (56.1%) | 1,427 (52.5%) |
| Age, yr | 60.4 ± 9.2 | 61.3 ± 9.2 |
| FEV1% | 77 ± 27.4 | 75.6 ± 28.3 |
| GOLD stages | ||
| At risk | 2,521 | 1,276 |
| GOLD 1 | 483 | 231 |
| GOLD 2 | 1,104 | 587 |
| GOLD 3 | 690 | 400 |
| GOLD 4 | 381 | 223 |
FEV1, forced expiratory volume in 1 s.
Table 2.
Univariate associations between the FEV1% and objective measures of airway morphology
| Airway Morphology |
||||||||
|---|---|---|---|---|---|---|---|---|
| Never-Smoking Normal Subjects |
Smokers |
|||||||
| WA | Ai | Ao | WA% | WA | Ai | Ao | WA% | |
| RB1_Seg | ||||||||
| FEV1% | r = −0.17 | r = 0.12 | r = 0.15 | r = −0.12 | r = 0.15 | r = 0.18 | r = 0.17 | r = −0.26 |
| P < 0.1 | P < 0.25 | P < 0.15 | P < 0.25 | P < 0.0001 | P < 0.0001 | P < 0.0001 | P < 0.0001 | |
| RB1_Subseg | ||||||||
| FEV1% | r = 0.26 | r = 0.28 | r = 0.27 | r = −0.25 | r = 0.20 | r = 0.28 | r = 0.24 | r = −0.32 |
| P < 0.01 | P < 0.008 | P < 0.009 | P < 0.01 | P < 0.0001 | P < 0.0001 | P < 0.0001 | P < 0.0001 | |
| RB10_Seg | ||||||||
| FEV1% | r = −0.23 | r = 0.30 | r = 0.28 | r = −0.31 | r = 0.19 | r = 0.27 | r = 0.24 | r = −0.38 |
| P < 0.03 | P < 0.003 | P < 0.008 | P < 0.002 | P < 0.0001 | P < 0.0001 | P < 0.0001 | P < 0.0001 | |
| RB10_Subseg | ||||||||
| FEV1% | r = 0.39 | r = 0.37 | r = 0.39 | r = −0.24 | r = 0.23 | r = 0.28 | r = 0.25 | r = −0.29 |
| P < 0.0001 | P < 0.0002 | P < 0.0001 | P < 0.02 | P < 0.0001 | P < 0.0001 | P < 0.0001 | P < 0.0001 | |
Univariate associations (Pearson correlation coefficients r) between the FEV1% and objective measures of airway morphology: wall area (WA), lumen area (Ai), total bronchial area (Ao), and wall area percent (WA%). Data are provided for both segmental (_seg; n = 92 never-smoking normal subjects, n = 5,179 smokers) and subsegmental (_subseg; n = 91 never-smoking normal subjects, n = 2717 smokers) branches of RB1 and RB10.
Morphometric assessments (WA, Ai, Ao, and WA%) of RB1 and RB10 segmental airways as a function of GOLD stage are presented in Tables 3 (men) and 4 (women) and Fig. 1. In general, the mean segmental wall area, lumen area, and total bronchial area of both RB1 and RB10 decreased with higher GOLD stages for both men and women. Later stages of disease were characterized by reductions in the size of Ao, including both its wall and lumen. However, it also appeared that airway lumen decreased at a slightly faster rate than the airway wall, such that the net effect is only a subtle increase in WA%. This can also be seen in Tables 3–6 for the segmental and subsegmental airways.
Table 3.
Objective morphology of the segmental airways (RB1 and RB10) in men
| Never-Smokers (n = 29) |
At Risk (n = 1,379) |
GOLD 1 (n = 286) |
GOLD 2 (n = 611) |
GOLD 3 (n = 405) |
GOLD 4 (n = 224) |
|||||||
|---|---|---|---|---|---|---|---|---|---|---|---|---|
| Mean | SD | Mean | SD | Mean | SD | Mean | SD | Mean | SD | Mean | SD | |
| RB1: men | ||||||||||||
| Wall area | 39.1 | 7.8 | 38.6 | 9.9 | 37.3 | 8.9 | 36.5 | 10.2 | 35.4 | 9.1 | 34.5+ | 9.3 |
| Lumen area | 29.8 | 9.4 | 26.7 | 13.1 | 25.0 | 9.2 | 23.7 | 13.0 | 21.8 | 8.6 | 21.1+ | 8.8 |
| Total bronchial area | 68.9 | 16.7 | 65.4 | 22.3 | 62.3 | 17.5 | 60.2 | 22.3 | 57.3 | 17.2 | 55.7+ | 17.6 |
| Wall area percent | 57.3 | 3.3 | 60.1* | 4.2 | 60.6 | 3.9 | 62.0 | 4.5 | 62.7 | 4.0 | 63.0+ | 4.1 |
| RB10: men | ||||||||||||
| Wall area | 39.3 | 5 | 38.4 | 7.9 | 37.6 | 9.3 | 36.1 | 8.0 | 34.7 | 8.1 | 34.1† | 9.4 |
| Lumen area | 31.5 | 5.4 | 28.0 | 10.7 | 26.7 | 11.2 | 23.6 | 8.5 | 21.9 | 10.6 | 21.3† | 9.9 |
| Total bronchial area | 70.8 | 10.1 | 66.4 | 17.9 | 64.3 | 20.2 | 59.7 | 16.0 | 56.6 | 17.9 | 55.4† | 18.7 |
| Wall area percent | 55.6 | 2.1 | 58.6* | 4.1 | 59.2 | 3.7 | 61.1 | 3.9 | 62.3 | 4.2 | 62.4† | 4.2 |
Data are shown for never-smoking normals, smokers with normal lung function (at risk), and those with GOLD stages 1–4 disease. P values are provided for the comparisons of never-smokers and the at risk cohort. Areas are presented in mm2.
Significant difference for comparisons between the never-smokers and smokers with normal lung function (at risk) (P < 0.05).
Significant difference for differences in airway morphology across GOLD stages 1–4 (P < 0.05).
Table 4.
Objective morphology of the segmental airways (RB1 and RB10) in women
| Never-Smokers (n = 62) |
At Risk (n = 1,142) |
GOLD 1 (n = 197) |
GOLD 2 (n = 493) |
GOLD 3 (n = 285) |
GOLD 4 (n = 157) |
|||||||
|---|---|---|---|---|---|---|---|---|---|---|---|---|
| Mean | SD | Mean | SD | Mean | SD | Mean | SD | Mean | SD | Mean | SD | |
| RB1: women | ||||||||||||
| Wall area | 31.5 | 7.5 | 32.0 | 7.9 | 30.5 | 7.7 | 29.0 | 7.7 | 29.1 | 7.6 | 28.0† | 8.2 |
| Lumen area | 23.4 | 10 | 21.9 | 10.0 | 20.8 | 9.2 | 18.3 | 7.9 | 18.4 | 8.3 | 17.5† | 9.7 |
| Total bronchial area | 54.8 | 16.9 | 53.9 | 17.1 | 51.3 | 16.4 | 47.3 | 15.0 | 47.5 | 15.4 | 45.5† | 17.4 |
| Wall area percent | 58.5 | 4.4 | 60.3* | 4.3 | 60.4 | 4.0 | 62.2 | 4.4 | 62.4 | 4.5 | 62.8† | 4.4 |
| RB10: women | ||||||||||||
| Wall area | 32.4 | 5.1 | 32.5 | 6.2 | 30.7 | 5.9 | 29.4 | 5.9 | 29.0 | 6.1 | 28.8† | 6.4 |
| Lumen area | 24.6 | 5.7 | 23.3 | 7.8 | 21.6 | 6.9 | 18.9 | 5.8 | 18.3 | 5.8 | 17.9† | 6.4 |
| Total bronchial area | 57.1 | 10.5 | 55.8 | 13.4 | 52.2 | 12.5 | 48.3 | 11.3 | 47.4 | 11.5 | 46.7† | 12.5 |
| Wall area percent | 57.1 | 2.5 | 59.0* | 3.9 | 59.4 | 3.8 | 61.4 | 3.5 | 61.9 | 3.6 | 62.4† | 4.0 |
Data are shown for never-smoking normals, smokers with normal lung function (at risk), and those with GOLD stages 1–4 disease. P values are provided for the comparisons of never-smokers and the at risk cohort. Areas are presented in mm2.
Significant difference for comparisons between the never-smokers and smokers with normal lung function (at risk) (P < 0.05).
Significant difference for differences in airway morphology across GOLD stages 1–4 (P < 0.05).
Fig. 1.
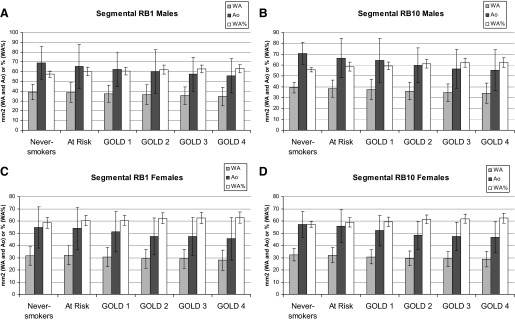
Left: the mean wall area (WA), total bronchial area (Ao), and WA percent (WA%) of RB1 for men and women, respectively. Right: the same measures for RB10 in men and women. Data includes airway morphology of never-smokers, smokers with normal lung function (“at risk”), and smokers with a range of disease severity (GOLD 1, 2, 3, and 4). Values on the y-axis are either in mm2 (WA and Ao) or a % (WA%).
Table 6.
Objective morphology of the subsegmental airways (RB1 and RB10) in women
| Never-Smokers (n = 62) |
At Risk (n = 644) |
GOLD 1 (n = 90) |
GOLD 2 (n = 284) |
GOLD 3 (n = 175) |
GOLD 4 (n = 97) |
|||||||
|---|---|---|---|---|---|---|---|---|---|---|---|---|
| Mean | SD | Mean | SD | Mean | SD | Mean | SD | Mean | SD | Mean | SD | |
| RB1_Subseg: women | ||||||||||||
| Wall area | 21.5 | 5.5 | 21.7 | 5.5 | 20.4 | 5.3 | 18.9 | 5.1 | 18.3 | 4.7 | 18.3 | 5.3 |
| Lumen area | 13.6 | 4.8 | 13.3 | 4.5 | 12.3 | 4.1 | 10.9 | 4.3 | 9.9 | 3.2 | 10.0 | 3.5 |
| Total bronchial area | 35.1 | 10.3 | 35.0 | 9.8 | 32.8 | 9.2 | 29.8 | 9.2 | 28.1 | 7.7 | 28.3 | 8.6 |
| Wall area percent | 62 | 2.9 | 62.5 | 3.3 | 62.7 | 3.2 | 64.3 | 3.9 | 65.3 | 3.5 | 65.0 | 3.2 |
| RB10_Subseg: women | ||||||||||||
| Wall area | 22.5 | 6.2 | 23.7 | 6.8 | 22.3 | 6.7 | 20.0 | 6.6 | 20 | 6 | 19.3 | 6.1 |
| Lumen area | 14.4 | 5.7 | 14.9 | 6.1 | 14 | 5.9 | 11.7 | 5.3 | 11.4 | 4.7 | 10.9 | 4.5 |
| Total bronchial area | 36.9 | 11.8 | 38.7 | 12.7 | 36.3 | 12.5 | 31.7 | 11.7 | 31.3 | 10.6 | 30.2 | 10.5 |
| Wall area percent | 61.9 | 3.7 | 62.2 | 3.8 | 62.5 | 4.0 | 64.2 | 3.9 | 64.5 | 3.8 | 64.7 | 3.3 |
Data are shown for never-smoking normals, smokers with normal lung function (at risk), and those with GOLD stages 1–4 disease. P values are provided for the comparisons of never-smokers and the at risk cohort. Areas are presented in mm2.
Table 5.
Objective morphology of the subsegmental airways (RB1 and RB10) in men
| Never-Smokers (n = 29) |
At Risk (n = 632) |
GOLD 1 (n = 141) |
GOLD 2 (n = 303) |
GOLD 3 (n = 225) |
GOLD 4 (n = 126) |
|||||||
|---|---|---|---|---|---|---|---|---|---|---|---|---|
| Mean | SD | Mean | SD | Mean | SD | Mean | SD | Mean | SD | Mean | SD | |
| RB1_Subseg: men | ||||||||||||
| Wall area | 26.2 | 4.8 | 25.0 | 6.2 | 25.6 | 6.4 | 23.9 | 6.7 | 22.6 | 6.3 | 21.5† | 6.8 |
| Lumen area | 18.9 | 5.1 | 15.9* | 4.9 | 16.3 | 5.1 | 14.3 | 5.2 | 13.0 | 4.5 | 12.3† | 5.2 |
| Total bronchial area | 45 | 9.7 | 40.9* | 10.9 | 41.9 | 11.3 | 38.3 | 11.6 | 35.6 | 10.6 | 33.9† | 11.7 |
| Wall area percent | 58.5 | 2.8 | 61.5* | 3.1 | 61.4 | 3.0 | 63 | 3.5 | 63.9 | 3.7 | 64.4† | 4.2 |
| RB10_Subseg: men | ||||||||||||
| Wall area | 24.6 | 7.2 | 27.1 | 8.6 | 25.5 | 7.5 | 24 | 8.6 | 23.0 | 7.2 | 21.9† | 7.6 |
| Lumen area | 16 | 5.8 | 17.6 | 7.5 | 16.3 | 5.8 | 14.5 | 6.8 | 13.1 | 5.1 | 12.6† | 5.3 |
| Total bronchial area | 40.6 | 12.9 | 44.7 | 15.9 | 41.8 | 13.2 | 38.6 | 15.2 | 36.1 | 12.1 | 34.5† | 12.8 |
| Wall area percent | 61 | 3 | 61.4 | 3.7 | 61.5 | 2.9 | 63.1 | 3.9 | 64.2 | 3.5 | 64.0† | 3.6 |
Data are shown for never-smoking normals, smokers with normal lung function (at risk), and those with GOLD stages 1–4 disease. P values are provided for the comparisons of never-smokers and the at risk cohort. Areas are presented in mm2.
Significant difference for comparisons between the never-smokers and smokers with normal lung function (at risk) (P < 0.05).
Significant difference for differences in airway morphology across GOLD stages 1–4 (P < 0.05).
Figure 2 provides visual representations of bronchi in RB10 (segmental generation) in axial CT scan images from a smoker with normal lung function and a smoker with GOLD 4 disease. These images are examples showing that, in GOLD 4 disease, the total bronchial area is reduced, with a resulting smaller lumen and wall area.
Fig. 2.

Axial images of a smoker with normal lung function (A) and GOLD 4 chronic obstructive pulmonary diseas (COPD; B). Note the airways highlighted by the white arrows. A: the lumens (Ai) and Ao are larger. B: the Ao is reduced with a resulting smaller Ai and WA.
COPDGene also included a cohort of 92 never-smokers (29 men and 63 women) with no history of lung disease and whose FEV1 ranged from 80 to 120% of predicted (mean 103.5%) (Table 1). Using CT data from these subjects, we sought to determine whether quantitative assessments of airway morphology were related to lung function in a fashion similar to what was observed in the smokers. To do this, we began by examining the associations between WA, Ai, Ao, and WA% and the FEV1% (Table 2). For the segmental airways, RB1 morphology was not associated with lung function. By contrast, RB10 morphologies (WA, Ai, Ao, and WA%) were all significantly associated with the FEV1%. Similarly, in the subsegmental airways, objective measures of both RB1 (n = 91) and RB10 (n = 92) were all significantly associated with FEV1%. The magnitude and direction of these associations was similar to that observed in the smokers (Table 2).
DISCUSSION
This analysis of over 5,000 participants in the COPDGene Study investigated CT-based measures of airway morphology in normal never-smokers and smokers exhibiting progressive stages of COPD. As demonstrated previously (2, 10), we observed that those smokers with the greatest segmental WA% tended to have the greatest degree of expiratory airflow obstruction. Furthermore, we found that both never-smoking normals and smokers with lower FEV1% had smaller WA, Ai, and Ao of both RB1 and RB10 bronchi; those with the smallest total bronchial area also had the largest WA%. The strength and direction of the correlation between measures of airway morphology and the FEV1% were similar in the never-smokers and smokers with COPD. Finally, we found that, in smokers with COPD, increases in WA% in successive GOLD stages was due to greater reductions in Ao compared with the more modest decrease in wall thickness. Note that our data strongly imply that increased WA% with disease is not due to isolated wall thickening with encroachment on the lumen.
Prior investigation suggests that central airway morphology is a measure of the remodeling process due to chronic tobacco smoke exposure. It is therefore interesting to find similar associations in a cohort of life-long nonsmokers with no history of lung disease. In these normals, those with the lower FEV1% had lower WA, Ai, and Ao, with an increased airway WA%. This finding is consistent with data reported from the Multi-Ethnic Study of Atherosclerosis (MESA) Lung Study, in which airway lumen diameter was related to FEV1 in never-smokers and smokers (5). In addition, it is surprising that the strength of these associations varied by lung lobe and airway generation in a manner reported for smoking-related disease. In particular, consistent with data from Hasegawa et al. in 50 male smokers (7), we found that the strongest correlates with lung function tended to occur in the right lower lobe and in the more distal airway generations. These findings may be due to occult noxious exposure in these subjects not detected at study screening or may suggest that the central airway morphology observed in smokers is dominated by native airway structure. Subjects with more severe COPD may have started with smaller airways that were more vulnerable to obstruction following chronic exposure to tobacco smoke (6).
In smokers, we found that those with the most severe expiratory airflow obstruction tended to have the smallest WA, Ai, and Ao and the greatest WA% for each of the airway segments examined. In addition to a possible influence of native airway structure, airway remodeling induced by tobacco smoke, especially in early stages of the disease, may be characterized by progressive reductions in total bronchial area (which would serve to increase the WA%, especially if the wall area itself does not change appreciably, and somewhat paradoxically in later stages of the disease where decreases in wall area are more than offset by decreased total bronchial area). In this case, it would be the ultimate balance of these processes that favors increases in WA% in subjects with progressive spirometric obstruction, i.e., although the airway wall area may be declining, there is still a proportionately greater reduction in the total bronchial area.
Our results are compatible with prior CT and histopathological investigation. Similar to our observed trend in WA between never-smokers and the earlier stages of disease (normal smokers and GOLD 1), Tiddens et al. (14) found that, in smokers undergoing lung resection for possible malignancy, the central airways of smokers with earlier stages of disease (mean FEV1 94% predicted, mean FEV1/FVC 69% predicted) tended to have increased wall area. Nakano and colleagues (11) reported that thickening of the central airway walls on CT scan predicted greater spirometric obstruction and greater burdens of small airway disease on histopathological examination. More recently, using optical coherence tomography (OCT) with a resolving capability of micrometers (rather than millimeters, as found in CT scan) Coxson et al. (2) found that increases in the WA% of the fifth generation airways were inversely related to lung function. Our results also demonstrate that those subjects with the greatest WA% also tended to have the greatest spirometric impairment. We suggest that these observations may be due to contributions of native airway structure and a more complex remodeling process than previously appreciated.
With respect to the remodeling process, it is unknown what drives the quantitative relationship between changes in, e.g., airway wall and total or lumenal bronchial area. Since these variables are correlated both in normals and in smokers over GOLD stages, and are intimately associated with the connection between structure and function, it invites an allometric examination based on power law scaling arguments. Are there similarities to what has been observed in prior analogous investigations of mammalian vessels, both airway and vascular? The relative insensitivity of WA% in the face of similar degrees of decrease in WA and Ao with disease progression suggests a common origin to both the radial changes in the airway (WA) as well as the circumferential changes (Ao and Ai). Scaling relationships may shed light on these questions, but which for now must remain open.
Despite this being one of the largest CT-based investigations of central airway morphology in smokers, this analysis is limited by the cross-sectional nature of the data. Here, we have inferred that airway morphology observed across GOLD stages represents disease progression. Substantiation of these findings will require longitudinal studies. A second limitation that must be mentioned is the nature of the CT images. Although these data were reconstructed with near isotropic voxels, our measures of airway morphology (such as WA and Ai) approach the limits of spatial resolution and are therefore likely to be overestimates of their true values. This effect would tend to be greatest in the smallest airways. Finally, it must be noted that our results represent a cohort with complete airway measures. Recent work by our group and by McDonough et al. suggests that subjects with more severe COPD tend to have fewer distal and proximal airways (4, 9). The characterization of airway dropout in this cohort is beyond the scope of this investigation. Further work is needed to examine the clinical associations of this process and any relation to central airway morphology in smokers.
In summary, using a large sample of data from the COPDGene Study, we examined CT measures of central airway remodeling. In the smokers, we observed that those with greater spirometric impairment had reduced WA, Ai, and Ao, with increases in WA%. Furthermore, we report similar trends in airway morphology in normals; the WA, Ai, and Ao were reduced and the WA% was increased in proportion to decrements in FEV1%. Because this is a cross-sectional study, we cannot ascertain whether airway morphology in smokers is a product of similar reductions in WA and Ai due to chronic tobacco smoke exposure or whether the smokers with more severe COPD simply had smaller native airways. The presence of either or both could explain the relative insensitivity of WA% for the clinical manifestations of COPD and would certainly support the search for additional CT-based metrics of airway remodeling.
GRANTS
The COPDGene Study is funded by National Heart, Lung, and Blood Insitute Grants U01 HL-089897 and U01 HL-089856. G. R. Washko is supported by K23 HL-089353. M. K. Han is supported by K23 HL-093351 A. A. Diaz is supported by K01 HL-118714-01.
DISCLOSURES
No conflicts of interest, financial or otherwise, are declared by the author(s).
AUTHOR CONTRIBUTIONS
Author contributions: G.R.W., D.A.L., J.P.B., and M.K.H. conception and design of research; G.R.W., J.S., and D.A.L. performed experiments; G.R.W., A.D., J.S., J.P.B., and M.K.H. analyzed data; G.R.W., A.D., V.K., R.G.B., M.T.D., J.S., J.J.R., J.W.R., E.V.B., D.A.L., J.P.B., and M.K.H. interpreted results of experiments; G.R.W. prepared figures; G.R.W., J.P.B., and M.K.H. drafted manuscript; G.R.W., A.D., V.K., R.G.B., M.T.D., J.S., J.J.R., J.W.R., A.M., E.V.B., D.A.L., J.P.B., and M.K.H. edited and revised manuscript; G.R.W., A.D., V.K., R.G.B., M.T.D., J.S., J.J.R., J.W.R., A.M., E.V.B., D.A.L., J.P.B., and M.K.H. approved final version of manuscript.
REFERENCES
- 1.American Thoracic Society Standardization of spirometry, 1994 update. Am J Respir Crit Care Med 152: 1107–1136, 1995 [DOI] [PubMed] [Google Scholar]
- 2.Coxson HO, Quiney B, Sin DD, Xing L, McWilliams AM, Mayo JR, Lam S. Airway wall thickness assessed using computed tomography and optical coherence tomography. Am J Respir Crit Care Med 177: 1201–1206, 2008 [DOI] [PMC free article] [PubMed] [Google Scholar]
- 3.Crapo RO, Morris AH, Gardner RM. Reference spirometric values using techniques and equipment that meet ATS recommendations. Am Rev Respir Dis 123: 659–664, 1981 [DOI] [PubMed] [Google Scholar]
- 4.Diaz AA, Valim C, Yamashiro T, Estepar RS, Ross JC, Matsuoka S, Bartholmai B, Hatabu H, Silverman EK, Washko GR. Airway count and emphysema assessed by chest CT imaging predicts clinical outcome in smokers. Chest 138: 880–887 [DOI] [PMC free article] [PubMed] [Google Scholar]
- 5.Donohue KM, Hoffman EA, Baumhauer H, Guo J, Budoff M, Austin JH, Kalhan R, Kawut S, Tracy R, Graham Barr R. Cigarette smoking and airway wall thickness on CT scan in a multi-ethnic cohort: The MESA Lung Study. Respir Med 2012;106:1655–1664 [DOI] [PMC free article] [PubMed] [Google Scholar]
- 6.Green M, Mead J, Turner JM. Variability of maximum expiratory flow-volume curves. J Appl Physiol 37: 67–74, 1974 [DOI] [PubMed] [Google Scholar]
- 7.Hasegawa M, Nasuhara Y, Onodera Y, Makita H, Nagai K, Fuke S, Ito Y, Betsuyaku T, Nishimura M. Airflow limitation and airway dimensions in chronic obstructive pulmonary disease. Am J Respir Crit Care Med 173: 1309–1315, 2006 [DOI] [PubMed] [Google Scholar]
- 8.Li K, Wu X, Chen DZ, Sonka M. Optimal surface segmentation in volumetric images–a graph-theoretic approach. IEEE Trans Pattern Anal Mach Intel 28: 119–134, 2006 [DOI] [PMC free article] [PubMed] [Google Scholar]
- 9.McDonough JE, Yuan R, Suzuki M, Seyednejad N, Elliott WM, Sanchez PG, Wright AC, Gefter WB, Litzky L, Coxson HO, Pare PD, Sin DD, Pierce RA, Woods JC, McWilliams AM, Mayo JR, Lam SC, Cooper JD, Hogg JC. Small-airway obstruction and emphysema in chronic obstructive pulmonary disease. N Engl J Med 365: 1567–1575 [DOI] [PMC free article] [PubMed] [Google Scholar]
- 10.Nakano Y, Muro S, Sakai H, Hirai T, Chin K, Tsukino M, Nishimura K, Itoh H, Pare PD, Hogg JC, Mishima M. Computed tomographic measurements of airway dimensions and emphysema in smokers. Correlation with lung function. Am J Respir Crit Care Med 162: 1102–1108, 2000 [DOI] [PubMed] [Google Scholar]
- 11.Nakano Y, Wong JC, de Jong PA, Buzatu L, Nagao T, Coxson HO, Elliott WM, Hogg JC, Pare PD. The prediction of small airway dimensions using computed tomography. Am J Respir Crit Care Med 171: 142–146, 2005 [DOI] [PubMed] [Google Scholar]
- 12.Rabe KF, Hurd S, Anzueto A, Barnes PJ, Buist SA, Calverley P, Fukuchi Y, Jenkins C, Rodriguez-Roisin R, van Weel C, Zielinski J. Global strategy for the diagnosis, management, and prevention of chronic obstructive pulmonary disease: GOLD Executive Summary. Am J Respir Crit Care Med 176: 532–555, 2007 [DOI] [PubMed] [Google Scholar]
- 13.Regan EA, Hokanson JE, Murphy JR, Make B, Lynch DA, Beaty TH, Curran-Everett D, Silverman EK, Crapo JD. Genetic epidemiology of COPD (COPDGene) study design. COPD 7: 32–43 [DOI] [PMC free article] [PubMed] [Google Scholar]
- 14.Tiddens HA, Koopman LP, Lambert RK, Elliott WM, Hop WC, van der Mark TW, de Boer WJ, de Jongste JC. Cartilaginous airway wall dimensions and airway resistance in cystic fibrosis lungs. Eur Respir J 15: 735–742, 2000 [DOI] [PubMed] [Google Scholar]
- 15.Tiddens HA, Pare PD, Hogg JC, Hop WC, Lambert R, de Jongste JC. Cartilaginous airway dimensions and airflow obstruction in human lungs. Am J Respir Crit Care Med 152: 260–266, 1995 [DOI] [PubMed] [Google Scholar]
- 16.Tschirren J, Hoffman EA, McLennan G, Sonka M. Intrathoracic airway trees: segmentation and airway morphology analysis from low-dose CT scans. IEEE Trans Med Imaging 24: 1529–1539, 2005 [DOI] [PMC free article] [PubMed] [Google Scholar]
- 17.Wan ES, Hokanson JE, Murphy JR, Regan EA, Make BJ, Lynch DA, Crapo JD, Silverman EKInvestigators CO Clinical and radiographic predictors of GOLD-unclassified smokers in the COPDGene study. Am J Respir Crit Care Med 184: 57–63, 2011 [DOI] [PMC free article] [PubMed] [Google Scholar]
- 18.West GB, Brown JH, Enquist BJ. A general model for the origin of allometric scaling laws in biology. Science 276: 122–126, 1997 [DOI] [PubMed] [Google Scholar]
- 19.Zach JA, Newell JD, Jr, Schroeder J, Murphy JR, Curran-Everett D, Hoffman EA, Westgate PM, Han MK, Silverman EK, Crapo JD, Lynch DA. COPDGene Investigators Quantitative computed tomography of the lungs and airways in healthy nonsmoking adults. Invest Radiol 47: 596–602, 2012 [DOI] [PMC free article] [PubMed] [Google Scholar]