Abstract
Quantitative real-time PCR is PCR visualized in real time by the use of fluorescent or intercalating dyes used to measure gene expression or gene quantification including including contiguous gene deletions or duplications. A simple method is described to quantify DNA copy number from human samples.
Keywords: qPCR, CNV, copy number analysis
Introduction
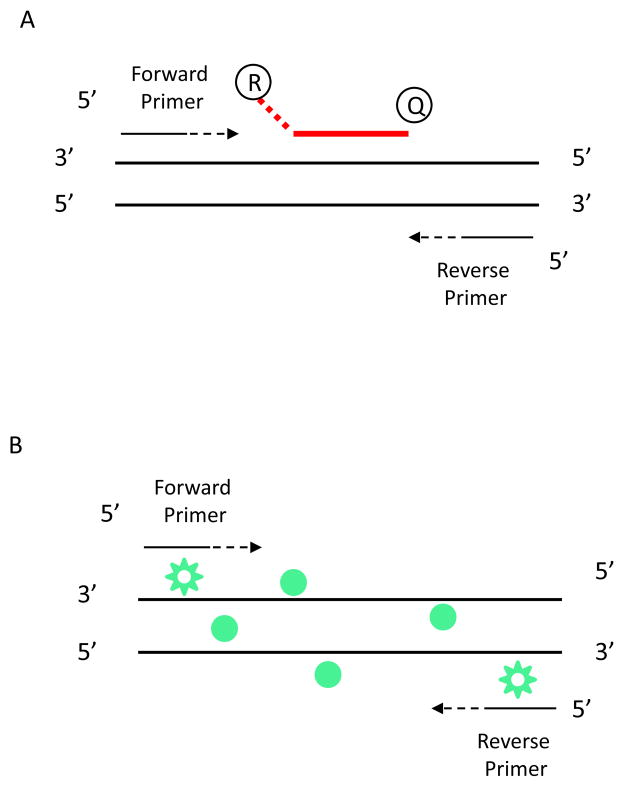
Quantitative PCR (qPCR) has been utilized for the analysis of gene expression (Heid et al., 1996; Higuchi et al., 1991) and quantification of copy number variation by real-time PCR. qPCR involves amplification of a test locus with unknown copy number and a reference locus with known copy number. This method has been used in the determination of SMN1 and SMN2 copy number for spinal muscular atrophy (SMA) (Anhuf et al., 2003; Feldkötter et al., 2002), quantification of CFTR transcripts in cystic fibrosis (CF) (Ramalho et al., 2011), the determination of HER-2/neu amplification in human breast carcinoma (Kulka et al., 2006), and other human diseases (Aarskog and Vedeler, 2000; Laccone et al., 2004; Linzmeier and Ganz, 2005; Logan et al., 2010; Longo et al., 2013; Schaeffeler et al., 2003; Terribas et al., 2013; Thiel et al., 2003; Wilke et al., 2000). There are two approaches to the assay: fluorescent dyes and intercalating dyes. In either approach, fluorescence doubles with every cycle of PCR, and the amount of starting template can be determined from the number of cycles required to achieve a specified threshold level of fluorescence (See Figure 1). The actual qPCR experiment takes half a day after sample preparation. Commonly used methods for qPCR data analysis are absolute quantification by relating the PCR signal to a standard curve and relative quantification that relates the PCR signal of the target transcript in one group to another (Schmittgen et al., 2000; Schmittgen and Zakrajsek, 2000; Schmittgen and Livak, 2008; Livak and Schmittgen, 2001). For CNV analysis, relative quantification is utilized. Advantages and limitations of qPCR assay in CNV analysis are listed in Table 1.
Figure 1.
TaqMan probe versus SYBR Green for qPCR assay. (A). An oligonucleotide probe contains a reporter fluorescent dye on the 5′ end and a quencher dye on the 3′ end. Primers are designed for PCR amplification. The probe anneals with target sequence from one of the primer sites and is cleaved by the 5′ nuclease activity of Taq DNA polymerase as this primer is extended. Cleavage of the probe separates the reporter dye from the quencher dye, increasing the reporter dye signal. Cleavage of the probe removes the probe from the target strand, allowing primer extension to continue to the end of the template strand. There is an increase in fluorescence intensity proportional to the amount of amplicon produced during each PCR cycle. (B). SYBR Green dye detects PCR products by binding to double-stranded DNA formed during PCR reaction. As the PCR progresses, more PCR product is created. SYBR® dye binds to all double-stranded DNA, resulting in an increase in fluorescence intensity proportioned to the amount of PCR product produced.
Table 1.
Advantages and Limitations of qPCR Assay for CNV Analysis
| Advantages | Limitations |
|---|---|
| qPCR is amenable for analysis of a large number of samples. | Assay can be affected by DNA quality. |
| The assay is a simple modification of PCR that allows PCR-based tests for the detection of genomic deletions and duplications. | To use the relative analysis method, the normal control should have 2 copies of the gene or region of interest. |
| Post-PCR processing is eliminated, reducing assay labor and material costs. | Results may fall between integers (e.g., copy number measuring 1.3) making interpretation more difficult. |
| Once the assay is established for specific gene, it can be performed in little time. | Triplicates are required for each run and replication may be necessary increasing the DNA requirements of the assay. |
| qPCR requires a qPCR instrument, and oligonucleotides, probes and triplicates runs. The cost to establish the assay is $ 426 with a marginal cost $11 for each additional sample tested. | |
| When the size of CNV is small (e.g., less than 100bp), or in a repetitive region or contains a DNA sequence that is not unique within the genome, it may be challenging to design qPCR primers for the assay. | |
| Results can be affected by mosaics. |
Basic Protocol 1: qPCR for CNV analysis
This is a basic protocol for quantification of copy number from genomic DNA. To measure DNA copy number, the amplicon should be located either within an exon or intron with sequences unique to that gene. A control gene with two copies should also be included. A master mix containing all of the components is prepared and distributed in 96 or 384-well plate. Template and/or primers are added for each reaction. The assay is performed on a qPCR instrument and data are collected in real time. The following is a protocol for the assay.
Materials
Samples of interest (e.g., genomic DNA isolated from normal control and unknown)
DNA isolation kit for the preparation of genomic DNA from blood (e.g., Puregene reagents Gentra Systems Inc., Minneapolis, Minnesota, United States of America)
2XSYBR mix containing enzyme, buffer, dNTPs (e.g., Roche Molecular Biochemicals)
Primers for the amplification of gene of interest
Hybridization probe that detects gene of interest consisting of a primer pair with a 3′-fluorescein and a 5′-lightcycler red 640
Robotic liquid handling equipment (e.g., Thermo Scientific)
qPCR-compatible 96-well plates (e.g., LightCycler® 480 Multiwell plate 96)
Optical plate seals (e.g., LightCycler® 480 Multiwell Sealing Foil)
Nanodrop ND-1000 (e.g., Nanodrop Technologies)
Centrifuge with rotor adapted for microtiter plates
LightCycler instrument (e.g., LightCycler 480, Roche Diagnostics)
Isolate DNA and dissolve in a final volume of 100–500 μl TE buffer (10mM Tris/0.1mM EDTA pH 8).
Quantify DNA concentration by spectrophotometry (APPENDIX 3D). Dilute DNA to the concentration for qPCR reaction (e.g., 20 ng/μl).
Dilute PCR primers to a final concentration of 0.2 – 1 μM.
-
Total reaction volume for each sample is 10 μl and contains 7.5 ng of genomic DNA, 10 pmol of each primer, 1 μl of SYBR Green I master mix (Roche Molecular Biochemicals), and 2 pmol of each hybridization probe.
Total volume for PCR reaction should be 10–50 μl; genomic DNA concentration should be 6ng–50ng (Anhuf et al., 2003;Feldkötter et al., 2002). Hybridization probe is optimal (Figure 1). When probe is omitted, the standards (a duplicate series of fivefold dilutions of a DNA sample known to have two copies of the test locus and reference locus in abundance) are included (Ramalh et al., 2011). -
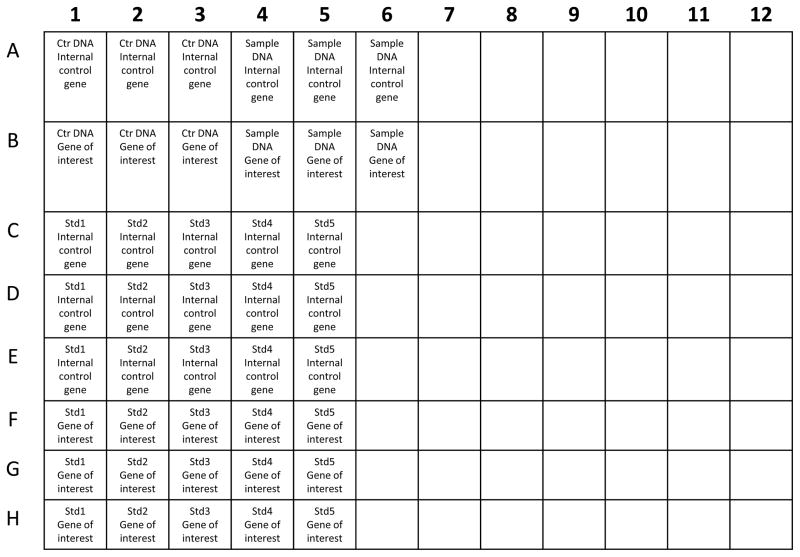
Prepare the plate. Triplicates of standard curve for internal control gene and gene of interest, control DNA sample for the amplification of internal control gene and gene of interest, and experimental samples for internal control gene and gene of interest should be amplified individually in each well on one plate (Figure 2).
Plate layout can be modified for specific assay. Seal the plate tightly.
Briefly centrifuge the plates at 500×g, at room temperature to ensure that all liquid is at the bottom of wells, and to remove bubbles which might interfere with fluorescence.
-
Perform PCR using the default protocol recommended by the manufacturer (e.g., 95°C for 10 min followed by 35 cycles with 95°C for 15 s, 58°C for 5 s, 72°C for 25 s, and a fluorescent detection step at 76°C for 1 s.) or custom protocol (e.g., 95°C for 2 min followed by 40 cycles with 95°C for 3 s, 60°C for 30 s).
Protocol can be modified for specific amplicons requiring specific hybridization conditions. Note the cycle number at which each well crosses an arbitrary threshold of fluorescence (the “Ct” value).
-
Subtract a predetermined internal control gene Ct value from each test gene Ct value (Ct = Ct − Ctic), calculate by the 2−ΔΔCT method (Schmittgen and Livak, 2008; Livak and Schmittgen, 2001).
Data can also be analyzed by the standard curve method for absolute quantification or standard curve method for relative quantification.
Figure 2.
Example of 96-Well plate layout for qRT-PCR reaction. Ctr: control samples, Std: standard samples.
Commentary
Background Information
Quantitative PCR (qPCR) is a simple modification of PCR to quantify the amount of target DNA by introducing fluorescent or intercalating dyes to detect PCR product as it accumulates in real time during PCR cycles. qPCR can be used for absolute or relative quantification of any DNA, including chromosomal DNA, mitochondrial DNA, or cDNA generated by reverse transcription of RNA. The approach has been used in some clinical situations for diagnostic detection of infectious agents or characterization of genetic abnormalities. A single, robust qPCR assay should allow for copy number analysis but the primers and assay may require optimization before the results are robust and reproducible.
Critical Parameters and Trouble Shooting
Primer design
When designing qPCR primers, the following should be considered:
Choose a region that has a GC content of 50–60%.
Avoid regions with long (>4) repeats of single bases.
Avoid single nucleotide polymorphisms and copy number polymorphisms at the annealing sites.
Primer pairs with 75–200 bp amplification product is ideal since short PCR products are typically amplified with higher efficiency than longer ones.
The primers must be unique and should not contain repeat sequences that might be found frequently in other sequenes. Sequence specificity should be confirmed using tools such as the Basic Local Alignment Search Tool (BLAST).
Primers should be 18–24 bp with a GC content of ~ 50%.
Web based resources (e.g. www.genescript.com) for designing qPCR primers can be utilized.
Probe design
Primers can be combined with DNA-binding dyes in amplification reactions to monitor the appearance of double-stranded DNA (dsDNA). For greater specificity, fluorescently labeled probes can be used. When probes are designed, the following should be considered:
The melting temperature (Tm) of a hydrolysis probe should be 5–10°C higher than that of the primers.
In most cases, the probe should be <30 nucleotides.
There should be no G at the 5′ end because this could quench the fluorescence signal even after hydrolysis.
Sequence within the target should have a GC content of 30–80%, and the probe should anneal to the strand that has more Gs than Cs (so the probe contains more Cs than Gs).
There are web-based resources for designing qPCR probes.
Determining Reaction Efficiency
Reaction efficiency can be determined by constructing a standard curve. The log of each known concentration in the dilution series is plotted against the CT value for that concentration to produce standard curves for internal control gene and gene of interest. A slope of −3.32 corresponds to 100% PCR efficiency. The standard curve helps to determine the efficiency, linear dynamic range, and reproducibility of the assay.
Assay Specificity Verification
Assay specificity can be verified by melting curve analysis. When using LightCycler 480 qPCR instrument, this can be calculated by the software package installed in the machine). Presence of nonspecific products and primer-dimers can significantly reduce the amplification efficiency and the accuracy. Primer-dimers usually melt at lower temperatures than the desired product, whereas nonspecific amplification can result in PCR products that melt at temperatures above or below that of the desired product.
Trouble shooting
Anticipated Results
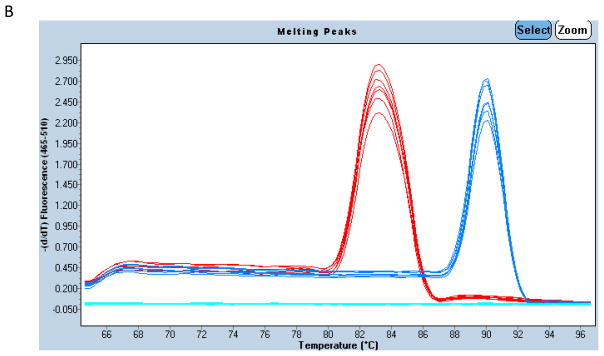
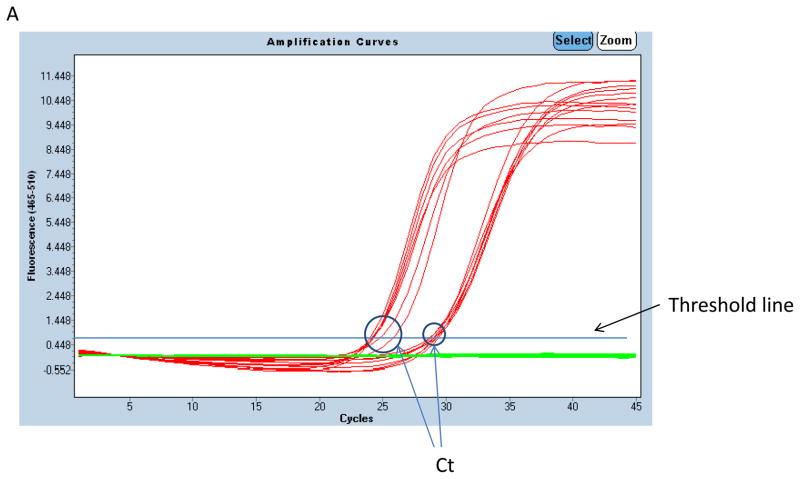
Detection of copy number by real-time PCR involves amplification of a test locus with unknown copy number and a reference locus with known copy number. Amplification and melting curves can be visualized on qPCR instrument (Figure 3, LightCycler 480, Roche). The absolute copy number of the test locus per haploid genome equivalent is given by the ratio of the relative gene copy numbers of the gene and reference loci (e.g. the absolute copy number for samples determined in Figure 3 are 1 copy). The results should vary from one copy to multiple copies.
Figure 3.

Example of qPCR amplification and melting curves. Amplification curves for BCL7B (left-hand cluster) and CFTR (right-hand cluster) from 7 DNA samples on one 96-well plate is shown in panel A. Fluorescence is plotted on a log scale against cycle number. Each amplification curve crosses the horizontal cycle threshold line at a certain cycle threshold number (CT) which is then used for quantification. Absolute copy number (B) Melting peaks for BCL7B (left) and CFTR (right) PCR products produced in (A). The single peak for each product in all samples indicates lack of contamination and primer–dimers.
Time Considerations
Setting up a laboratory for performing qPCR and robotic liquid handling can be moderately expensive, given the equipment needs. Assay design requires knowledge of genetic sequence of interest. If the equipment is available, once the assay is established, large number of samples can be evaluated quickly and inexpensively. Most assays can be completed in 2–3 days, with DNA isolation and DNA quantification (steps 1 to 2) completed in 1–2 days. The preparation of qPCR plates (steps 3 to 6) can be done in 2hrs. Running the qPCR plates on a real-time reader (step 7) typically takes 1.5–2 hrs. Data analysis (steps 8 to 9) requires 1 to 2 hrs.
Table 2.
Troubleshooting
| Problems | Possible Causes | Solution |
|---|---|---|
| No signal in some wells. | PCR failed; gene not expressed; evaporation; stochastic effects of low-copy transcripts (a normal finding). | After qPCR run, determine visually if evaporation occurred (if so, tighten seals); Run product on the gel to determine whether there is PCR produce. If PCR failed, test primers on a known template, optimize PCR conditions or design new primers. |
| Fluorescence intensity is too low. | Deterioration of dye in reaction mixtures; poor PCR efficiency. | Store the Master Mix properly and keep it away from light. Avoid repeated freezing and thawing. Check primer concentration, optimize PCR conditions or design new primers. |
| Melting temperature of a product varies from experiment to experiment. | Variations in reaction mixture. | Check purity of template solution; Reduce variations in parameters such as primer preparation and program settings. |
| Negative control samples give a positive signal. | Contamination or presence of primer-dimers. | Remake all critical solutions; Clean environment. |
Acknowledgments
Funding for the study was provided by U01 HL098163 from NHLBI.
Contributor Information
Lijiang Ma, Email: lm2939@columbia.edu.
Wendy K. Chung, Email: wkc15@columbia.edu.
Literature Cited
- Aarskog NK, Vedeler CA. Real-time quantitative polymerase chain reaction. A new method that detects both the peripheral myelin protein 22 duplication in Charcot-Marie-Tooth type 1A disease and the peripheral myelin protein 22 deletion in hereditary neuropathy with liability to pressure palsies. Hum Genet. 2000;107(5):494–8. doi: 10.1007/s004390000399. [DOI] [PubMed] [Google Scholar]
- Anhuf D, Eggermann T, Rudnik-Schöneborn S, Zerres K. Determination of SMN1 and SMN2 copy number using TaqMan technology. Hum Mutat. 2003;22(1):74–8. doi: 10.1002/humu.10221. [DOI] [PubMed] [Google Scholar]
- Feldkötter M, Schwarzer V, Wirth R, Wienker TF, Wirth B. Quantitative analyses of SMN1 and SMN2 based on real-time lightCycler PCR: fast and highly reliable carrier testing and prediction of severity of spinal muscular atrophy. Am J Hum Genet. 2002;70(2):358–68. doi: 10.1086/338627. [DOI] [PMC free article] [PubMed] [Google Scholar]
- Heid CA, Stevens J, Livak KJ, Williams PM. Real time quantitative PCR. Genome Res. 1996;6:986–994. doi: 10.1101/gr.6.10.986. [DOI] [PubMed] [Google Scholar]
- Higuchi R, Fockler C, Dollinger G, Watson G. Kinetic PCR: real-rime monitoring of DNA amplification reactions. Biotechnology. 1991;11:1026–1030. doi: 10.1038/nbt0993-1026. [DOI] [PubMed] [Google Scholar]
- Kulka J, Tôkés AM, Kaposi-Novák P, Udvarhelyi N, Keller A, Schaff Z. Detection of HER-2/neu gene amplification in breast carcinomas using quantitative real-time PCR - a comparison with immunohistochemical and FISH results. Pathol Oncol Res. 2006;12(4):197–204. doi: 10.1007/BF02893412. [DOI] [PubMed] [Google Scholar]
- Laccone F, Junemann I, Whatley S, Morgan R, Butler R, Huppke P, Ravine D. Large deletions of the MECP2 gene detected by gene dosage analysis in patients with Rett syndrome. Hum Mutat. 2004;23(3):234–44. doi: 10.1002/humu.20004. [DOI] [PubMed] [Google Scholar]
- Linzmeier RM, Ganz T. Human defensin gene copy number polymorphisms: comprehensive analysis of independent variation in alpha- and beta-defensin regions at 8p22-p23. Genomics. 2005;86(4):423–30. doi: 10.1016/j.ygeno.2005.06.003. [DOI] [PubMed] [Google Scholar]
- Livak KJ, Schmittgen TD. Analysis of relative gene expression data using real-time quantitative PCR and the 2(−Delta Delta C(T)) Method. Methods. 2001;25(4):402–8. doi: 10.1006/meth.2001.1262. [DOI] [PubMed] [Google Scholar]
- Longo AV, Rodriguez D, da Silva Leite D, Toledo LF, Mendoza Almeralla C, Burrowes PA, Zamudio KR. ITS1 copy number varies among Batrachochytrium dendrobatidis strains: implications for qPCR estimates of infection intensity from field-collected amphibian skin swabs. PLoS One. 2013;8(3):e59499. doi: 10.1371/journal.pone.0059499. [DOI] [PMC free article] [PubMed] [Google Scholar]
- Logan C, Habington A, Lennon G, Cronin F, O’Sullivan N. Evaluation of the efficacy of real-time polymerase chain reaction for the routine early detection of Pseudomonas aeruginosa in cystic fibrosis sputum and throat swab specimens. Diagn Microbiol Infect Dis. 2010;68(4):358–65. doi: 10.1016/j.diagmicrobio.2010.07.012. [DOI] [PubMed] [Google Scholar]
- Ramalho AS, Clarke LA, Amaral MD. Quantification of CFTR transcripts. Methods Mol Biol. 2011;741:115–35. doi: 10.1007/978-1-61779-117-8_9. [DOI] [PubMed] [Google Scholar]
- Schaeffeler E, Schwab M, Eichelbaum M, Zanger UM. CYP2D6 genotyping strategy based on gene copy number determination by TaqMan real-time PCR. Hum Mutat. 2003;22(6):476–85. doi: 10.1002/humu.10280. [DOI] [PubMed] [Google Scholar]
- Schmittgen TD, Zakrajsek BA, Mills AG, Gorn V, Singer MJ, Reed MW. Quantitative reverse transcription-polymerase chain reaction to study mRNA decay: comparison of endpoint and real-time methods. Anal Biochem. 2000;15;285(2):194–204. doi: 10.1006/abio.2000.4753. [DOI] [PubMed] [Google Scholar]
- Schmittgen TD, Zakrajsek BA. Effect of experimental treatment on housekeeping gene expression: validation by real-time, quantitative RT-PCR. J Biochem Biophys Methods. 2000;20;46(1–2):69–81. doi: 10.1016/s0165-022x(00)00129-9. [DOI] [PubMed] [Google Scholar]
- Schmittgen TD, Livak KJ. Analyzing real-time PCR data by the comparative C(T) method. Nat Protoc. 2008;3(6):1101–8. doi: 10.1038/nprot.2008.73. [DOI] [PubMed] [Google Scholar]
- Terribas E, Garcia-Linares C, Lázaro C, Serra E. Probe-Based Quantitative PCR Assay for Detecting Constitutional and Somatic Deletions in the NF1 Gene: Application to Genetic Testing and Tumor Analysis. Clin Chem. 2013;59(6):928–37. doi: 10.1373/clinchem.2012.194217. [DOI] [PubMed] [Google Scholar]
- Thiel CT, Kraus C, Rauch A, Ekici AB, Rautenstrauss B, Reis A. A new quantitative PCR multiplex assay for rapid analysis of chromosome 17p11.2-12 duplications and deletions leading to HMSN/HNPP. Eur J Hum Genet. 2003;11(2):170–8. doi: 10.1038/sj.ejhg.5200920. [DOI] [PubMed] [Google Scholar]
- Wilke K, Duman B, Horst J. Diagnosis of haploidy and triploidy based on measurement of gene copy number by real-time PCR. Hum Mutat. 2000;16(5):431–6. doi: 10.1002/1098-1004(200011)16:5<431::AID-HUMU8>3.0.CO;2-Z. [DOI] [PubMed] [Google Scholar]


