Abstract
The principle of quantifying the efficiency of protection of photosystem II (PSII) reaction centres against photoinhibition by non-photochemical energy dissipation (NPQ) has been recently introduced by Ruban & Murchie (2012 Biochim. Biophys. Acta 1817, 977–982 (doi:10.1016/j.bbabio.2012.03.026)). This is based upon the assessment of two key parameters: (i) the relationship between the PSII yield and NPQ, and (ii) the fraction of intact PSII reaction centres in the dark after illumination. In this paper, we have quantified the relationship between the amplitude of NPQ and the light intensity at which all PSII reaction centres remain intact for plants with different levels of PsbS protein, known to play a key role in the process. It was found that the same, nearly linear, relationship exists between the levels of the protective NPQ component (pNPQ) and the tolerated light intensity in all types of studied plants. This approach allowed for the quantification of the maximum tolerated light intensity, the light intensity at which all plant leaves become photoinhibited, the fraction of (most likely) unnecessary or ‘wasteful’ NPQ, and the fraction of photoinhibited PSII reaction centres under conditions of prolonged illumination by full sunlight. It was concluded that the governing factors in the photoprotection of PSII are the level and rate of protective pNPQ formation, which are often in discord with the amplitude of the conventional measure of photoprotection, the quickly reversible NPQ component, qE. Hence, we recommend pNPQ as a more informative and less ambiguous parameter than qE, as it reflects the effectiveness and limitations of the major photoprotective process of the photosynthetic membrane.
Keywords: protective non-photochemical energy dissipation, thylakoid membrane, photosystem II, LHCII, xanthophylls, PsbS protein
1. Introduction
Photosynthetic organisms emerged and evolved in aquatic environments, which normally provide insufficient light input into the photosynthetic membrane to satisfy the energy needs of even microscopic biological organisms [1,2]. Therefore, the photosynthetic machinery of bacteria and algae eventually evolved light harvesting systems, or antennae, built of many interconnected pigments capable of efficiently absorbing and delivering photon energy to the photosynthetic reaction centre pigments, where primary charge separation takes place [1,2]. Hence, photosynthetic antennae function to increase power input into the energy transforming machinery. In the course of natural history, photosynthetic organisms gradually occupied the land of our planet. On land, plants encountered a new challenge arising from rapid and large fluctuations in light intensity.
The fundamental problem with exposure to elevated light intensities arises from differences in the rates of energy capture by the photosystem reaction centres, energy absorption and transfer, and subsequent electron transport. Being much slower than energy transfer, electron transport rates fulfil the fundamental thermodynamic requirement—to minimize the uphill reactions and therefore stabilize energy which is to be used in the chain of electron/proton transfer reactions leading to reduced nicotinamide adenine dinucleotide phosphate (NADPH) and ATP synthesis. Under increasing light intensity, the photosynthetic reaction centres are progressively saturated with energy (closed), leading to a reduction in the fraction of energy used in photosynthesis and the subsequent build-up of ‘unused’, potentially harmful, excitation energy in the photosynthetic membrane. This excess energy can cause damage to the photosynthetic reaction centres, particularly of photosystem II (PSII), leading to the sustained photoinhibition of its efficiency, undermining plant wellbeing and impacting their diversity in the natural environment and the productivity of crops [3–6].
To dissipate the harmful excess energy, the PSII antenna possesses a mechanism that promptly transforms this energy into heat, removing it from the photosynthetic membrane. This energy dissipation is commonly quantified by the non-photochemical quenching of chlorophyll fluorescence, NPQ [7], using a pulse-amplitude modulated fluorometer [8]. While the basic properties and localization of the NPQ process are now well identified, the mechanism remains a subject of debate [7]. Apart from this, another feature of NPQ has been surprisingly overlooked—quantification of its photoprotective effectiveness. Indeed, as with any type of adaptation, NPQ should have limits which need to be routinely estimated in order to give a measure of photoprotection in any given circumstances and, in particular, in different types of photosynthetic organisms [9,10].
NPQ was discovered to have several components defined by the kinetics of their formation in light and their recovery in the dark [6,10]. The fastest component is called qE which forms and recovers within a few minutes. Often, but not always, this component forms a major part of NPQ [6,7] and works to protect PSII against photodamage. However, there are several slowly reversible components of NPQ, one of which corresponds to the damaged, photoinhibitory state of PSII and is called qI [6,11,12]. The other slowly reversible components correlate with the presence of zeaxanthin (qZ) [13] and trapped protons within the photosynthetic membrane [14]. In addition, high light combined with water stress or low temperature causes the formation of a large component of NPQ which is sustained in the dark. This form of quenching is argued to be of a photoprotective nature [15]. Therefore, because of the existence of several slowly reversible photoprotective components of NPQ, the qE quenching itself, defined after 5–10 min period of darkness after illumination, does not often reflect the whole photoprotective potential of NPQ. Moreover, it provides no useful parameters related to the efficacy of this potential, such as the light intensity limit at which it is safe for a plant to grow. Therefore, it was necessary to develop an approach capable of testing the in vivo photoprotective function of all protective NPQ components, regardless of how quickly or slowly they form and recover.
Recently, Ruban & Murchie [16] developed a new principle of NPQ analysis that enables a better understanding of the significance of the NPQ process, particularly its photoprotective potential. In this approach, we use the value of photochemical quenching (qP) measured in the dark to monitor the state of active PSII reaction centres, enabling detection of the early signs of photoinhibition [16]. This approach allowed for the development of methodologies that are instrumental in determining the amplitude of photoprotective NPQ (pNPQ) and its potential to protect against photoinhibition. We argued that this approach appears to be more correct than the one that is based only upon measurement of the qE component. In this paper, we developed a methodology of pNPQ analysis that allowed us to accurately quantify the relationship between the protective component of NPQ and actinic light intensity for three types of plants that have different levels of PsbS protein. This in turn allowed for the estimation of the maximum light intensity tolerated by the PSII reaction centres, the photoprotective effectiveness of NPQ in plants with different levels of PsbS protein, and the fraction of captured energy that may be unnecessarily, or ‘wastefully’, dissipated (wNPQ).
2. Material and methods
(a). Principle
Both NPQ and photodamage to the PSII reaction centres diminish the quantum yield of PSII (ΦPSII) [5,12–15,17–21]. Therefore, we have derived a formula that relates the yield, NPQ and photoinhibition in the dark following a period of illumination [16]:
| 2.1 |
where qP is the photochemical quenching and Fv/Fm is the yield of PSII before illumination. When this relationship was tested on leaves that had been exposed to gradually increasing light, it perfectly matched the experimental data up to a certain high actinic light intensity, above which the experimentally determined yield started to decrease more steeply with NPQ than the theoretical value [16]. We also measured values of qP in the dark immediately after a period of illumination (here denoted qPd) using a previously described technique for Fo′ calculation [22]:
| 2.2 |
where  . and Foact. are the calculated and actual dark fluorescence levels, and Fm and F′m are maximum fluorescence levels in the dark and upon illumination (at the NPQ state), respectively. Hence, in the presence of photoinhibition, the value of qP in the dark (qPd) can be calculated using the actual dark fluorescence level (
 .) and the calculated Fo′ magnitude (
 ; see figure 1 for illustration):
| 2.3 |
Figure 1 demonstrates how  and Fo′ were identical following a range of lower actinic light intensities and how after the fifth cycle of illumination the actual Fo′ level was found to be higher than the calculated one. We found that in every case the measured values of ΦPSII deviated from the theoretical ones at the same light intensity at which qPd started to become lower than unity. Thus, the decrease in qP level in the dark following illumination signalled the onset of photoinhibition because it reflected the closure of a fraction of PSII reaction centres that were no longer able to quench Fo in the dark [23]. Therefore, qPd can be used in mass measurements as a convenient, quickly acquirable parameter that tracks photoinhibition, as will be described in the next paragraph (§2b).
Figure 1.
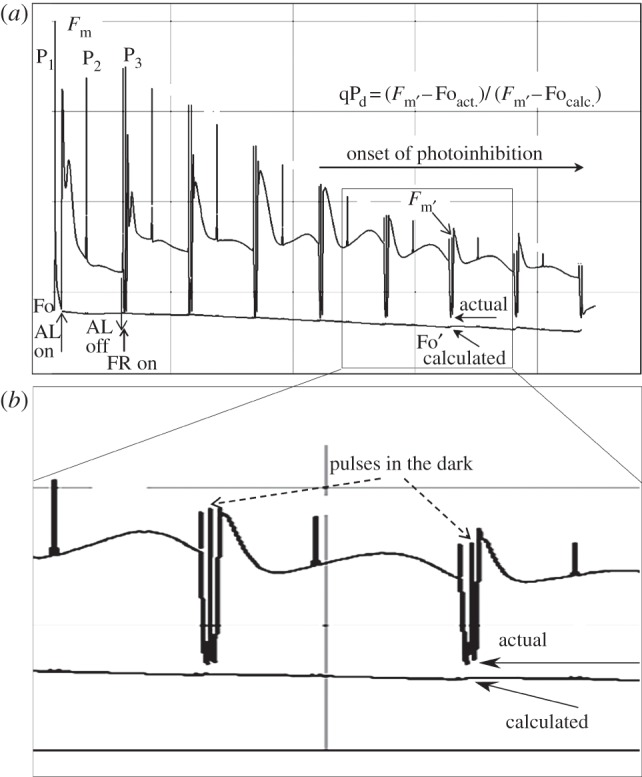
(a) Scheme of induction of chlorophyll fluorescence quenching in a wild-type Arabidopsis leaf as used in figure 2, with constant actinic light, or by eight stepwise increasing actinic light levels (figures 3–8): 90, 190, 285, 420, 620, 820, 1150 and 1500 μmol m−2 s−1. Vertical arrows on the left of the figure indicate application (AL on) and removal (AL off) of the actinic light treatment. P1, P2, P3 are saturating pulses applied before (P1) and during (P2, P3) the actinic light treatment. Short arrows on the right of the figure indicate levels of calculated ( ) and actual (
 ) fluorescence in the dark. (b) The zoomed region of the fluorescence trace indicates the two brief dark breaks between the illumination steps where saturating pulses have been applied to enable calculation of the qPd parameter (the equation is shown in the figure panel). The timing scheme for the dark breaks was: (AL off) (FR on)-(7 s)-(P)-(5 s)-(AL on)(FR off), where FR is far-red light; P is the saturating pulse.
(b). Fluorescence method and analysis
Measurements were conducted using a Walz Junior PAM fluorometer (Walz Effeltrich, Germany) and a monitoring leaf clip. The actinic light intensity ranged from 30 to 1500 μmol m–2 s−1. Each quenching run lasted approximately 42 min in total with eight gradually increasing light intensities per run. Figure 1a shows a typical quenching run of an attached Arabidopsis leaf. The routine has been encoded as a batch programme that sets the saturating pulse for 600 ms and turns on actinic light of the lowest intensity (in this case was 90 μmol m−2 s−1) after 40 s of Fo measurement in the presence of the low intensity far-red light. The illumination by actinic light lasts for 5 min with only two saturating pulses applied on the second and fifth minutes of illumination in order to calculate NPQ and the yield. After 5 min, the actinic light is switched off immediately after applying the second saturating pulse. After 7 s of far-red light illumination, the saturating pulse is applied in the dark for 5 s followed by the next cycle of actinic light illumination (figure 1b shows a zoomed region to display the position of saturating pulses in the dark). The illumination cycles for the run shown in figure 1 were repeated eight times with the standard intensities set at 90, 190, 285, 420, 620, 820, 1150 and 1500 μmol m−2 s−1. In order to achieve a broader coverage of the actinic light intensity range, various runs have been repeatedly performed on the same types of plants using a variety of light intensities from 30 to 1500 μmol m−2 s−1. This has been achieved by altering the distance between the fibre-optic light guide and the diode-emitting actinic light of the fluorometer. This method not only enabled the use of actinic light as low as 30 μmol m−2 s−1 but also a broader variety of light intensities.
In addition to the runs that used a step increase in actinic light intensity, we designed 42 min actinic light illumination runs of the fluorescence quenching induced at fixed actinic light intensity. Effectively, the same routine as described above was used with the only difference being that the actinic light intensity was kept constant throughout all eight cycles of illumination. This was used for monitoring the kinetic properties of photoinhibition, the onset and recovery of qPd, that were useful for the choice of the main illumination routine described in the previous paragraph.
(c). Plant material
Arabidopsis plants, wt, npq4 (lacking PsbS protein) and L17 (an overexpresser of PsbS protein) were grown in a growth room at 20°C, 8 h photoperiod and 90 μmol m−2 s−1 of light. All measurements have been performed on attached leaves. No detectable differences between all types of plants (wt, npq4 and L17) in the extent of de-epoxidation were observed in this study, in agreement with various earlier reports [24–26]. For some experiments, leaves were vacuum infiltrated with 20 mM HEPES buffer (pH 7.0) containing 100 μM lincomycin to inhibit PSII reaction centre D1 protein synthesis, whereas control leaves were vacuum infiltrated with only the buffer.
3. Results
(a). Photoinhibition monitored by qPd parameter
In order to investigate the kinetic properties of qPd that reflected the closure of reaction centres in the dark following illumination, we undertook fluorescence induction runs at fixed actinic light intensities for approximately 42 min with eight dark breaks each lasting 12 s needed to read Foact. and calculate Focalc. (see above and figure 1). Figure 2a shows the time course of a decrease in qPd in the wild-type Arabidopsis leaf illuminated with three different light intensities (420, 820 and 1500 μmol m−2 s−1). The value of qPd promptly decreased and reached saturation after 10 min of illumination when actinic light intensity was 1500 μmol m−2 s−1. The major drop took place within the first 5 min. On the other hand, no decrease in qPd was detectable at the actinic light intensity of 420 μmol m−2 s−1. This suggests that the full population of PSII was protected against light of this intensity. Figure 2b shows the dark recovery course of qPd after illumination with the highest light intensity that revealed very slow kinetics (hours) that are similar to those reported for the photoinhibition that involves not only a functional long-term closure of the reaction centre, but also physical recovery of degraded D1 protein of the PSII reaction centre complex [27–30]. Indeed, infiltration of leaves with lincomycin completely abolished dark recovery of qPd (see figure 2b, open symbols), which was interpreted as confirming the D1 repair involvement in the process of qPd restoration.
Figure 2.
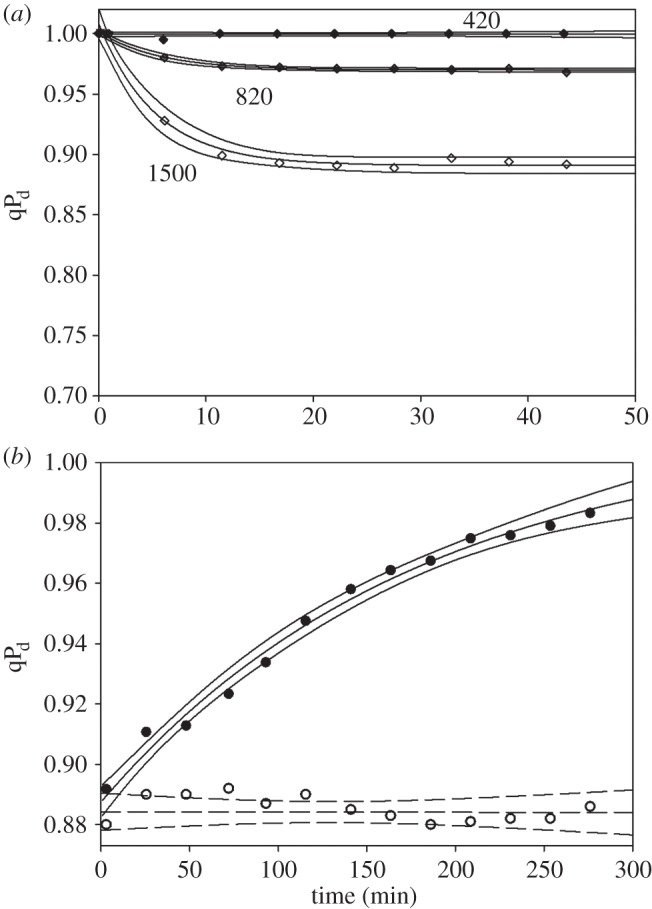
(a) The time course of qPd formation in a wild-type Arabidopsis leaf (data points plus fitting and 95% CIs) induced by constant actinic light of 420, 820 and 1500 μmol m−2 s−1. The time scheme of these measurements was identical to the measurements presented in figure 1. (b) The time course of qPd recovery in the dark. qPd was induced by light of intensity 1500 μmol m−2 s−1. Open symbols correspond to the experiments where leaves were infiltrated with lincomycin (see §2 Material and methods).
The kinetic measurements of qPd as an indication of the onset of photoinhibition shown in figure 2a enabled us to design the timing for the main routine used in this work, an example of which is shown in figure 1a. The development of this routine was essential because it allowed us to accumulate a large amount of data in a relatively short period of time. These data characterized many Arabidopsis leaves, showing natural variations in the relationship between NPQ and actinic light intensity as well as giving an estimation of the protective component, pNPQ.
Figure 3 shows the average values of qPd measured at the end of the illumination routine shown in figure 1 for plants with various levels of PsbS protein: wt, npq4 and L17. Photoinhibition was the highest in plants lacking PsbS and lowest (sometimes absent altogether) in the overexpressor of PsbS. Still, plants lacking PsbS were better protected than those where NPQ was removed by infiltration of leaves with an uncoupler [16]. Therefore, it was essential for us to perform a broad systematic study of the relationship between total NPQ and the actinic light intensity in order to extract a value for pNPQ and study its relationship with the maximum tolerated actinic light intensity in the three mentioned types of plants.
Figure 3.
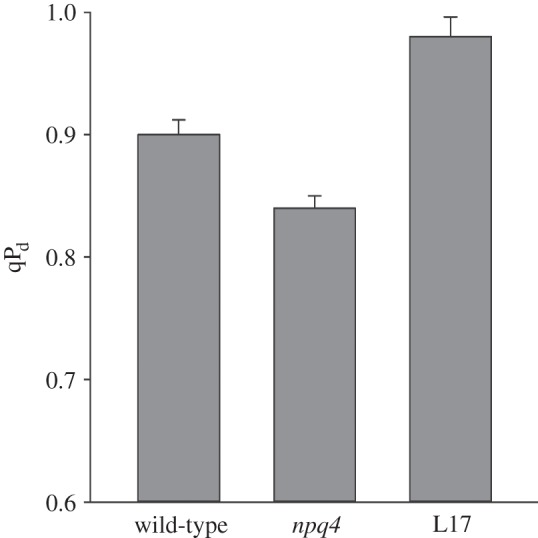
Levels of qPd induced at the end of the illumination routine presented in figure 1 with increasing light intensities in the leaves of wild-type, npq4 and L17 Arabidopsis plants. The data are averages of the measurements performed on 30 leaves. Error bars are standard deviations from the mean values.
(b). Testing light tolerance by photosystem II in intact Arabidopsis leaves
Figure 4a shows the relationship between ΦPSII/qPd and NPQ in one typical fluorescence induction run for a wild-type Arabidopsis leaf, as shown in figure 1a. Above a certain level of NPQ, ΦPSII began to deviate from the relationship described by formula (2.1) and simultaneously qPd started to decrease. These are the two independent signs of photoinhibition as previously described [16]. Leaves infiltrated with lincomycin revealed almost no difference in qPd dependence upon NPQ (figure 4a, closed triangles), in agreement with the previously reported results that used a different illumination routine [16]. Only at the highest actinic light intensity (1500 μmol m−2 s−1), was this relationship slightly affected by lincomycin, such that here qPd declined slightly more than in the control leaves. We have taken qPd as a criterion of photoinhibition to plot the relationship between NPQ and the actinic light intensity. Figure 4b shows this relationship measured for 35 leaves of three batches of plants. Three or four leaves were randomly selected on each tested plant. The qPd level was indicated by the shade and shape of the symbol used to mark the data point. The round black symbols indicated measurements where qPd was greater than 0.98, which was taken as a condition for identifying the undamaged state of PSII. The grey diamonds indicated the onset of photoinhibition, where qPd was found to be lower than 0.98. The fading grey of the diamonds coded the different extent of photoinhibitory damage as displayed by the legend presented on the right of figure 4b. The scatter of the data reflects natural variations in the relationship between NPQ and light intensity caused by various factors such as leaf age, electron transport rate, ΔpH, xanthophyll cycle activity, the structure of the grana membrane and the state of the PSII antenna. Importantly, this scatter revealed that leaves with higher NPQ levels were better protected than those tested at the same light intensity but with lower NPQ. NPQ displayed by the black symbols corresponds to the protective component of quenching, from now on used to define the level of pNPQ, i.e. the minimum level of NPQ necessary to avoid photoinhibition.
Figure 4.
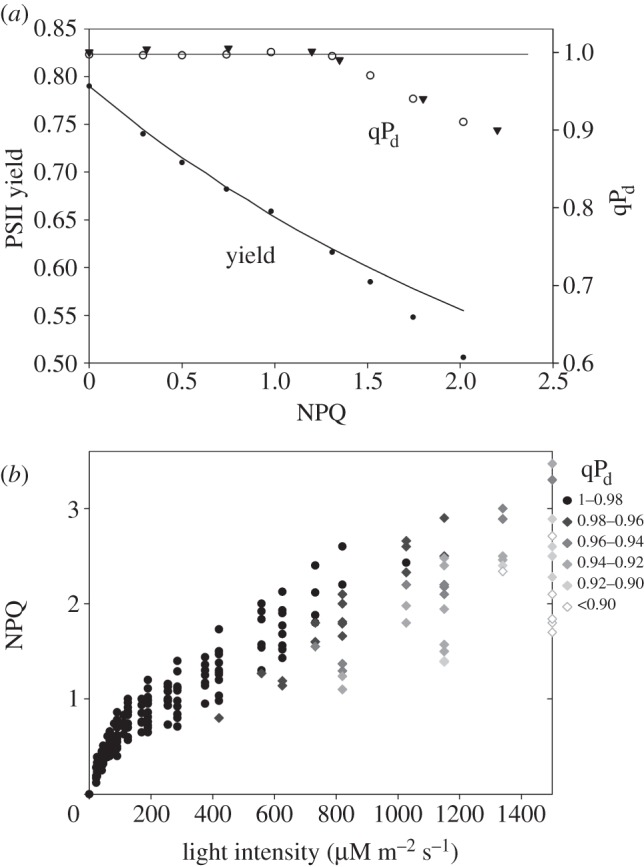
(a) The relationships between PSII yield/qPd and NPQ derived from the measurements on wild-type Arabidopsis leaves using the scheme presented in figure 1. Closed triangles correspond to the measurement on lincomycin-infiltrated leaf (see §2 Material and methods). (b) The relationship between NPQ, actinic light intensity and qPd derived from the measurements using figure 1 scheme on 35 leaves. The legend on the right explains the qPd scale of the grey shading of diamond symbols in order to reflect the extent of photodamage. For other details, see §3b.
Figures 5 and 6 show data similar to that shown in figure 4 obtained on plants lacking or overexpressing PsbS protein, respectively. In agreement with the previous report [16], npq4 plants showed earlier signs of photoinhibition (figure 5). Grey-coloured symbols in figure 5b appeared at somewhat lower light intensity in comparison with the wild-type leaves, showing more cases of extreme photoinhibition (qPd < 0.9, white diamonds). On the contrary, leaves of the PsbS overexpresser were almost completely resistant to photoinhibition, demonstrating much higher levels of pNPQ than the wild-type leaves (figure 6a). Indeed, figure 6b shows that very few leaves were characterized by grey diamonds, a sign of photoinhibition.
Figure 5.
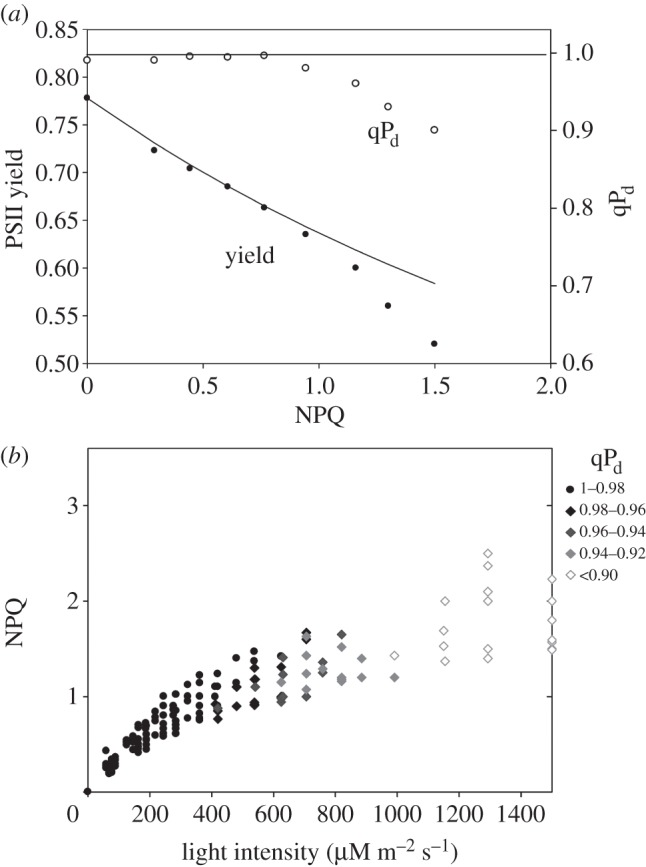
The relationships between PSII yield/qPd and NPQ derived from the measurements on the leaves of npq4 mutant (lacking PsbS) of Arabidopsis using the scheme presented in figure 1. (b) The relationship between NPQ, actinic light intensity and qPd derived from the measurements using figure 1 scheme on 30 leaves. The legend on the right shows the qPd scale of grey shading of diamond symbols to reflect the extent of photodamage. For other details, see §3b.
Figure 6.
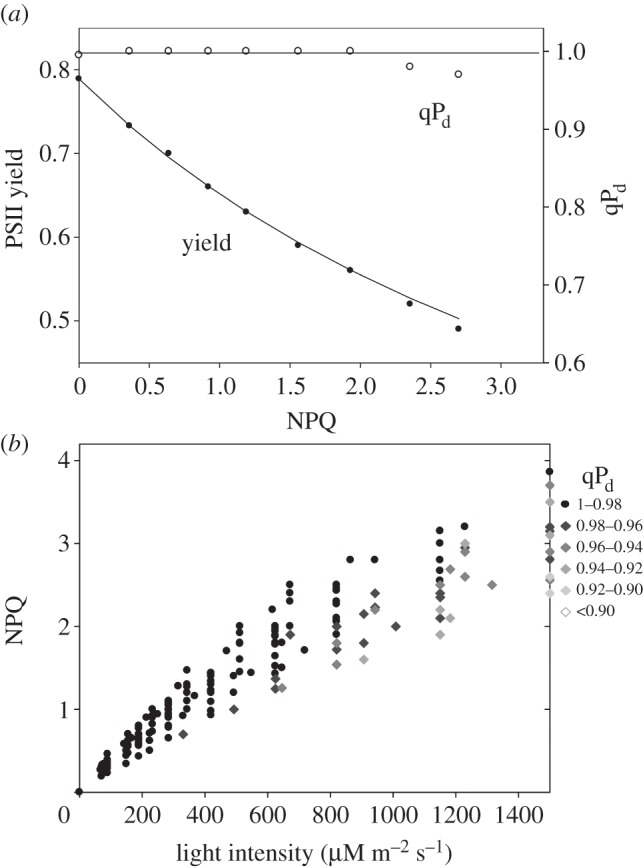
The relationships between PSII yield/qPd and NPQ derived from the measurements on the leaves of L17 mutant (overexpressor of PsbS) of Arabidopsis using the scheme presented in figure 1. (b) The relationship between NPQ, actinic light intensity and qPd derived from the measurements using figure 1 scheme on 35 leaves. The legend on the left explains the qPd scale of grey shading of diamond symbols in order to reflect different extent of the photodamage. For other details, see §3b.
(c). Universal relationship between the protective component of non-photochemical energy dissipation and maximum tolerated light intensity—chloroplast gains
All black symbols corresponding to healthy, uninhibited leaves of the three types of plants under investigation have been taken from figures 4b–6b and plotted together in figure 7 (grey, wt; black, npq4; and white, L17). Remarkably, all data followed a very similar trend: the higher actinic light intensity ‘required’ higher levels of pNPQ. The straight line drawn from the origin represents the best fit of the lowest pNPQ points in this relationship and reflected the minimum levels of pNPQ needed in order to protect PSII against photoinhibition at the given actinic light intensity. For example, pNPQ of unity was a minimum level of quenching required for the protection of PSII in leaves illuminated by a light intensity of 420 μmol m−2 s−1. In other words, if plants grown in a shaded environment (in this case, 90 μmol m−2 s−1) were to be exposed to 420 μmol m−2 s−1 of light, then it would require them to develop a level of NPQ not lower than unity to avoid photoinhibition (figure 7). For 840 μmol m−2 s−1, it would require them to build NPQ of two, and for 1260 μmol m−2 s−1 NPQ of three. Interestingly, NPQ of four would protect plants exposed to the very maximum light intensities attainable on our planet (approx. 1600 μmol m−2 s−1). NPQ of four (and even five) is often observed in many plants, particularly those grown in a high light environment [13,31]. Plants lacking PsbS protein possessed a maximum pNPQ level of about 1.5 in our experiments (black symbols), whereas the wild-type (grey symbols) and the PsbS overexpresser (white symbols) had maximum pNPQ of about 2.5 and 3.8, respectively. The universal relationship shown in figure 7 suggests it is likely that the sensitivity of the PSII reaction centres was similar in the three types of plants; otherwise, the gradient of the line joining the lowest pNPQ values would have been different in these plants.
Figure 7.
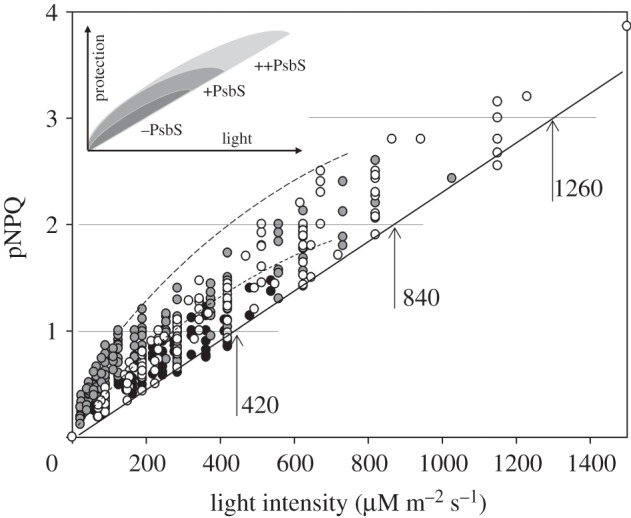
The relationship between protective NPQ component (pNPQ) and actinic light intensity taken from figures 4–6 for wild-type (grey), npq4 (black) and L17 (white) Arabidopsis plants. The solid straight line underlined the approximate level of minimum pNPQ required to maintain all PSII reaction centres intact (open in the dark after illumination). Vertical arrows show ‘safe’ light intensity levels, 420, 840 and 1260 μmol m−2 s−1 for which minimum NPQ of 1, 2 and 3, respectively, is required to totally protect PSII against photoinhibition. Inset: schematic of the point spread in pNPQ versus light intensity relationship, highlighting the fact that the data redistribution of the wild-type and L17 plants is much broader than that for the npq4 mutant. For further discussion, see §3c,d.
(d). Is there a wasteful energy dissipation component in non-photochemical energy dissipation—chloroplast losses?
The pNPQ data for a given actinic light intensity shown in figure 7 exhibit a rather broad variation range, with the majority of tested leaves expressing higher NPQ levels than the minimum required to avoid photoinhibition. This is particularly notable for the wild-type and the PsbS overexpresser plants. The long-dashed curve projects the upper limits of pNPQ attained for these two types of plants. The inset in figure 7 schematically summarizes the redistribution of the data points for the three types of studied plants. This extra quenching is particularly large for rather low actinic light intensities. For the npq4 plants, this quenching is rather low (the upper limit depicted by the short-dashed line). One of the reasons why npq4 plants possessed much lower ‘extra’ quenching is that NPQ forms much more slowly in these plants, whereas in the wild-type and L17, it forms more quickly during each illumination step. Thus the rather strong (relatively) quenching was forming in these plants at very low light intensities. The early build-up of the ‘extra’ pNPQ is possibly a response to exposure to a higher light intensity than that in which the plants were grown. This overreaction can be due to a low electron transport and ATP synthesis capacity in shade-adapted plants, resulting in the subsequent build-up of a proton gradient that triggered relatively strong quenching at lower light intensities. In fact, this quenching could be defined as wasteful, wNPQ, because it undermines ΦPSII (see formula (2.1)).
(e). Quantifying the tolerated light intensity
The data shown in figures 4b–6b were used to obtain light tolerance curves for the three types of plants studied here. Figure 8 displays these curves. The data points, percentages of photoinhibited leaves, have been obtained by taking the data for each level of actinic light intensity used and calculating the fraction of grey diamonds in the total number of measurements. The latter corresponds to the total number of leaves subjected to the given actinic light intensity. For example, in figure 4b, the light intensity of 620 μmol m−2 s−1 caused the onset of photoinhibition for only two of 10 tested leaves, giving approximately 20% photoinhibited leaves for this intensity (figure 8a). On the other hand, at the light intensity of 820 μmol m−2 s−1, only two of 11 tested leaves were unaffected by photoinhibition resulting in approximately 82% of leaves being photoinhibited following exposure to light of this intensity (figure 8a). As a result of these calculations, the built light tolerance curves enabled us to produce several important quantitative parameters:
— the light intensity at which 50% of leaves tolerate photoinhibition (I50% toler.);
— the light intensity tolerated by all leaves (I100% toler.); and
— the minimum light intensity required to induce signs of photoinhibition in all leaves (Imin all inhib.).
Figure 8.
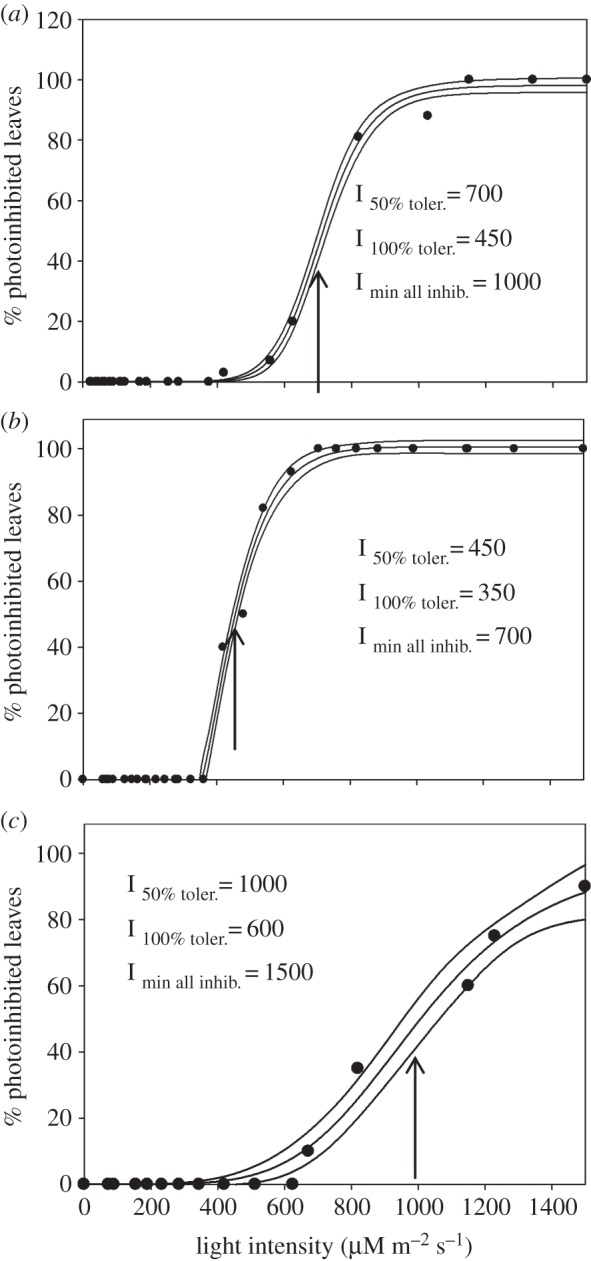
The relationship between the percentage of leaves affected by photoinhibition and the actinic light intensity derived from the data shown in figures 4b–6b for wild-type (a), npq4 (b) and L17 (c) Arabidopsis plants. Solid lines are regression data fit curves with 95% confidence bands obtained using SigmaPlot12 software (Systat Software, Chicago, IL, USA). For further details, see §3e.
The values of these parameters are shown in figure 8. Thus, the wild-type plants grown in a rather shaded environment could grow unaffected by photoinhibition at a maximum light intensity of 450 μmol m−2 s−1, whereas plants missing PsbS protein could tolerate a light intensity of only 350 μmol m−2 s−1. Plants with overexpressed levels of PsbS could easily tolerate light of 600 μmol m−2 s−1.
4. Discussion
This paper presents the first systematic methodology based upon the principle of estimation of the photoprotective component of NPQ, pNPQ, as recently reported by Ruban & Murchie [16]. The essential part of this work was to develop a relatively fast, reproducible and effective fluorescence measurement routine that could be used in future work assessing the efficiency of the control of PSII electron transport by NPQ in intact plants as well as the extent of the photodamage to its reaction centre as a primary sign of a harmful light environment for plants to grow within. An essential difference between the proposed methodology and previously used methods based on kinetic or spectral decomposition of NPQ components [6,7,32] is the use of photoinhibition (closure of reaction centre II; RCII) as an ultimate criterion to distinguish the protective part of NPQ from the photoinhibitory one. In addition, our approach enables gradual formation of NPQ with step-by-step measurement of the intactness of the RCII population, hence providing quantitative information about the light intensity range plants can tolerate. On the other hand, the kinetic criteria of NPQ component resolution possessed one major setback: qZ and qI components were found to recover on a similar timescale. The spectral criterion proposed recently by Holzwarth and co-workers [32] cannot be applied for the majority of measurements on leaves owing to reabsorption artefact that causes significant distortion of their chlorophyll fluorescence spectra.
Common procedures that do not use chlorophyll fluorescence to assess photoinhibition include dark-adapted Fv/Fm, and O2 evolution or D1 degradation [3,4,6,20]. While these methods have been effective for assessing the threshold for damage and providing some key insights into the mechanism of the process, they have drawbacks for physiological analyses, especially where laboratory-based biochemical analysis is required (O2 evolution and D1 turnover). In addition, they require disruption of the light treatment, either by destructive sampling or imposition of a sustained dark period. The length of the dark period used for Fv/Fm measurements itself can lead to ambiguity. An alternative method was based on measuring the flash-induced redox kinetics of P700 [33]. This method, however, was time-consuming and, being based on PSI only, needed to be constantly validated by the level of Fv/Fm in the dark, returning to the problem of sustained dark adaptation of the plant [34].
The timings, actinic light intensity range and the duration of the whole routine were the major factors systematically explored in this study. As a result of rigorous and time-consuming trials, a routine that lasts for about 42 min instead of the 15–20 min (with only one cycle of illumination) of conventional NPQ analysis has been developed. This method does not use dark recovery cycles [35] in which the reversible NPQ component, qE, is monitored. A gradual stepwise increase in the actinic light intensity is one of the major features of the new approach, giving some time for NPQ to develop initially at the light intensities that do not cause photodamage to PSII, even in plants with a slow forming qE component such as the npq4 mutant [36,37]. The other important feature is the short period of darkness between actinic light steps. It is crucial for determination of Fo′ and comparison with the calculated Fo′ in order to detect signs of photoinhibition via calculation of qPd (figure 1 and formula (2.3)). Thus, a protective criterion (qPd) rather than a kinetic one (the fast recovery of qE) is used here to distinguish between the protective part of NPQ and the inhibitory parts that are gradually formed by stepwise increase in the actinic light intensity. It was important not to make the new routine impractically lengthy. Therefore, measurements of the kinetics of qPd establishment itself were undertaken to get an idea of how long the illumination cycles should be in the new method. Because more than 70% of the total decline in qPd happened for inhibitory light intensity within the first 5 min of illumination, it was concluded that each illumination step should have a duration of no less than 5 min; comparison of the current results with those obtained using 10 min cycles revealed no significant differences (not shown). However, one cannot exclude that for plants grown under different light regimes or for different species the kinetics of qPd decline would be different. Therefore, one has to monitor the qI onset kinetics first in order to decide about the choice of the actinic light duration. The newly proposed NPQ induction routine is indeed arbitrary by nature. Why are there eight steps in light intensities? Why not use continuously increasing light? No doubt, future experimentation will lead to improvements in the accuracy and sensitivity of this routine. Currently, however, it seems to be a reasonable method for comparing the photoprotective potential of NPQ in different types of plants, grown in different conditions, experiencing different combinations of stresses, etc., and to give an idea about the ‘safe’ light intensity range under which they can grow. It should be expected that the relationship between pNPQ and actinic light intensity displayed in figure 7 can change, so that the gradient of the line tracing the minimum NPQ required to protect against photodamage at given light intensity will be different in, for example, shade- and high-light-grown plants and be affected by the onset of water and temperature stresses. In addition, different plant species could possess different PSII turnover rates that should affect RCII's sensitivity to photoinhibition [4] as well as the rate of the build-up of the excitation pressure. Hence, we anticipate in future a flow of insightful results in the course of application of the proposed methodology, particularly those related to monitoring the state of PSII activity in crops.
Another important physiological aspect of the application of the proposed procedure is the way the leaves were selected for the measurements. As was mentioned before, leaves were randomly picked; hence all types of plant leaves were used: very young, ageing and established. For this matter, the existence of a relatively broad spread of the data presented in figure 7 is not surprising. The possibility of overprotection that was introduced above as wNPQ is one of the explanations of these variations. However, further investigation of this phenomenon, which goes beyond the scope of this report, is required.
The novel methodology we describe here can potentially be instrumental in understanding the trade-offs between the metabolic costs of photoinhibition and the reduction in quantum yield caused by NPQ [38]. It is well-established that unbalancing these trade-offs has the potential to substantially reduce plant productivity [39,40]. The new approach is by nature a monitoring one, and thus can be broadly applied to the monitoring of crop protection in a variety of outdoor and indoor light environments. This monitoring will allow us to obtain clear clues of how to optimize plant tolerance to both light and the light environment itself.
Acknowledgements
We acknowledge Dr Petra Ungerer for her assistance with the growing and conditioning plants and for several fruitful discussions. We also thank Christopher Duffy for his critical reading of the manuscript. We express our gratitude to Drs Erhard Pfündel and Mathias Brügel of the Heinz Walz GmbH company for efficient technical assistance, provision of the basic batch programme for the Junior PAM fluorometer and advice.
Funding statement
This work was supported by The Leverhulme Trust research grant no. RPG-2012-478 awarded to A.V.R.
References
- 1.Blankenship RE. 2002. Molecular mechanisms of photosynthesis. Oxford, UK: Blackwell Science. [Google Scholar]
- 2.Ruban A. 2012. The photosynthetic membrane: molecular mechanisms and biophysics of light harvesting. Oxford, UK: Wiley-Blackwell. [Google Scholar]
- 3.Powles SB. 1984. Photoinhibition of photosynthesis induced by visible-light. Annu. Rev. Plant Physiol. Plant Mol. Biol. 35, 15–44. ( 10.1146/annurev.arplant.35.1.15) [DOI] [Google Scholar]
- 4.Barber J. 1995. Molecular-basis of the vulnerability of photosystem-II to damage by light. Aust. J. Plant Physiol. 22, 201–208. ( 10.1071/PP9950201) [DOI] [Google Scholar]
- 5.Osmond CB. 1994. What is photoinhibition? Some insights from comparisons of shade and sun plants. In Photoinhibition of photosynthesis (eds Baker NR, Bowyer JR.), pp. 1–24. Lancaster, UK: Bios Scientific. [Google Scholar]
- 6.Adams WW, III, Zarter CR, Mueh KE, Amiard V, Demmig-Adams B. 2006. Energy dissipation and photoinhibition: a continuum of photoprotection. In Photoprotection, photoinhibition, gene regulation, and environment (eds Demmig-Adams B, Adams WW, III, Mattoo AK.), pp. 49–64. Dordrecht, The Netherlands: Springer. [Google Scholar]
- 7.Ruban AV, Johnson MP, Duffy CDP. 2012. Photoprotective molecular switch in photosystem II. Biochim. Biophys. Acta 1817, 167–181. ( 10.1016/j.bbabio.2011.04.007) [DOI] [PubMed] [Google Scholar]
- 8.Schreiber U. 1986. Detection of rapid induction kinetics with a new type of high frequency modulated chlorophyll fluorometer. Photosynth. Res. 9, 261–272. ( 10.1007/BF00029749) [DOI] [PubMed] [Google Scholar]
- 9.Demmig-Adams B, Adams WW., III 1992. Photoprotection and other responses of plants to high light stress. Annu. Rev. Plant Physiol. Plant Mol. Biol. 43, 599–626. ( 10.1146/annurev.pp.43.060192.003123) [DOI] [Google Scholar]
- 10.Adams WW, III, Demmig-Adams B, Winter K. 1990. Relative contributions of zeaxanthin-related and zeaxanthin-unrelated types of ‘high energy-state’ quenching of chlorophyll fluorescence in spinach leaves exposed to various environmental conditions. Plant Physiol. 92, 302–309. ( 10.1104/pp.92.2.302) [DOI] [PMC free article] [PubMed] [Google Scholar]
- 11.Demmig-Adams B, Winter K, Kruger A, Czygan F-Z. 1989. Zeaxanthin synthesis, energy dissipation, and photoprotection of photosystem II at chilling temperatures. Plant Physiol. 90, 894–898. ( 10.1104/pp.90.3.894) [DOI] [PMC free article] [PubMed] [Google Scholar]
- 12.Baker NR, Horton P. 1987. Physiological factors associated with fluorescence quenching during photoinhibition. In Topics in photosynthesis, photoinhibition, vol. 9, (eds Arntzen CJ, Kyle DJ, Osmond CB.), pp. 145–168. Amsterdam, The Netherlands: Elsevier. [Google Scholar]
- 13.Ruban AV, Young AJ, Horton P. 1993. Induction of nonphotochemical energy dissipation and absorbance changes in leaves. Evidence for changes in the state of the light-harvesting system of photosystem II in vivo. Plant Physiol. 102, 741–750. [DOI] [PMC free article] [PubMed] [Google Scholar]
- 14.Ruban AV, Horton P. 1995. An investigation of the sustained component of nonphotochemical quenching of chlorophyll fluorescence in isolated chloroplasts and leaves of spinach. Plant Physiol. 108, 721–726. [DOI] [PMC free article] [PubMed] [Google Scholar]
- 15.Oquist G, Huner NPA. 2003. Photosynthesis of overwintering evergreen plants. Annu. Rev. Plant Biol. 54, 329–355. ( 10.1146/annurev.arplant.54.072402.115741) [DOI] [PubMed] [Google Scholar]
- 16.Ruban AV, Murchie EH. 2012. Assessing the photoprotective effectiveness of non-photochemical chlorophyll fluorescence quenching: a new approach. Biochim. Biophys. Acta 1817, 977–982. ( 10.1016/j.bbabio.2012.03.026) [DOI] [PubMed] [Google Scholar]
- 17.Weis E, Berry JA. 1987. Quantum efficiency of photosystem-II in relation to energy-dependent quenching of chlorophyll fluorescence. Biochim. Biophys. Acta 894, 198–208. ( 10.1016/0005-2728(87)90190-3) [DOI] [Google Scholar]
- 18.Oxborough K, Horton P. 1988. A study of the regulation and function of energy-dependent quenching in pea-chloroplasts. Biochim. Biophys. Acta 934, 135–143. ( 10.1016/0005-2728(88)90128-4) [DOI] [Google Scholar]
- 19.Genty B, Briantais J-M, Baker NR. 1989. The relationship between the quantum yield of photosynthetic electron-transport and quenching of chlorophyll fluorescence. Biochim. Biophys. Acta 990, 87–92. ( 10.1016/S0304-4165(89)80016-9) [DOI] [Google Scholar]
- 20.Vass I. 2012. Molecular mechanisms of photodamage in the photosystem II complex. Biochim. Biophys. Acta 1817, 209–217. ( 10.1016/j.bbabio.2011.04.014) [DOI] [PubMed] [Google Scholar]
- 21.Krause GH, Weis E. 1991. Chlorophyll fluorescence and photosynthesis: the basics. Annu. Rev. Plant Physiol. Plant Mol. Biol. 42, 313–349. ( 10.1146/annurev.pp.42.060191.001525) [DOI] [Google Scholar]
- 22.Oxborough K, Baker NR. 1997. Resolving chlorophyll a fluorescence of photosynthetic efficiency into photochemical components – calculation of qP and Fv’/Fm’ without measuring Fo’. Photosynth. Res. 54, 135–142. ( 10.1023/A:1005936823310) [DOI] [Google Scholar]
- 23.Nishio JN, Sun J, Vogelmann TC. 1994. Photoinhibition and the light environment within leaves. In Photoinhibition of photosynthesis (eds Baker NR, Bowyer JR.), pp. 221–237. Lancaster, UK: Bios Scientific. [Google Scholar]
- 24.Havaux M, Niyogi KK. 1999. The violaxanthin cycle protects plants from photooxidative damage by more than one mechanism. Proc. Natl Acad. Sci. USA 96, 8762–8767. ( 10.1073/pnas.96.15.8762) [DOI] [PMC free article] [PubMed] [Google Scholar]
- 25.Li XP, Muller-Moule P, Gilmore AM, Niyogi KK. 2002. PsbS-dependent enhancement of feedback de-excitation protects photosystem II from photoinhibition. Proc. Natl Acad. Sci. USA 99, 15 222–15 227. ( 10.1073/pnas.232447699) [DOI] [PMC free article] [PubMed] [Google Scholar]
- 26.Crouchman S, Ruban AV, Horton P. 2006. PsbS enhances nonphotochemical fluorescence quenching in the absence of zeaxanthin. FEBS Lett. 580, 2053–2058. ( 10.1016/j.febslet.2006.03.005) [DOI] [PubMed] [Google Scholar]
- 27.Matsubara S, Chow WS. 2004. Populations of photoinhibited photosystem II reaction centers characterized by chlorophyll a fluorescence lifetime in vivo. Proc. Natl Acad. Sci. USA 101, 18 234–18 239. ( 10.1073/pnas.0403857102) [DOI] [PMC free article] [PubMed] [Google Scholar]
- 28.Andersson B, Aro E-M. 2001. Photodamage and D1 protein turnover in photosystem II. In Regulation of photosynthesis (eds Aro E-M, Andersson B.), pp. 377–393. Dordrecht, The Netherlands: Kluwer Academic. [Google Scholar]
- 29.Anderson B, et al. 1994. Light-induced proteolysis of photosystem II reaction centre and light-harvesting complex II proteins in isolated chloroplasts. In Photoinhibition of photosynthesis (eds Baker NR, Bowyer JR.), pp. 143–159. Lancaster, UK: Bios Scientific. [Google Scholar]
- 30.Aro E-M, Virgin I, Andersson B. 1993. Photoinhibition of photosystem II-inactivation, protein damage and turnover. Biochim. Biophys. Acta 1143, 113–134. ( 10.1016/0005-2728(93)90134-2) [DOI] [PubMed] [Google Scholar]
- 31.Bilger W, Bjorkman O. 1991. Temperature dependence of violaxanthin de-epoxidation and non-phtochemcial fluorescence quenching in intact leaves of Gossypium hirsutum L and Malva parviflora L. Planta 184, 226–234. ( 10.1007/BF01102422) [DOI] [PubMed] [Google Scholar]
- 32.Lambrev PH, Nilkens M, Miloslavina Y, Jahns P, Holzwarth AR. 2010. Kinetic and spectral resolution of multiple nonphotochemical quenching components in Arabidopsis leaves. Plant Physiol. 152, 1611–1624. ( 10.1104/pp.109.148213) [DOI] [PMC free article] [PubMed] [Google Scholar]
- 33.Chow WS. 1994. Photoprotection and photoinhibitory damage. Adv. Mol. Cell. Biol. 10, 151–196. ( 10.1016/S1569-2558(08)60397-5) [DOI] [Google Scholar]
- 34.Losciale P, Oguchi R, Hendrickson L, Hope AB, Corelli-Grappadelli L, Chow WS. 2008. A universal correlation between flash-induced P700 redox kinetics and photoinactivation of photosystem II in all leaves? In Photosynthesis. Energy from the Sun: 14th International Congress on Photosynthesis (eds Allen JF, Gantt E, Golbeck JH, Osmond B.), pp. 1421–1424. Berlin, Germany: Springer. [Google Scholar]
- 35.Maxwell K, Johnson GN. 2000. Chlorophyll fluorescence: a practical guide. J. Exp. Bot. 345, 659–668. ( 10.1093/jexbot/51.345.659) [DOI] [PubMed] [Google Scholar]
- 36.Johnson MP, Ruban AV. 2010. Arabidopsis plants lacking PsbS protein possess photoprotective energy dissipation. Plant J. 61, 283–289. ( 10.1111/j.1365-313X.2009.04051.x) [DOI] [PubMed] [Google Scholar]
- 37.Johnson MP, Ruban AV. 2011. Restoration of rapidly-reversible photoprotective energy dissipation in the absence of PsbS protein by enhanced ΔpH. J. Biol. Chem. 286, 19 973–19 981. ( 10.1074/jbc.M111.237255) [DOI] [PMC free article] [PubMed] [Google Scholar]
- 38.Demmig-Adams B, Cohu CM, Muller O, Adams WW., III 2012. Modulation of photosynthetic energy conversion efficiency in nature: from seconds to seasons. Photosynth. Res. 113, 75–88. ( 10.1007/s11120-012-9761-6) [DOI] [PubMed] [Google Scholar]
- 39.Zhu XG, Ort DR, Whitmarsh J, Long SP. 2004. The slow reversibility of photosystem II thermal energy dissipation on transfer form high to low light may cause large losses in carbon gain by crop canopies: a theoretical analysis. J. Exp. Bot. 55, 1167–1175. ( 10.1093/jxb/erh141) [DOI] [PubMed] [Google Scholar]
- 40.Murchie EH, Pinto M, Horton P. 2009. Agriculture and the new challenges for photosynthesis research. New Phytol. 181, 532–552. ( 10.1111/j.1469-8137.2008.02705.x) [DOI] [PubMed] [Google Scholar]


