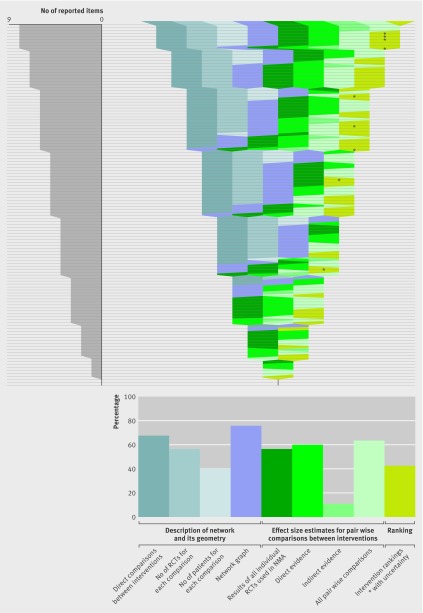
Reporting items for results of network meta-analyses. The idea is to show which items were reported in each of the 121 network meta-analyses. Each horizontal line of the gap chart corresponds to one network meta-analysis report. A specific colour was attributed to each of the 10 items studied. The colour bands show which of these items (labelled at the top) were reported for each network meta-analysis. Items were grouped into three categories: 4 items in blue pertain to the description of network, and 1 item in purple pertains to its geometry (network graph); 4 items in green pertain to effect size estimates for pairwise comparisons between interventions; 1 item pertains to intervention ranking. The 121 network meta-analysis reports were sorted according to the total number of reported items, in decreasing order. The diagram on the left shows the distribution of the total number of reported items across the 121 network meta-analyses. The diagram at the bottom shows the proportion of network meta-analysis reports that reported each item

An official website of the United States government
Here's how you know
Official websites use .gov
A
.gov website belongs to an official
government organization in the United States.
Secure .gov websites use HTTPS
A lock (
) or https:// means you've safely
connected to the .gov website. Share sensitive
information only on official, secure websites.
