

Abstract
Microstructural white matter deficits in Autism Spectrum Disorders (ASD) have been suggested by both histological findings and Diffusion Tensor Imaging (DTI) studies, which show reduced fractional anisotropy (FA) and increased mean diffusivity (MD). However, imaging reports are generally not consistent across studies and the underlying physiological causes of the reported differences in FA and MD remain poorly understood. In this study, we sought to further characterize white matter deficits in ASD by employing an advanced diffusion imaging method, the Diffusional Kurtosis Imaging (DKI), and a two-compartment diffusion model of white matter. This model differentially describes intra- and extra-axonal white matter compartments using Axonal Water Fraction (faxon) a measure reflecting axonal caliber and density, and compartment-specific diffusivity measures. Diagnostic utility of these measures and associations with processing speed performance were also examined. Comparative studies were conducted in 16 young male adults with High Functioning Autism (HFA) and 17 typically developing control participants (TDC). Significantly decreased faxon was observed in HFA compared to the control group in most of the major white matter tracts, including the corpus callosum, cortico-spinal tracts, and superior longitudinal, inferior longitudinal and inferior fronto-occipital fasciculi. Intra-axonal diffusivity (Daxon) was also found to be reduced in some of these regions. Decreased axial extra-axonal diffusivity (ADextra) was noted in the genu of the corpus callosum. Reduced processing speed significantly correlated with decreased faxon and Daxon in several tracts. faxon of the left cortico-spinal tract and superior longitudinal fasciculi showed good accuracy in discriminating the HFA and TDC groups. In conclusion, these findings suggest altered axonal microstructure in young adults with HFA which is associated with reduced processing speed. Compartment-specific diffusion metrics appear to improve specificity and sensitivity to white matter deficits in this population.
Abbreviations: faxon, Axonal Water Fraction; Daxon, Intra-axonal diffusivity; ADextra, Axial extra-axonal diffusivity; RDextra, Radial extra-axonal diffusivity; FA, Fractional anisotropy; MD, Mean diffusivity; AD, Axial diffusivity; RD, Radial diffusivity; HFA, High Functioning Autism; ASD, Autism Spectrum Disorders; TDC, Typically developing control; DigitSC, Digit Symbol-Coding; DTI, Diffusion Tensor Imaging; DKI, Diffusional Kurtosis Imaging
Keywords: Autism Spectrum Disorders, White matter, Diffusional Kurtosis Imaging, Axonal integrity, Processing speed, Information processing capacity
Highlights
-
•
White matter microstructure is altered in young adults with High Functioning Autism.
-
•
We report decreased Axonal Water Fraction and intra-axonal diffusivity.
-
•
Changes in these DKI metrics are consistent with axonal deficits.
-
•
Alterations in axonal diffusion metrics correlate with reduced processing speed.
-
•
DKI may yield promising biomarkers for autism diagnosis and characterization.
1. Introduction
Autism Spectrum Disorders (ASD) are complex developmental disorders that are characterized by a series of deficits in social interaction, language, behavior, and cognitive functions. Current ASD prevalence is estimated at 1 in 50 children (Blumberg et al., 2013). The disease symptoms are typically apparent in early infancy around 2–3 years of age, however subtle symptoms and brain deficits are likely to be present at earlier ages (Tager-Flusberg, 2010, Wolff et al., 2012).
Findings in the last decade have suggested that ASD involves pervasive brain abnormalities and dysfunction across multiple functional domains (Belmonte et al., 2004). However these brain abnormalities as well as their relationship to disease symptoms are far from being completely understood. Several lines of evidence have implicated abnormalities in the white matter pathways connecting different brain regions. For example, morphological studies have shown abnormal white matter growth patterns (Courchesne, 2004), with abnormal enlargement of the white matter in young autistic children but decreased volume in autistic adolescents. Moreover, task-based or resting-state functional MRI (FMRI) experiments (Just et al., 2007) have indicated atypical functional connectivity, suggesting impaired communication between different brain regions, potentially driven by anatomical substrates, i.e., white matter pathways.
More recently, the advent of Diffusion Tensor Imaging (DTI) has allowed the characterization of some of the microstructural properties of white matter using fractional anisotropy (FA) and diffusivity (mean (MD), axial (AD), and radial diffusivity (RD)) metrics. Most studies have reported reduced FA and/or increased diffusivity in ASD; however these findings were not always replicated, with either no differences or even increases in FA also reported (Travers et al., 2012). These inconsistencies have been partially attributed to differences in the age ranges of the populations under consideration and differences in methodology across studies (Travers et al., 2012). In particular, FA and MD differences between ASD and control groups have been more consistently reported in children populations (Jou et al., 2011), but not in adult ones (Kleinhans et al., 2012). Most importantly, recent reports have highlighted the lack of specificity of the DTI metrics as one of their chief limitations (Travers et al., 2012, Walker et al., 2012). In particular, both FA and MD differences may arise from a variety of factors including differences in myelination, axonal fiber density and caliber, and fiber tract homogeneity, making it difficult to interpret the underlying pathology of the observed differences.
Novel advanced diffusion imaging approaches have sought to improve white matter characterization by employing multi-compartment models to more independently describe different white matter features (Panagiotaki et al., 2012). One such approach is a two-compartment model of white matter (Fieremans et al., 2011) based on the Diffusional Kurtosis Imaging (DKI) technique. This model, valid in homogeneous white matter regions of similarly oriented fibers, separates MR signal contributions from the intra-axonal and the extra-axonal water (Fig. 1) with myelin water contributions being neglected, as they are not detectable for imaging parameters that are employed in typical diffusion imaging experiments. Thus, diffusion in each compartment is described by a different diffusion tensor. A first parameter that can be obtained is the Axonal Water Fraction (faxon), which represents the volume of intra-axonal water relative to the total intra and extra-axonal water volume. In addition, the model also provides diffusivity metrics that describe properties of the two compartments: the intra-axonal diffusivity, Daxon, considered to primarily occur along the axial direction (i.e., along the axonal axis), and the extra-axonal axial (ADextra) and radial (RDextra) diffusivities (Fig. 1). faxon is generally assumed to relate to axonal density and caliber (Barazany et al., 2009, De Santis et al., 2012, Fieremans et al., 2012), with more dense and/or larger axons resulting in larger values of this parameter. Daxon reflects intra-axonal microscopical organization and thus its changes may reflect variations in the size and/or number of intra-axonal structures such as microfilaments, microtubules, or mitochondria. ADextra and RDextra describe the extra-axonal space; changes in these parameters might reflect loss of extra-axonal structures such as oligodendrocytes and astrocytes or may be related to extracellular inflammation (Fieremans et al., 2013). RDextra, which describe diffusion in the extra-axonal space in the direction perpendicular to axonal direction, may also reflect changes in axonal packing (i.e., sparser versus more compact arrangements) due to either dysmyelination or reduced axonal caliber or density. These metrics have been recently shown to improve upon the understanding of white matter changes in pathologies such as Alzheimer's disease (Benitez et al., 2013), schizophrenia (Lazar et al., 2013), and stroke (Hui et al., 2012).
Fig. 1.
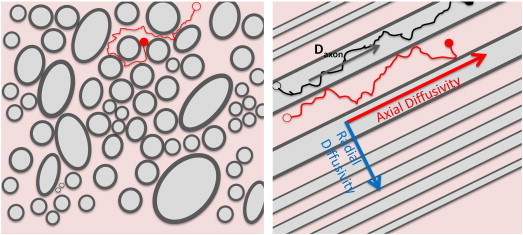
Water diffusion in white matter is modeled using a two-compartment approach that assumes that the diffusion signal arises from intra-axonal (light gray) and extra-axonal (light pink) water. Axonal density and caliber are described by Axonal Water Fraction (faxon), which represents the ratio of intra-axonal (light gray regions) and total intra- and extra-axonal water (light gray + light pink regions). The measured intra-axonal diffusivity (Daxon) is assumed to be primarily axial for typical axonal sizes and diffusion imaging parameters and for areas of high anisotropy where axons are similarly oriented. Axial (along the axons) and radial (perpendicular to axonal direction) diffusivities (ADextra, respectively RDextra) describe water diffusion within the extra-axonal compartment. (For interpretation of the references to color in this figure legend, the reader is referred to the web version of this article.)
Thus, in this study we employed the DKI approach to investigate differences in the white matter intra- and extra-axonal diffusion properties in a group of young adults with High Functioning Autism (HFA) compared to a control group of typically developing (TDC) young adults. The diagnostic utility of these new metrics has also been tested. The DKI approach also allows estimation of the DTI parameters from the same set of images. Thus, differences between the two groups in the DTI parameters (FA, MD, AD, and RD) were examined in order to allow comparison of our data with previous published work. Finally, given the primary role of white matter in the information flow between different brain regions, we examined the relationship between white matter diffusion properties and a metric describing information processing capacity and speed. Processing speed is generally found to be impaired in autism (Hedvall et al., 2013, Oliveras-Rentas et al., 2012, Roberts et al., 2011). However, there is still a limited understanding of the neural substrates of this deficit.
2. Methods and materials
2.1. Participants
Behavioral and diffusion imaging data were obtained for 17 typically developing control (TDC) young adults and 16 young adults with a diagnosis of High Functioning Autism (HFA). HFA was defined in this study by a diagnosis of autism disorder and a Full IQ > 80. All participants were males between 18 and 25 years old recruited by advertising the study in the New York City area. All participants were right handed except for one participant in each group with mixed handedness. A summary of demographical variables is presented in Table 1.
Table 1.
Summary of demographic characteristics and IQ data for the typically developing control (TDC) and High Functioning Autism (HFA) groups and summary of diagnostic scores for the HFA group. Significant differences (*p < 0.05) between groups were found in Performance IQ and Digit Symbol-Coding (DigitSC). Abbreviations: Comm&RSI—communication and reciprocal social interaction; SBRI—stereotyped behaviors and restricted interests; SARRB—social affect and restrictive and repetitive behaviors; QA-Comm—qualitative abnormalities in communication; QA-RSI—qualitative abnormalities in reciprocal social interaction; RR-SPB—restricted, repetitive, and stereotyped patterns of behavior; Devel—abnormality of development evident at or before 36 months.
| TD (N = 17) | HFA (N = 16) | p-value | |
|---|---|---|---|
| Age | 21.71 ± 2.14 | 21.38 ± 2.39 | .678 |
| Full IQ | 116.65 ± 11.98 | 108.88 ± 17.39 | .143 |
| Verbal IQ | 119.18 ± 13.14 | 115 ± 23.75 | .351 |
| Performance IQ | 110.53 ± 10.19 | 102.44 ± 11.87 | .045* |
| DigitSC | 11.12 ± 2.71 | 8.13 ± 1.15 | .033* |
| Handedness | 14.53 ± 3.59 | 14.81 ± 3.04 | .809 |
| Education | 15.29 ± 1.49 | 14.87 ± 1.75 | .463 |
| ADOS Comm&RSI | 9.00 ± 3.37 | ||
| SBRI | 1.43 ± 1.20 | ||
| SARRB | 8.81 ± 3.61 | ||
| ADI-R QA-Comm | 15.27 ± 5.02 (*N = 11) | ||
| QA-RSI | 19.18 ± 7.02 | ||
| RR-SPB | 5.54 ± 1.75 | ||
| Devel | 3.81 ± 1.47 |
TD participants had no history of any psychiatric, neurological, or developmental disorders. None of the participants (TDC or HFA) reported a history of head injury or of organic brain disorder. All participants included in the study had unremarkable MRI data, with no gross brain abnormalities noted on the radiological examination, performed by members of the Neuroradiology Section as part of the standard workflow in our department. The study was approved by the Institutional Review Board at the New York University Langone Medical Center.
2.2. Diagnostic and behavioral characterization
Autism Diagnostic Observation Schedule (ADOS) (Lord et al., 2000) and Autism Diagnostic Interview—Revised (ADI-R) (Lord et al., 1994) were employed to confirm a diagnosis of autism disorder. ADI-R was administered only for those participants for whom a caregiver was available to participate in the study (N = 11). Both typical ADOS (Lord et al., 2000) and ADI-R (Lord et al., 1994) scores as well as a new summary factor that was found to be more sensitive to ASD cases situated at the high functioning end of the autism spectrum (Bastiaansen et al., 2011, Gotham et al., 2007) were employed to reach a final diagnostic decision. Table 1 presents a summary of the ADOS and ADI-R results.
All participants, both TD and with an ASD diagnosis participated in IQ assessments based on Wechsler Adult Intelligence Scale-III (WAIS-III); these data were also used to confirm that the ASD participants were on the high functioning end of the autism spectrum (i.e., Full Scale IQ > 80). The Digit Symbol-Coding (DigitSC) subtest of WAIS-III was employed as a measure of processing speed performance. DigitSC has been shown to reflect the information processing capacity (Royer, 1971), where capacity is defined as the number of cognitive operations that can be carried out at one time; its processing time reflects visual processing time, psychomotor speed, visual–motor coordination, and short-term memory (Crowe et al., 1999).
All behavioral and diagnostic assessments were conducted by trained personnel who underwent both clinical and research training for the diagnostic instruments and achieved reliability in the administration of both ADOS and ADI-R.
2.3. Data acquisition
Imaging data were acquired on a 3 T Siemens Trio System (Siemens, Erlangen, Germany) using a 12-channel array coil and an imaging protocol that included anatomical T1 and T2 weighted and diffusion images. Field map data co-planar with the diffusion acquisition was also obtained to allow for correction of distortions from B0-field inhomogeneities in the diffusion images. Diffusion data was obtained using a twice-refocused spin echo Echo Planar Imaging sequence (Reese et al., 2003), which has been shown to significantly reduce eddy current distortions. Parallel Imaging with a Grappa factor of 2, and 24 reference lines was employed. Between 55 and 60 slices were acquired using isotropic voxels (2.3 × 2.3 × 2.3 mm3), a TE of 97 ms, a TR of 8100 ms, and two averages. Diffusion weighted data was obtained for b = 1000 and 2000s/mm2; 12 encoding directions were acquired for b = 1000 s/mm2; 42 encoding directions were acquired for b = 2000s/mm2. In addition to the diffusion weighted images, ten images with b = 0 s/mm2 were also collected.
2.4. Diffusion data processing
Images were corrected for motion and B0 field inhomogeneities using Flirt, Prelude, and Fugue utilities provided as part of the FSL software suite (Smith et al., 2004). All the images acquired were visually inspected for artifacts such as signal dropouts due to CSF pulsations or image blurring due to motion. Slices or volumes found to be affected were excluded from the analyses. In general motion was relatively low and comparable in all control participants and 14 of the autism participants (see Table S1 in the Supplementary material). Either none or at most two volumes were excluded for these participants, from a total of 118 volumes acquired in each participant. Since data was acquired using two averages, the removal of one-two volumes should have a negligible effect on the final calculation (i.e., data for all the encoding directions (n = 54), which were themselves in excess of the minimum number required (n = 21 (Lu et al., 2006)), were available for these subjects). However, motion was most severe in two of the autism participants, with ~ 12% of data excluded for both subjects. In order to evaluate if these two data sets impacted our results we analyzed the data without including these two subjects in the analyses. Since results were very similar to the ones obtained when all subjects were included (see Supplementary material), the results presented in the manuscript are for all subjects. Following motion correction, the diffusion encoding acquisition matrix was adjusted for image rotations using a similar approach to the one described by Leemans and Jones (2009).
DKI allows both the estimation of the non-Gaussian water diffusion through measures of kurtosis and the calculation of typical DTI parameters, FA and diffusivity (Jensen and Helpern, 2010). The kurtosis and diffusion tensor and the associated parametric maps were calculated as previously described by Tabesh et al. (2011). In this approach, the diffusion and kurtosis tensor estimation is formulated as a constrained linear least-square problem (CLLS), with constraints imposed such as the diffusivity and kurtosis parameters are physically and biologically plausible. Quadratic programming, using an active-set algorithm implemented in Matlab (Natick, Massachusetts, Mathworks Inc.), was employed to solve the CLLS problem and estimate the tensors (Tabesh et al., 2011). Subsequently, the diffusion tensor data was employed to calculate the three diffusion tensor eigenvalues and derive FA, MD, AD, and RD. Both the diffusion and kurtosis tensor were employed to estimate the faxon and intra- and extra-axonal diffusivities. faxon was estimated at each voxel from the maximal diffusional kurtosis, Kmax, (faxon = Kmax / (Kmax + 3)) (Fieremans et al., 2011). In our approach, Kmax was obtained by evaluating the kurtosis index, K, for 7339 uniformly distributed directions on the unit sphere. Subsequently, intra- and extra-axonal diffusion tensors were obtained from intra and extra-axonal diffusivities along a set of 64 uniformly distributed encoding directions. Each of these diffusivities was estimated using:
| (1) |
| (2) |
where Di and Ki represent the diffusivity and kurtosis coefficients along direction i. Note that Di and Ki along any spatial direction can be readily obtained using established formulas (e.g., (Jensen and Helpern, 2010)). Finally, eigenvalues were obtained for the intra and extra-axonal diffusion tensors and employed to obtain Daxon, ADextra, and RDextra. DTI and DKI parametric maps were calculated using in-house developed software in IDL (Boulder, Colorado, Exelis Visual Information Solutions).
2.5. Statistical analyses
Voxelwise statistical analyses of the diffusion data were carried out using Tract-Based Spatial Statistics (TBSS) (Smith et al., 2006). In a first step, the FA maps of all subjects were aligned into a common space using the nonlinear registration tool Fnirt (Andersson et al., 2007). Next, a population-based mean FA image was created and thinned to create a mean skeleton of the common brain's white matter tracts. Since the two-compartment white matter diffusion model is valid only in homogeneous white matter regions, we restricted our analyses to skeleton regions with FA larger than 0.45. Each subject's diffusion maps were then projected onto this skeleton.
The main measures of interest in the study were faxon, Daxon, RDextra, and ADextra. Secondary analyses examined differences between groups in the DTI metrics (FA, MD, RD, and AD) with the goal of comparing the current study with previous published literature.
Voxelwise between-groups analyses were conducted for each measure of interest using the permutation approach implemented in the Randomize tool with 5000 iterations. Between-groups differences were considered significant at p < 0.05, corrected for multiple comparisons using the Threshold-Free Cluster Enhancement (TFCE) approach (Smith et al., 2007).
Altered white matter tracts were identified using the JHU Fiber Tract Atlas provided with the FSL software package. Quantitative measures for each of the affected tracts were obtained as described before (Jou et al., 2011) by first labeling the white matter skeleton tract regions that were found to significantly differ between groups in their diffusion properties. Using these regions, mean values of the diffusion measures of interest (i.e., measures that were found to significantly differ between groups in the TBSS analyses) were obtained for each tract and subject. For each tract, the group means and standard deviations and the effect size (Cohen d) describing between-groups differences were calculated for each diffusion measure. Logistic regression and Receiver Operating Characteristic (ROC) curve analyses were conducted in order to test the utility of microstructural metrics as diagnostic tools for discriminating between the HFA and TDC individuals. The impact of the white matter deficits on the processing speed was explored by investigating correlations between microstructural measures of each tract in areas of deficit and the DigitSC measure. Correlation analyses were restricted to tracts that showed significant between-groups differences in the TBSS analyses. Bonferroni correction was used to account for multiple comparisons. Correlations were investigated both across groups (with both HFA and TDC participants included in the analyses) and within groups.
3. Results
3.1. Subject demographic and behavioral characterization
There were no significant differences between groups in age, handedness, or education (Table 1). Moreover, there were no significant differences between groups in the Full Scale and Verbal IQ measures. However, Performance IQ was significantly lower in the ASD group (Table 1), primarily driven by differences in the processing speed.
3.2. Imaging data
The TBSS results indicate significantly decreased faxon in the HFA compared to the TDC group in several white matter regions. These regions include the corpus callosum, internal capsule, cortico-spinal tracts, parts of the optic radiations/inferior fronto-occipital/inferior longitudinal fasciculi, temporal superior longitudinal fasciculi, as well as parts of the anterior thalamic radiation and cingulum bundles (Fig. 2a). Significantly decreased Daxon in the HFA group was also noted in some of these regions including corpus callosum, right internal capsule, right cortico-spinal tract, right superior longitudinal fasciculus, and right visual radiations/inferior fronto-occipital/inferior longitudinal fasciculi (Fig. 2b). Decreased ADextra was observed in localized area of the prefrontal corpus callosum (Fig. 2c). No significant between-groups differences were observed for RDextra. Moreover, no significant between-groups differences were found in any of the DTI measures (FA, MD, RD, or AD).
Fig. 2.
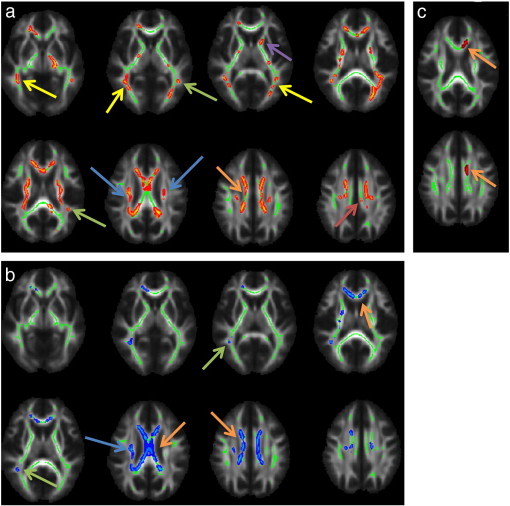
Areas of decreased faxon (a), Daxon (b), and ADextra (c) in High Functioning Autism (HFA) compared to the typically developing (TDC) group (p < 0.05, corrected for multiple comparisons using Threshold-Free Cluster Enhancement (TFCE)). For visualization purposes the skeleton regions with significant differences between groups were thickened using the tbss_fill procedure from the Tract-Based Spatial Statistic (TBSS) software. Arrows indicate: corpus callosum (orange), cortico-spinal tracts (blue), superior longitudinal fasciculi (green), inferior longitudinal fasciculus/inferior fronto-occipital fasciculus/optic radiation (yellow), anterior thalamic radiation (purple), cingulum buldles (red). (For interpretation of the references to color in this figure legend, the reader is referred to the web version of this article.)
Table 2 displays the percentage of voxels with significantly decreased faxon and Daxon for each tract. Table 3 summarizes the mean group faxon and Daxon within the altered tract areas (defined as skeleton areas with significantly decreased faxon). The effect size of the mean difference between groups, the p-values resulting from the logistic regression to assess diagnostic utility, and the Area Under the ROC Curve (AUC) are also displayed in Table 3 for each tract. faxon is found to be a significant discriminator of HFA from TD, with an AUC > .80, for the left cortico-spinal tract and right and left superior longitudinal fasciculi (Table 3 and Fig. 3).
Table 2.
Tract-specific percentage of voxels with significantly decreased faxon or Daxon (relative to the number of voxels included in the analyses).
| Tract | % of voxels with significant difference |
|
|---|---|---|
| faxon | Daxon | |
| Left anterior thalamic radiation | 0.22 | 0.02 |
| Right anterior thalamic radiation | 0.14 | 0.11 |
| Left cortico-spinal tract | 0.22 | 0.00 |
| Right cortico-spinal tract | 0.17 | 0.15 |
| Left cingulum | 0.36 | 0.26 |
| Right cingulum | 0.26 | 0.20 |
| Genu of corpus callosum | 0.15 | 0.00 |
| Splenium of corpus callosum | 0.28 | 0.28 |
| Left inf. fronto-occipital fasciculus | 0.14 | 0.00 |
| Right inf. fronto-occipital fasciculus | 0.24 | 0.10 |
| Left inf. longitudinal fasciculus | 0.18 | 0.00 |
| Right inf. longitudinal fasciculus | 0.16 | 0.03 |
| Left sup. longitudinal fasciculus | 0.26 | 0.00 |
| Right sup. longitudinal fasciculus | 0.12 | 0.12 |
| Left unicinate fasciculus | 0.00 | 0.00 |
| Right uncinate fasciculus | 0.17 | 0.00 |
Table 3.
Tract-specific faxon and Daxon for skeleton regions with significantly altered white matter microstructure are displayed for the typically developing control (TDC) and High Functioning Autism (HFA) groups along with the effect size of the mean difference between groups (Cohen d), the p-values resulting from the logistic regression to assess diagnostic utility, and the Area Under the ROC Curve (AUC).
| Tract | Microstructural metrics (mean ± StDev) |
Cohen d | p-value | AUC | ||
|---|---|---|---|---|---|---|
| TDC | ASD | |||||
| Left anterior thalamic radiation | faxon | 0.43 ± 0.02 | 0.40 ± 0.02 | 1.19 | .008 | .800 |
| Daxon | 0.89 ± 0.07 | 0.82 ± 0.04 | 1.10 | .016 | .757 | |
| Right anterior thalamic radiation | faxon | 0.42 ± 0.03 | 0.39 ± 0.02 | 1.09 | .012 | .794 |
| Daxon | 0.88 ± 0.09 | 0.81 ± 0.05 | 0.88 | .036 | .728 | |
| Left cortico-spinal tract | faxon | 0.46 ± 0.02 | 0.44 ± 0.02 | 1.35 | .005 | .827 |
| Daxon | 0.94 ± 0.07 | 0.87 ± 0.04 | 1.14 | .011 | .798 | |
| Right cortico-spinal tract | faxon | 0.45 ± 0.02 | 0.43 ± 0.02 | 1.16 | .012 | .794 |
| Daxon | 0.90 ± 0.12 | 0.81 ± 0.09 | 0.82 | .046 | .717 | |
| Left cingulum | faxon | 0.43 ± 0.03 | 0.40 ± 0.02 | 0.94 | .023 | .713 |
| Daxon | 0.94 ± 0.06 | 0.89 ± 0.07 | 0.71 | ns | .660 | |
| Right cingulum | faxon | 0.44 ± 0.03 | 0.41 ± 0.02 | 0.97 | .022 | .717 |
| Daxon | 1.01 ± 0.08 | 0.93 ± 0.07 | 0.96 | .024 | .801 | |
| Genu of corpus callosum | faxon | 0.42 ± 0.03 | 0.39 ± 0.02 | 0.98 | .018 | .741 |
| Daxon | 0.98 ± 0.06 | 0.90 ± 0.08 | 1.09 | .013 | .765 | |
| Splenium of corpus callosum | faxon | 0.41 ± 0.04 | 0.39 ± 0.03 | 0.72 | ns | .676 |
| Daxon | 0.98 ± 0.07 | 0.92 ± 0.06 | 0.88 | .031 | .713 | |
| Left inf. fronto-occipital fasciculus | faxon | 0.40 ± 0.02 | 0.38 ± 0.02 | 1.06 | .014 | .770 |
| Daxon | 0.88 ± 0.05 | 0.83 ± 0.05 | 0.92 | .026 | .711 | |
| Right inf. fronto-occipital fasciculus | faxon | 0.39 ± 0.03 | 0.37 ± 0.02 | 0.98 | .018 | .763 |
| Daxon | 0.88 ± 0.07 | 0.83 ± 0.05 | 0.87 | .030 | .730 | |
| Left inf. longitudinal fasciculus | faxon | 0.40 ± 0.02 | 0.38 ± 0.01 | 1.18 | .009 | .790 |
| Daxon | 0.85 ± 0.04 | 0.81 ± 0.03 | 1.02 | .016 | .789 | |
| Right inf. longitudinal fasciculus | faxon | 0.40 ± 0.02 | 0.38 ± 0.02 | 0.89 | .027 | .741 |
| Daxon | 0.86 ± 0.06 | 0.83 ± 0.04 | 0.69 | ns | .684 | |
| Left sup. longitudinal fasciculus | faxon | 0.40 ± 0.02 | 0.38 ± 0.02 | 1.31 | .005 | .829 |
| Daxon | 0.81 ± 0.06 | 0.76 ± 0.05 | 1.00 | .019 | .765 | |
| Right sup. longitudinal fasciculus | faxon | 0.43 ± 0.03 | 0.40 ± 0.02 | 1.24 | .006 | .827 |
| Daxon | 0.83 ± 0.10 | 0.75 ± 0.05 | 0.98 | .024 | .757 | |
| Right uncinate fasciculus | faxon | 0.35 ± 0.02 | 0.33 ± 0.03 | 0.62 | ns | .658 |
| Daxon | 0.75 ± 0.11 | 0.72 ± 0.10 | 0.28 | ns | .561 | |
Fig. 3.
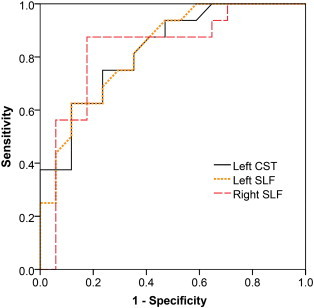
ROC curves describing the diagnostic utility of the faxon values of the left cortico-spinal tract (CST) and right and left superior longitudinal fasciculi (SLF) to discriminate between HFA and TDC individuals.
Correlations with DigitSC were explored for the 15 tracts that were found to have regions with significantly altered faxon and/or Daxon. After Bonferroni correction, correlations were considered significant at p ≤ 0.003. Significant correlations between Daxon and DigitSC were found for ten of the examined tracts (Table 4) with correlations with right cingulum, left inferior fronto-occipital fasciculus, and left inferior and superior longitudinal fasciculi surviving the correction for multiple comparisons. faxon correlated significantly with DigitSC in left inferior fronto-occipital fasciculus and left inferior longitudinal fasciculus. Processing speed correlations were noted both at the entire population level and at group level, although within group correlation followed different patterns for the two groups. Within the HFA group, DigitSC correlated significantly with faxon of the left inferior longitudinal and left fronto-occipital fasciculi. Within the TDC group, DigitSC correlated significantly with Daxon of the right cortico-spinal tract; correlations within this group were also observed for the anterior thalamic radiations, left cortico-spinal tract, and right and left superior longitudinal fasciculi at a cut-off of p = 0.05 but they did not survive the correction for multiple comparisons. Fig. 4 displays the relationship between DigitSC and the faxon of the inferior longitudinal and inferior fronto-occipital fasciculi both within the HFA group and across the entire population.
Table 4.
Correlations between microstructural deficits at tract level and Digit Symbol-Coding (DigitSC). Results are displayed as Spearman rs and the p-value of the correlation (*p < 0.05, **p < 0.003, ns—not significant (p > 0.05)).
| Correlations between microstructural tract properties and processing speed (Digit SC) | Metric | Group |
||
|---|---|---|---|---|
| ASD + TD | ASD | TDC | ||
| Left anterior thalamic radiation | faxon | ns | ns | ns |
| Daxon | ns | ns | .556* (p = 0.021) | |
| Right anterior thalamic radiation | faxon | ns | ns | ns |
| Daxon | .455* (p = .008) | ns | .584*(p = .014) | |
| Left cortico-spinal tract | faxon | ns | ns | ns |
| Daxon | .489* (p = .004) | ns | .644 *(p = .005) | |
| Right cortico-spinal tract | faxon | ns | ns | ns |
| Daxon | .354* (p = .043) | ns | .686 **(p = .002) | |
| Left cingulum | faxon | ns | ns | ns |
| Daxon | .419* (p = .015) | ns | ns | |
| Right cingulum | faxon | ns | ns | ns |
| Daxon | .555 **(p = .001) | ns | ns | |
| Left inf. fronto-occipital fasciculus | faxon | .523** (p = .002) | .713** (p = .002) | ns |
| Daxon | .522** (p = .002) | .500 *(p = .049) | ns | |
| Left inf. longitudinal fasciculus | faxon | .549** (p = .001) | .752** (p = .001) | ns |
| Daxon | .623 **(p = .000) | .516*(p = .041) | ns | |
| Right inf. longitudinal fasciculus | faxon | .362*(p = .039) | ns | ns |
| Daxon | ns | ns | ns | |
| Left sup. longitudinal fasciculus | faxon | .441* (p = .010) | ns | ns |
| Daxon | .496** (p = .003) | ns | .521*(p = .032) | |
| Right sup. longitudinal fasciculus | faxon | .375* (p = .031) | ns | ns |
| Daxon | .430* (p = .013) | ns | .485* (p = 0.049) | |
| Right uncinate fasciculus | faxon | ns | ns | ns |
| Daxon | .474 (p = .005) | ns | ns | |
Fig. 4.
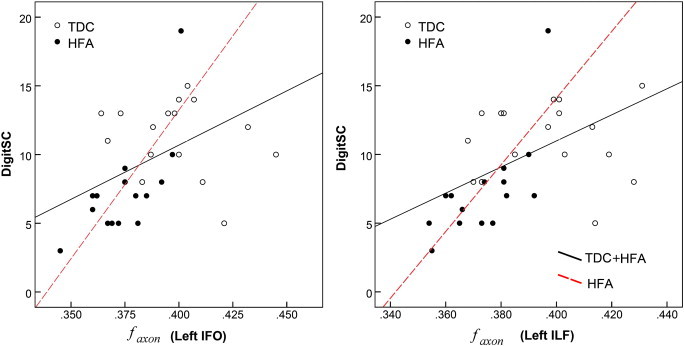
Relationship between DigitSC and faxon values of the (a) left inferior fronto-occipital (IFO) faciculus and (b) left inferior longitudinal (ILF) fasciculus. Significant correlations with DigitSC were found within the High Functioning (HFA) group (red dotted-lines) and across the entire population (black continuous lines). (For interpretation of the references to color in this figure legend, the reader is referred to the web version of this article.)
4. Discussion
In this study we provide evidence of altered white matter diffusion properties in HFA using a two-compartment model of intra and extra-axonal white matter and DKI. A first finding is significantly reduced faxon in HFA in many of the major white matter tracts. As faxon reflects intra-axonal volume, its reduced values in HFA may be the result of either lower axonal density (i.e., reduced number of fibers per unit volume) and/or lower axonal caliber. However, an overall reduced axonal caliber will likely be associated with a pervasive increase in the extra-axonal space and increased RDextra, which was not observed here. Thus, a possible underlying cause of the observed pattern may be reduced axonal density and/or, in line with current hypotheses in the field (Courchesne and Pierce, 2005) and recent histological findings (Zikopoulos and Barbas, 2010), with selective underdevelopment of the large caliber axons and overdevelopment of smaller-caliber axons. Such a configuration is consistent with reduced faxon but is not likely to strongly affect RDextra, consistent with our observations. In fact, using histological methods, Zikopoulos and Barbas (2010) recently reported reduced number of large caliber axons and increased number of small caliber axons in ASD in deep white matter, which is the area that our analyses were focused on here.
Decreased Daxon, which is primarily reflective of intra-axonal diffusion along the axons, was also observed in some of the regions characterized by decreased faxon. Thus, under the hypothesis of reduced number of large caliber axons, it might be a direct reflection of the reduced faxon as small caliber axons are known to have different properties than large caliber ones, including shorter internodal distance, larger number of microtubules, and relatively fewer filaments (Waxman et al., 1995). Possible other mechanisms include alterations in the intra-axonal environment, which contains various microstructures such as microtubules, microfilaments, macromolecules, and membranes. For example, increased density or enlarged mitochondria as well as local disorganization of microfilaments or microtubules would be consistent with reduced Daxon. Similarly, reduced ADextra, which was observed in prefrontal corpus callosum indicates a more restrictive medium along axons and may result from disorganized or more numerous or thicker membranes or component organelles. Finally, the lack of difference in RDextra suggests that the overall axonal packing is not significantly affected in young male adults with HFA. This finding, along with the lack of differences in the overall RD, may reflect a lack of significant differences in the myelin coating of axons, since myelin deficits have been often suggested as a main substrate of differences in radial diffusivity. This relationship, however, has been mostly suggested for pathologies that lack axonal damage (Budde et al., 2009). Thus, data presented here are insufficient to assess this hypothesis. Complementary methods to evaluate myelin (e.g., Magnetic Transfer Ratio) may provide additional data to more definitely define myelin integrity in ASD. Zikopoulos and Barbas (2010) report no differences in myelination between autism and control groups in deep white matter; reduced myelin thickness however was observed in superficial white matter regions. It should be noted that smaller axons typically have thinner myelin; thus myelin deficiencies per se should be observed as more severe loss than expected due to changes in axonal size (Zikopoulos and Barbas, 2010).
Decreased axonal density and/or selective impairment of the large caliber axons as well as altered intra-axonal properties have direct implications for white matter's capacity to conduct information between different brain regions, which is directly demonstrated by this study. As expected, we report a positive correlation between DigitSC and faxon; i.e., increased information processing speed associates with increased axonal volume which agrees with known axon physiology. A positive association was also found between processing speed and Daxon. This finding is consistent with recent reports indicating that axial diffusivity may reflect axonal transport properties (Budde et al., 2009, DeBoy et al., 2007). Given the complex nature of axonal anatomy and physiology as well as the interdependencies between axonal size and intra-axonal and myelin properties, further work will be needed to confirm these hypotheses. The DigitSC test employed in this study requires both motor and visual input and it is likely to involve tracts connecting visual with parietal, temporal, and frontal areas as well as cortico-spinal tracts, which is consistent with results we present here. Interestingly, within group tract association patterns with DigitSC differ between the TDC and HFA groups, which might denote differences in the underlying neural mechanisms; DigitSC performance in the HFA group appears to be primarily related to microstructural properties of the visual and temporal tracts, whereas in the control group it relates more to properties of the motor tracts. Processing speed has recently received renewed focus in the field (Hedvall et al., 2013, Oliveras-Rentas et al., 2012) with studies highlighting its relationship to social functioning and communication.
The relatively extensive areas of white matter that appear to be altered in the autism group suggest a pervasive rather than a localized process. Thus, the relationships between white matter properties and ASD symptoms are likely to be complex. Impairments in inter-hemispherical communication, which may be underlined by atypical white matter in corpus callosum, prominently observed in our data, were recently related to deficits in category processing and local bias, one of the more consistent deficits reported in ASD (Fiebelkorn et al., 2013). Furthermore, impairment of the language-related tracts, the superior longitudinal and inferior occipito-frontal fasciculi (Mandonnet et al., 2007), may impact communication, whose deficits are at the core of the ASD. The inferior occipito-frontal fasciculus along with the optic radiations are also likely to be involved in visual processes, some of which were found to be impaired in autism (McGrath et al., 2013, Zinke et al., 2010). Motor deficits (Stoit et al., 2013) may relate in part to the cortico-spinal tracts abnormalities observed in this study. Finally the other tracts found to display reduced faxon in HFA (e.g., anterior thalamic radiation, cingulum, inferior longitudinal fasciculus) connect key brain areas for attention and social communication (e.g., prefrontal cortex, thalamus, cingulate gyrus, amygdala, and temporal cortex) and have been reported to have atypical white matter microstructure in ASD by several previous studies using DTI (Barnea-Goraly et al., 2004, Cheon et al., 2011, Jou et al., 2011, Shukla et al., 2011). Atypical white matter microstructure may also relate to the atypical functional connectivity noted by previous Functional MRI studies (e.g., (Anderson et al., 2011)) although further work will be needed to understand the exact relationships.
Previous diffusion imaging results in the young adult age group investigated here yielded mixed results, with all of these studies using a DTI approach. In a first report covering a slightly more extended age range than here, that also included some of the adolescence years, late twenties and early thirties, Keller et al. reported FA differences in several white matter regions, including the corpus callosum, internal capsule and forceps minor (Keller et al., 2007). However, Pugliese et al. (2009), Thomas et al. (2011), and Beacher et al. (2012) reported no significant differences in either FA or MD of any white matter region. In a study spanning adolescence and young adult years Kleinhans et al. (2012) found FA differences in the adolescent group but not in the young adult group. Ameis et al. (2011) reported diffusivity differences in children but not in adolescents, with no FA differences noted in either group. Hence, our FA and DTI-based diffusivity results are in agreement with the later studies. However, we further show that white matter microstructural differences do exist in HFA at this age. Thus, metrics tailored to the affected compartment appear to be more sensitive and more specific to microstructural alterations than the typical DTI metrics in the examined population.
Current ASD diagnostic approaches are based solely on behavioral assessments. However, biological-based disease biomarkers would be instrumental for early diagnosis, assessing the treatment and intervention response, and, given the ASD heterogeneity, identifying population subgroups (Uddin et al., 2011). The results presented here suggest that faxon is a promising metric for aiding ASD diagnostic approaches.
Giving the developmental and heterogeneous nature of ASD, it is essential to recognize that the results presented here may be specific to young adults and high functioning end of the spectrum. Most of the DTI studies focused on children have generally showed decreased FA values in ASD (Jou et al., 2011, Travers et al., 2012). This could suggest either more severe axonal deficits than those present in young adults or the existence of additional impairments, such as dysmyelination in children. Extended age range longitudinal studies and studies of autism individuals on the low end of the autism spectrum will be essential in mapping the time course of these changes and understanding the overall ASD pathology. In particular, DKI analyses in younger populations than the one evaluated here may be instrumental in investigating the nature of observed DTI differences and in clarifying some of the inconsistencies of previous findings.
Finally, there are several limitations of this study. First, since the model employed in this study is only valid for highly homogeneous white matter, the more peripheral, superficial, white matter regions that generally have a more complex structure as well as fine tracts affected by partial voluming (e.g., parahippocampal cingulum) were excluded from the analyses. Thus, we were not able to explore these regions' microstructural properties. Second, TBSS's focus on tract skeleton impedes the identification of the affected tract in regions in which several tracts are running in parallel (e.g., the inferior longitudinal fasciculus/inferior occipito-frontal fasciculus/optic radiation area). Future studies will more closely examine the microscopical properties of the individual tracts using White Matter Tractography (Lazar, 2010) techniques. Finally, this study has a relatively small sample size. However, all attempts were made to select a highly homogeneous group of participants (high functioning males), and to restrict the participants' handedness and age range in order to increase group homogeneity.
In conclusion, our data suggest axonal deficits in young adults with HFA, with both reduced axonal volume and altered intra-axonal milieu being observed in many of the major white matter tracts. These axonal deficits appear to be associated with impairments in information processing speed. Larger future studies are needed to confirm these findings and to examine the white matter microstructure in autism across the lifetime.
Conflict of interest statement
The authors have no conflict of interest to disclose.
Acknowledgments
We thank all our participants and their parents and families for their time and effort in participating in the study. We also thank the Global and Regional Asperger Syndrome Partnership (GRASP), Interactive Autism Network (IAN), and Asperger Syndrome and High Functioning Autism Association (AHANY) for their support in advertising the study and recruiting participants. Finally, we thank KellyAnne McGorty, William Fazio, David Mossa, and Kamil Banibaker for their assistance with acquiring the MR data and Els Fieremans for discussions related to the two-compartment model.
This study was funded in part by the National Institutes of Mental Health through NIMH R03-MH076180 award.
Footnotes
Supplementary data to this article can be found online at http://dx.doi.org/10.1016/j.nicl.2014.01.014.
Appendix A. Supplementary data
Supplementary material.
References
- Ameis S.H., Fan J., Rockel C., Voineskos A.N., Lobaugh N.J., Soorya L., Wang A.T., Hollander E., Anagnostou E. Impaired structural connectivity of socio-emotional circuits in autism spectrum disorders: a diffusion tensor imaging study. PLoS One. 2011;6:e28044. doi: 10.1371/journal.pone.0028044. [DOI] [PMC free article] [PubMed] [Google Scholar]
- Anderson J.S., Druzgal T.J., Froehlich A., DuBray M.B., Lange N., Alexander A.L., Abildskov T., Nielsen J.A., Cariello A.N., Cooperrider J.R., Bigler E.D., Lainhart J.E. Decreased interhemispheric functional connectivity in autism. Cereb. Cortex. 2011;21:1134–1146. doi: 10.1093/cercor/bhq190. [DOI] [PMC free article] [PubMed] [Google Scholar]
- Andersson J.L.R., Jenkinson M., Smith S.M. FMRIB technical report TR07JA1. 2007. Non-linear optimisation. (from www.fmrib.ox.ac.uk/analysis/techrep) [Google Scholar]
- Barazany D., Basser P.J., Assaf Y. In vivo measurement of axon diameter distribution in the corpus callosum of rat brain. Brain. 2009;132:1210–1220. doi: 10.1093/brain/awp042. [DOI] [PMC free article] [PubMed] [Google Scholar]
- Barnea-Goraly N., Kwon H., Menon V., Eliez S., Lotspeich L., Reiss A.L. White matter structure in autism: preliminary evidence from diffusion tensor imaging. Biol. Psychiatry. 2004;55:323–326. doi: 10.1016/j.biopsych.2003.10.022. [DOI] [PubMed] [Google Scholar]
- Bastiaansen J.A., Meffert H., Hein S., Huizinga P., Ketelaars C., Pijnenborg M., Bartels A., Minderaa R., Keysers C., de Bildt A. Diagnosing autism spectrum disorders in adults: the use of Autism Diagnostic Observation Schedule (ADOS) module 4. J. Autism Dev. Disord. 2011;41:1256–1266. doi: 10.1007/s10803-010-1157-x. [DOI] [PMC free article] [PubMed] [Google Scholar]
- Beacher F.D., Radulescu E., Minati L., Baron-Cohen S., Lombardo M.V., Lai M.C., Walker A., Howard D., Gray M.A., Harrison N.A., Critchley H.D. Sex differences and autism: brain function during verbal fluency and mental rotation. PLoS One. 2012;7:e38355. doi: 10.1371/journal.pone.0038355. [DOI] [PMC free article] [PubMed] [Google Scholar]
- Belmonte M.K., Cook E.H., Jr., Anderson G.M., Rubenstein J.L., Greenough W.T., Beckel-Mitchener A., Courchesne E., Boulanger L.M., Powell S.B., Levitt P.R., Perry E.K., Jiang Y.H., DeLorey T.M., Tierney E. Autism as a disorder of neural information processing: directions for research and targets for therapy. Mol. Psychiatry. 2004;9:646–663. doi: 10.1038/sj.mp.4001499. [DOI] [PubMed] [Google Scholar]
- Benitez A., Fieremans E., Jensen J.H., Falangola M.F., Tabesh A., Ferris S.H., Helpern J.A. White matter tract integrity metrics reflect the vulnerability of late-myelinating tracts in Alzheimer's disease. NeuroImage Clin. 2013;4:64–71. doi: 10.1016/j.nicl.2013.11.001. [DOI] [PMC free article] [PubMed] [Google Scholar]
- Blumberg S.J., Bramlett M.D., Kogan M.D., Schieve L.A., Jones J.R., Lu M.C. National Health Statistics Reports. National Center for Health Statistics; 2013. Changes in prevalence of parent-reported autism spectrum disorder in school-aged U.S. children: 2007 to 2011–2012. [PubMed] [Google Scholar]
- Budde M.D., Xie M., Cross A.H., Song S.K. Axial diffusivity is the primary correlate of axonal injury in the experimental autoimmune encephalomyelitis spinal cord: a quantitative pixelwise analysis. J. Neurosci. 2009;29:2805–2813. doi: 10.1523/JNEUROSCI.4605-08.2009. [DOI] [PMC free article] [PubMed] [Google Scholar]
- Cheon K.A., Kim Y.S., Oh S.H., Park S.Y., Yoon H.W., Herrington J., Nair A., Koh Y.J., Jang D.P., Kim Y.B., Leventhal B.L., Cho Z.H., Castellanos F.X., Schultz R.T. Involvement of the anterior thalamic radiation in boys with high functioning autism spectrum disorders: a Diffusion Tensor Imaging study. Brain Res. 2011;1417:77–86. doi: 10.1016/j.brainres.2011.08.020. [DOI] [PubMed] [Google Scholar]
- Courchesne E. Brain development in autism: early overgrowth followed by premature arrest of growth. Ment. Retard. Dev. Disabil. Res. Rev. 2004;10:106–111. doi: 10.1002/mrdd.20020. [DOI] [PubMed] [Google Scholar]
- Courchesne E., Pierce K. Why the frontal cortex in autism might be talking only to itself: local over-connectivity but long-distance disconnection. Curr. Opin. Neurobiol. 2005;15:225–230. doi: 10.1016/j.conb.2005.03.001. [DOI] [PubMed] [Google Scholar]
- Crowe S.F., Benedict T., Enrico J., Mancuso N., Mathews C., Wallace J. Cognitive determinants of performance on the Digit Symbol-coding Test, and the Symbol Search Test of the WAIS-III, and the Symbol Digit Modalities Test. Aust. Psychol. 1999;34:204–210. [Google Scholar]
- De Santis S., Assaf Y., Jones D.K. Using the biophysical CHARMED model to elucidate the underpinnings of contrast in diffusional kurtosis analysis of diffusion-weighted MRI. MAGMA. 2012;25:267–276. doi: 10.1007/s10334-011-0292-5. [DOI] [PubMed] [Google Scholar]
- DeBoy C.A., Zhang J., Dike S., Shats I., Jones M., Reich D.S., Mori S., Nguyen T., Rothstein B., Miller R.H., Griffin J.T., Kerr D.A., Calabresi P.A. High resolution diffusion tensor imaging of axonal damage in focal inflammatory and demyelinating lesions in rat spinal cord. Brain. 2007;130:2199–2210. doi: 10.1093/brain/awm122. [DOI] [PubMed] [Google Scholar]
- Fiebelkorn I.C., Foxe J.J., McCourt M.E., Dumas K.N., Molholm S. Atypical category processing and hemispheric asymmetries in high-functioning children with autism: Revealed through high-density EEG mapping. Cortex. 2013;49(5):1259–1267. doi: 10.1016/j.cortex.2012.04.007. [DOI] [PMC free article] [PubMed] [Google Scholar]
- Fieremans E., Jensen J.H., Helpern J.A. White matter characterization with diffusional kurtosis imaging. NeuroImage. 2011;58:177–188. doi: 10.1016/j.neuroimage.2011.06.006. [DOI] [PMC free article] [PubMed] [Google Scholar]
- Fieremans E., Jensen J.H., Helper J.A., Kim S., Grossman R.I., Inglese M., Novikov D.S. The 20th Annual Meeting International Society of Magnetic Resonance in Medicine, Melbourne, Australia. 2012. Diffusion distinguishes between axonal loss and demyelination in brain white matter; p. 465. [Google Scholar]
- Fieremans E., Benitez A., Jensen J.H., Falangola M.F., Tabesh A., Deardorff R.L., Spampinato M.V., Babb J.S., Novikov D.S., Ferris S.H., Helpern J.A. Novel white matter tract integrity metrics sensitive to alzheimer disease progression. AJNR Am. J. Neuroradiol. 2013;34(11):2105–2112. doi: 10.3174/ajnr.A3553. [DOI] [PMC free article] [PubMed] [Google Scholar]
- Gotham K., Risi S., Pickles A., Lord C. The Autism Diagnostic Observation Schedule: revised algorithms for improved diagnostic validity. J. Autism Dev. Disord. 2007;37:613–627. doi: 10.1007/s10803-006-0280-1. [DOI] [PubMed] [Google Scholar]
- Hedvall A., Fernell E., Holm A., Asberg Johnels J., Gillberg C., Billstedt E. Autism, processing speed, and adaptive functioning in preschool children. ScientificWorldJournal. 2013;2013:158263. doi: 10.1155/2013/158263. [DOI] [PMC free article] [PubMed] [Google Scholar]
- Hui E.S., Fieremans E., Jensen J.H., Tabesh A., Feng W., Bonilha L., Spampinato M.V., Adams R., Helpern J.A. Stroke assessment with diffusional kurtosis imaging. Stroke. 2012;43:2968–2973. doi: 10.1161/STROKEAHA.112.657742. [DOI] [PMC free article] [PubMed] [Google Scholar]
- Jensen J.H., Helpern J.A. MRI quantification of non-Gaussian water diffusion by kurtosis analysis. NMR Biomed. 2010;23:698–710. doi: 10.1002/nbm.1518. [DOI] [PMC free article] [PubMed] [Google Scholar]
- Jou R.J., Mateljevic N., Kaiser M.D., Sugrue D.R., Volkmar F.R., Pelphrey K.A. Structural neural phenotype of autism: preliminary evidence from a diffusion tensor imaging study using tract-based spatial statistics. AJNR Am. J. Neuroradiol. 2011;32:1607–1613. doi: 10.3174/ajnr.A2558. [DOI] [PMC free article] [PubMed] [Google Scholar]
- Just M.A., Cherkassky V.L., Keller T.A., Kana R.K., Minshew N.J. Functional and anatomical cortical underconnectivity in autism: evidence from an FMRI study of an executive function task and corpus callosum morphometry. Cereb. Cortex. 2007;17:951–961. doi: 10.1093/cercor/bhl006. [DOI] [PMC free article] [PubMed] [Google Scholar]
- Keller T.A., Kana R.K., Just M.A. A developmental study of the structural integrity of white matter in autism. Neuroreport. 2007;18:23–27. doi: 10.1097/01.wnr.0000239965.21685.99. [DOI] [PubMed] [Google Scholar]
- Kleinhans N.M., Pauley G., Richards T., Neuhaus E., Martin N., Corrigan N.M., Shaw D.W., Estes A., Dager S.R. Age-related abnormalities in white matter microstructure in autism spectrum disorders. Brain Res. 2012;1479:1–16. doi: 10.1016/j.brainres.2012.07.056. [DOI] [PMC free article] [PubMed] [Google Scholar]
- Lazar M. Mapping brain anatomical connectivity using white matter tractography. NMR Biomed. 2010;23:821–835. doi: 10.1002/nbm.1579. [DOI] [PMC free article] [PubMed] [Google Scholar]
- Lazar M., Malaspina D., Miles L., Golestani A.M., Peccerelli N. Annual Meeting of the International Society for Magnetic Resonance in Medicine, Salt Lake City, Utah. 2013. Altered white matter myelination in chronic schizophrenia. [Google Scholar]
- Leemans A., Jones D.K. The B-matrix must be rotated when correcting for subject motion in DTI data. Magn. Reson. Med. 2009;61:1336–1349. doi: 10.1002/mrm.21890. [DOI] [PubMed] [Google Scholar]
- Lord C., Rutter M., Le Couteur A. Autism Diagnostic Interview-Revised: a revised version of a diagnostic interview for caregivers of individuals with possible pervasive developmental disorders. J. Autism Dev. Disord. 1994;24:659–685. doi: 10.1007/BF02172145. [DOI] [PubMed] [Google Scholar]
- Lord C., Risi S., Lambrecht L., Cook E.H., Jr., Leventhal B.L., DiLavore P.C., Pickles A., Rutter M. The autism diagnostic observation schedule-generic: a standard measure of social and communication deficits associated with the spectrum of autism. J. Autism Dev. Disord. 2000;30:205–223. [PubMed] [Google Scholar]
- Lu H., Jensen J.H., Ramani A., Helpern J.A. Three-dimensional characterization of non-gaussian water diffusion in humans using diffusion kurtosis imaging. NMR Biomed. 2006;19:236–247. doi: 10.1002/nbm.1020. [DOI] [PubMed] [Google Scholar]
- Mandonnet E., Nouet A., Gatignol P., Capelle L., Duffau H. Does the left inferior longitudinal fasciculus play a role in language? A brain stimulation study. Brain. 2007;130:623–629. doi: 10.1093/brain/awl361. [DOI] [PubMed] [Google Scholar]
- McGrath J., Johnson K., O'Hanlon E., Garavan H., Gallagher L., Leemans A. White matter and visuospatial processing in autism: a constrained spherical deconvolution tractography study. Autism Res. 2013;6(5):307–319. doi: 10.1002/aur.1290. [DOI] [PubMed] [Google Scholar]
- Oliveras-Rentas R.E., Kenworthy L., Roberson R.B., III, Martin A., Wallace G.L. WISC-IV profile in high-functioning autism spectrum disorders: impaired processing speed is associated with increased autism communication symptoms and decreased adaptive communication abilities. J. Autism Dev. Disord. 2012;42:655–664. doi: 10.1007/s10803-011-1289-7. [DOI] [PMC free article] [PubMed] [Google Scholar]
- Panagiotaki E., Schneider T., Siow B., Hall M.G., Lythgoe M.F., Alexander D.C. Compartment models of the diffusion MR signal in brain white matter: a taxonomy and comparison. NeuroImage. 2012;59:2241–2254. doi: 10.1016/j.neuroimage.2011.09.081. [DOI] [PubMed] [Google Scholar]
- Pugliese L., Catani M., Ameis S., Dell'Acqua F., Thiebaut de Schotten M., Murphy C., Robertson D., Deeley Q., Daly E., Murphy D.G. The anatomy of extended limbic pathways in Asperger syndrome: a preliminary diffusion tensor imaging tractography study. NeuroImage. 2009;47:427–434. doi: 10.1016/j.neuroimage.2009.05.014. [DOI] [PubMed] [Google Scholar]
- Reese T.G., Heid O., Weisskoff R.M., Wedeen V.J. Reduction of eddy-current-induced distortion in diffusion MRI using a twice-refocused spin echo. Magn. Reson. Med. 2003;49:177–182. doi: 10.1002/mrm.10308. [DOI] [PubMed] [Google Scholar]
- Roberts T.P., Cannon K.M., Tavabi K., Blaskey L., Khan S.Y., Monroe J.F., Qasmieh S., Levy S.E., Edgar J.C. Auditory magnetic mismatch field latency: a biomarker for language impairment in autism. Biol. Psychiatry. 2011;70:263–269. doi: 10.1016/j.biopsych.2011.01.015. [DOI] [PMC free article] [PubMed] [Google Scholar]
- Royer F.L. Information processing of visual figures in the Digit Symbol Substitution Task. J. Exp. Psychol. 1971;87:335–342. [Google Scholar]
- Shukla D.K., Keehn B., Muller R.A. Tract-specific analyses of diffusion tensor imaging show widespread white matter compromise in autism spectrum disorder. J. Child Psychol. Psychiatry. 2011;52:286–295. doi: 10.1111/j.1469-7610.2010.02342.x. [DOI] [PMC free article] [PubMed] [Google Scholar]
- Smith S.M., Jenkinson M., Woolrich M.W., Beckmann C.F., Behrens T.E., Johansen-Berg H., Bannister P.R., De Luca M., Drobnjak I., Flitney D.E., Niazy R.K., Saunders J., Vickers J., Zhang Y., De Stefano N., Brady J.M., Matthews P.M. Advances in functional and structural MR image analysis and implementation as FSL. NeuroImage. 2004;23(Suppl. 1):S208–S219. doi: 10.1016/j.neuroimage.2004.07.051. [DOI] [PubMed] [Google Scholar]
- Smith S.M., Jenkinson M., Johansen-Berg H., Rueckert D., Nichols T.E., Mackay C.E., Watkins K.E., Ciccarelli O., Cader M.Z., Matthews P.M., Behrens T.E. Tract-based spatial statistics: voxelwise analysis of multi-subject diffusion data. NeuroImage. 2006;31:1487–1505. doi: 10.1016/j.neuroimage.2006.02.024. [DOI] [PubMed] [Google Scholar]
- Smith S.M., Johansen-Berg H., Jenkinson M., Rueckert D., Nichols T.E., Miller K.L., Robson M.D., Jones D.K., Klein J.C., Bartsch A.J., Behrens T.E. Acquisition and voxelwise analysis of multi-subject diffusion data with tract-based spatial statistics. Nat. Protoc. 2007;2:499–503. doi: 10.1038/nprot.2007.45. [DOI] [PubMed] [Google Scholar]
- Stoit A.M., van Schie H.T., Slaats-Willemse D.I., Buitelaar J.K. Grasping Motor Impairments in Autism: Not Action Planning but Movement Execution is Deficient. J. Autism Dev. Disord. 2013;43(12):2793–2806. doi: 10.1007/s10803-013-1825-8. [DOI] [PubMed] [Google Scholar]
- Tabesh A., Jensen J.H., Ardekani B.A., Helpern J.A. Estimation of tensors and tensor-derived measures in diffusional kurtosis imaging. Magn. Reson. Med. 2011;65:823–836. doi: 10.1002/mrm.22655. [DOI] [PMC free article] [PubMed] [Google Scholar]
- Tager-Flusberg H. The origins of social impairments in autism spectrum disorder: studies of infants at risk. Neural Netw. 2010;23:1072–1076. doi: 10.1016/j.neunet.2010.07.008. [DOI] [PMC free article] [PubMed] [Google Scholar]
- Thomas C., Humphreys K., Jung K.J., Minshew N., Behrmann M. The anatomy of the callosal and visual-association pathways in high-functioning autism: a DTI tractography study. Cortex. 2011;47:863–873. doi: 10.1016/j.cortex.2010.07.006. [DOI] [PMC free article] [PubMed] [Google Scholar]
- Travers B.G., Adluru N., Ennis C., Tromp do P.M., Destiche D., Doran S., Bigler E.D., Lange N., Lainhart J.E., Alexander A.L. Diffusion tensor imaging in autism spectrum disorder: a review. Autism Res. 2012;5:289–313. doi: 10.1002/aur.1243. [DOI] [PMC free article] [PubMed] [Google Scholar]
- Uddin L.Q., Menon V., Young C.B., Ryali S., Chen T., Khouzam A., Minshew N.J., Hardan A.Y. Multivariate searchlight classification of structural magnetic resonance imaging in children and adolescents with autism. Biol. Psychiatry. 2011;70:833–841. doi: 10.1016/j.biopsych.2011.07.014. [DOI] [PMC free article] [PubMed] [Google Scholar]
- Walker L., Gozzi M., Lenroot R., Thurm A., Behseta B., Swedo S., Pierpaoli C. Diffusion tensor imaging in young children with autism: biological effects and potential confounds. Biol. Psychiatry. 2012;72:1043–1051. doi: 10.1016/j.biopsych.2012.08.001. [DOI] [PMC free article] [PubMed] [Google Scholar]
- Waxman S.G., Kocsis J.D., Stys P.K. Oxford University Press; New York: 1995. The Axon: Structure, Function, and Pathophysiology. [Google Scholar]
- Wolff J.J., Gu H., Gerig G., Elison J.T., Styner M., Gouttard S., Botteron K.N., Dager S.R., Dawson G., Estes A.M., Evans A.C., Hazlett H.C., Kostopoulos P., McKinstry R.C., Paterson S.J., Schultz R.T., Zwaigenbaum L., Piven J. Differences in white matter fiber tract development present from 6 to 24 months in infants with autism. Am. J. Psychiatry. 2012;169:589–600. doi: 10.1176/appi.ajp.2011.11091447. [DOI] [PMC free article] [PubMed] [Google Scholar]
- Zikopoulos B., Barbas H. Changes in prefrontal axons may disrupt the network in autism. J. Neurosci. 2010;30:14595–14609. doi: 10.1523/JNEUROSCI.2257-10.2010. [DOI] [PMC free article] [PubMed] [Google Scholar]
- Zinke K., Fries E., Altgassen M., Kirschbaum C., Dettenborn L., Kliegel M. Visuospatial short-term memory explains deficits in tower task planning in high-functioning children with autism spectrum disorder. Child Neuropsychol. 2010;16:229–241. doi: 10.1080/09297040903559648. [DOI] [PubMed] [Google Scholar]
Associated Data
This section collects any data citations, data availability statements, or supplementary materials included in this article.
Supplementary Materials
Supplementary material.