Abstract
Cardiolipin (CL) is a unique phospholipid found in mitochondrial inner membrane. It is a key component for mitochondrial function in both respiration and apoptosis. The level of CL is an important parameter for investigating these intracellular events and is a critical indicator of a number of diseases associated with mitochondrial respiratory functions. 10-Nonyl acridine orange (NAO) is the only fluorescent dye currently available for CL detection. However, the performance of NAO is far from satisfactory in terms of selectivity and sensitivity. In this work, we report an aggregation-induced emission-active fluorogen, TTAPE-Me, for CL detection and quantification. With improved sensitivity and excellent selectivity to CL over other major mitochondrial membrane lipids, TTAPE-Me could serve as a valuable fluorescent sensor for CL quantification. The use of TTAPE-Me for the quantification of isolated mitochondria is also demonstrated.
Introduction
Eukaryotic cells use ∼5% of their genes to synthesize lipids.1 Such heavy portion is invested because of the indispensable functions of lipids in cells. With their unique structures, lipids form bilayers to segregate the internal constituents from the extracellular environment as well as to compartmentalize discrete organelles.1 In addition to their barrier function, lipids are also used for energy storage in lipid droplets and as messengers in signal transduction and molecular recognition processes.1,2
Cardiolipin (CL) is a diphosphatidylglycerol lipid exclusively found in the mitochondrial inner membrane.3 This unique lipid consists of four unsaturated acyl chains and a polar head with two negative charges (Figure 1). CL regulates enzymatic activities involved in electron transport and oxidative phosphorylation.4 An interaction of CL with cytochrome c (cyt c) activates the peroxidase activity of the protein and triggers the mitochondria-mediated apoptosis.3,5-12 During apoptosis, the distribution of CL changes, which consequently affects ATP synthesis in mitochondria.11 Meanwhile, the level of CL is decreasing during apoptosis, in a time-dependent manner correlated with the release of cyt c to the cytosol and the generation of reactive oxygen species.13-15 In addition to its important role in the apoptosis pathway, the level of CL is also of clinical significance. The depletion of CL is a critical indicator of aging, Barth syndrome, and a number of diseases associated with mitochondrial respiratory function including heart ischemia, reperfusion, gliomas, and cardiac hypertrophy and failure.16 Tangier disease, on the other hand, is caused by the enhanced production of CL.17 It has also been reported that Parkinson's disease, HIV-1, and cancers are associated with the abnormalities of CL.14 Therefore, it is highly important to develop effective methods for the detection and quantification of CL.
Figure 1.
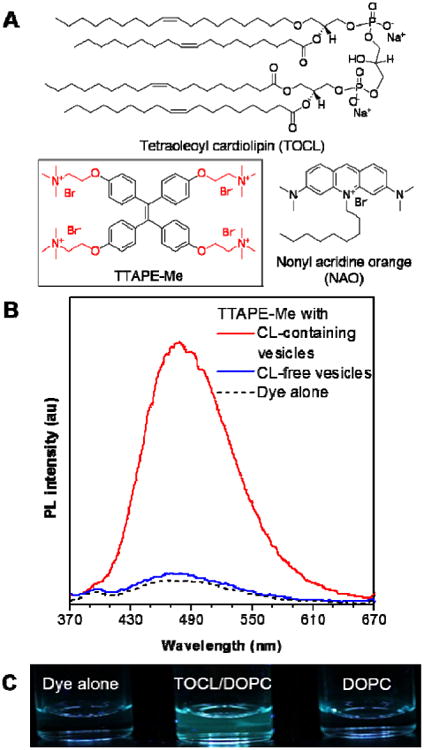
(A) Chemical structures of TOCL, TTAPE-Me and NAO. (B) Emission spectra and (C) the corresponding fluorescence photographs of TTAPE-Me solutions in the absence and presence of vesicles, with and without CL. CL-containing and CL-free vesicles are composed of TOCL/DOPC (1:1 molar ratio, CL-containing) and pure DOPC (CL-free), respectively, in a 25 mM HEPES buffer at pH 7.4. [dye] = 10 μM; [lipid]total = 22 μM; λex = 350 nm.
However, specific detection of CL among numerous phospholipids is not trivial. Lipidomics profiling by high-resolution LC-MS has recently been developed for quantitative analysis of CL.18 This powerful method requires sophisticated instrumentation and experienced operators, which limit the scope of its application. Optical detection by fluorescence, on the other hand, is a relatively simple and accessible method while providing superior sensitivity.19 A fluorescent dye, 10–N–nonyl acridine orange (NAO, Figure 1), was introduced for CL detection and mitochondria staining in the early 1980s.20 The green fluorescence of NAO is decreased in the presence of CL. The quantification of CL by NAO, however, is not realistic because both the excitation and emission maxima are dependent on the dye concentration; the linear relationship can be established only when the NAO/CL molar ratio is equal to 2.21 To quantify mitochondria with NAO, tortuous steps are involved, including mitochondria fixation, long time incubation and centrifugation.20 Furthermore, NAO suffer from small Stoke shift and poor water-solubility, making them less appealing to be used in biological systems. The working mechanism of NAO is still not clear and the performance is difficult to improve even through different approaches.20-23 Although NAO has numerous drawbacks mentioned above, it has been used for so many years, even without a standard protocol, because no alternative has been developed so far.
In our search of alternatives, luminogens with aggregation-induced emission (AIE) characteristics have attracted our attention.24-26 Opposite to conventional dyes, the AIE luminogens are non-emissive when molecularly dissolved but become highly fluorescent in the aggregate state owing to the restriction of their intramolecular motions.27-31 Inspired by the specific interaction of cyt c with CL, in this work, we have designed and synthesized (Scheme S1) a positively charged AIE fluorogen, 1,1,2,2-tetrakis[4-(2-trimethylammonioethoxy)phenyl]ethene tetrabromide (TTAPE-Me, Figure 1) for CL detection.32 This dye turns on its fluorescence upon binding to CL containing membranes, which may enable the detection and quantification of CL.
Experimental Details
Materials and Methods
THF (Labscan) was purified by simple distillation from sodium benzophenone ketyl under nitrogen immediately before use. Trimethylamine was purchased from Aldrich and used as received. BSPOTPE were prepared according to our previously published procedures.33 Synthetic lipids, DOPC (1,2-dioleoyl-sn-glycero-4-phosphocholine), TOCL (1,1′,2,2′-tetraoleoyl cardiolipin), DOPS (1,2-dioleoyl-sn-glycero-3-phospho-L-serine (sodium salt)), DPPE (1,2-dipalmitoleoyl-sn-glycero-3-phosphoethanolamine) and soy PI (L-α-phosphatidylinositol (Soy) (sodium salt)) were purchased from Avanti Polar Lipids, Inc. (Alabaster, AL). SM (N-hexanoyl-D-sphingomyelin) was purchased from Sigma. Acridine Orange 10-Nonyl Bromide (nonyl Acridine Orange) was purchased from Molecular Probes®, Invitrogen. pUC 18 DNA, plasmids, was purchased from Takara Bio Inc.. Water was purified by a Millipore filtration system. All the experiments were performed at room temperature unless otherwise specified. 1H and 13C NMR spectra were measured on a Bruker ARX 300 spectrometer in D2O. Mass spectra were recorded on a Finnigan TSQ 7000 triple quadrupole spectrometer operating in fast-atom bombardment (FAB) mode or a GCT Premier CAB 048 mass spectrometer operated in MALDI-TOF mode. Steady-state fluorescence spectra were recorded on a Perkin-Elmer LS 55 spectrofluorometer with a Xenon discharge lamp excitation. Particle size analysis was determined at room temperature by a Zeta Potential Analyzer (ZetaPALS, Zeta Potential Analyzer Utilizing Phase Analysis Light Scattering; Brookhaven Instruments Corporation, USA).
Preparation of Liposomes (Large Unilamellar Vesicles, LUVs)
Chloroform stocks of different lipids (10 mg/mL) was mixed in a desired molar ratio and dried under a stream of nitrogen gas. The lipid film was hydrated in a 25 mM HEPES buffer, pH 7.4, to a final lipid concentration of 2.2 mM. The lipids mixtures were incubated at 37 °C for 30 min and followed by bath sonication for 1 h. The LUVs were obtained by extruding 11 times through a 100 nm pore size polycarbonate filters (SPI-Pore) at 50°C on a pre-warmed lipid extruder.
Isolation of Yeast Mitochondria
Wild-type Saccharomyces cerevisiae (YPH 500) cells were cultured in Yeast Extract Peptone Dextrose medium (YPD; 2% bactopeptone, 1% yeast extract and 2% glucose) to an OD of 2.0 and mitochondria were isolated according to the mitochondria preparation protocol by Meisinger, Pfanner, and Truscott.34 YPH 500 cells were harvested by centrifugation (5 min at 3,000× g) and resuspended in pre-warmed DTT buffer (100 mM H2SO4, 10 mM DTT, pH 9.4) at 30 °C for 20 min. The cells pellets were resuspended and incubated with 2.5 mg Zymolyase-20T per gram wet cell paste in Zymolyase buffer (1.2 M sorbitol, 20 mM potassium phosphate, pH 7.4) for 1 h under shaking at room temperature. Homogenization of spheroblasts was performed by 15 strokes on ice with 40 mL tight glass douncer (Kontes) in homogenization buffer (0.6 M sorbitol, 10 mM Tris-HCl, pH 7.4, 1 mM EDTA, 1 mM PMSF, 0.2 % BSA). Mitochondria were finally resuspended in SEM buffer (250 mM sucrose, 1 mM EDTA, 10 mM MOPS-KOH, pH 7.2) at final concentration of ∼5 mg/mL. The protein content was determined by a Biuret procedure using bovine serum albumin as a standard.35
Isothermal Titration Calorimetry Measurements
Calorimetric titration experiments were performed at (25.00±0.01) °C on a MicroCal VP-ITC apparatus. Lipid vesicle solutions for the ITC experiments were prepared in 25 mM HEPES buffer solutions at pH 7.4. For a typical titration, a series of 5 μL aliquots of TTAPE-Me solution were injected into the lipid vesicle solution at a 150 s interval. The heat for each injection was determined by the integration of the peak area in the thermogram with respect to time. Blank titration was conducted by injecting TTAPE-Me into the sample cell containing only buffer solution under the same conditions. The interaction heat was corrected by subtracting the blank heat from that for the TTAPE/lipid vesicle titration. The binding constants were derived by fitting the isotherm curves with Origin 7.0 software.
Results and Discussion
With the aid of the quaternary ammonium substituents, TTAPE-Me is completely soluble and thus non-fluorescent in aqueous solution, in accord with the general property of AIE luminogens.24 To determine whether TTAPE-Me can specifically detect CL, we prepare two types of large unilamellar vesicles (LUVs, 100-200 nm in diameter, Figure S1). The CL-free vesicles were prepared by pure 1,2-dioleoyl-sn-glycero-4-phosphocholine (DOPC, Chart S1), which is the most abundant phospholipid in eukaryotic membranes. CL-containing vesicles were fabricated by the mixture of 1,1′,2,2′-tetraoleoyl cardiolipin (TOCL, Figure 1) and DOPC, in which the zwitterionic DOPC is used to stabilize the vesicles. As shown in Figure 1, the emission of TTAPE-Me is turned on in the presence of CL-containing vesicles.
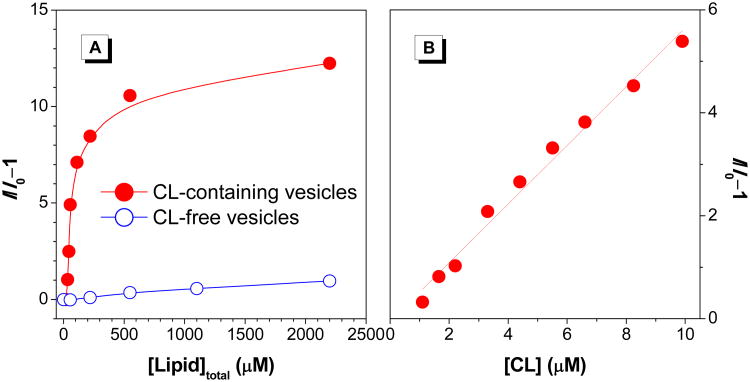
The fluorescence of TTAPE-Me increases dramatically upon the increase of the total lipid concentration of the CL-containing vesicles, while with the CL-free vesicles, the emission of TTAPE-Me remains rather weak (Figure 2A). The fluorescence enhancement (I/I0-1) of TTAPE-Me at 480 nm is in a linear fashion in the CL concentration of 0–10 μM (Figure 2B), which lies in the physiological range of CL in mitochondrial membrane.21 Linear detection of CL can also be obtained with the varying content of TOCL in the vesicles (Figure S2, 2–50% TOCL). The results imply that flexible TTAPE-Me to CL ratio is allowed in the detection and quantification of CL, in contrast to the conventional NAO which requires strict 2:1 ratio of NAO/CL for quantitative measurement. Moreover, the detection of CL can be done immediately upon mixing the vesicles with the probe without any extra treatment.
Figure 2.
(A) Plot of the fluorescence enhancement (I/I0−1) of TTAPE-Me at 480 nm with CL-containing and CL-free vesicles. (B) Linear region of the I/I0−1 value versus CL concentration. [dye] = 10 μM; λex = 350 nm.
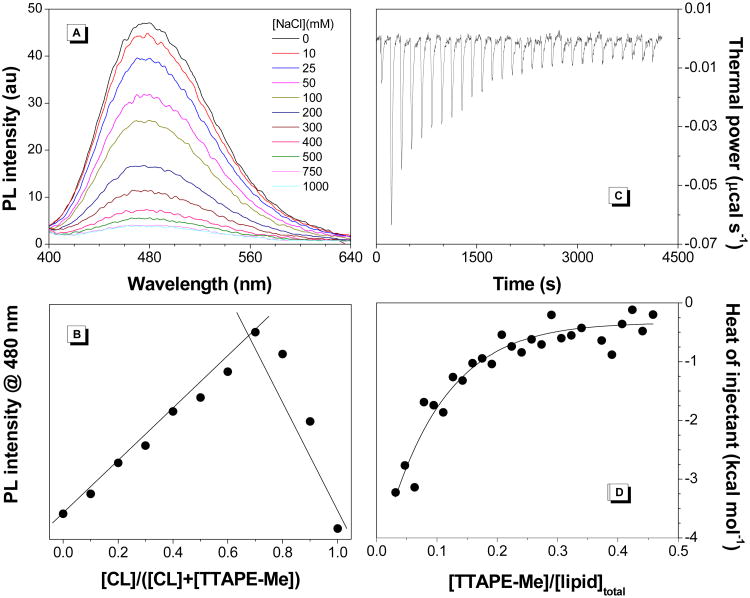
TTAPE-Me is amphiphilic with the hydrophobic core of tetraphenylethene (TPE) and four quaternized ammonium moieties to promote its water affinity. Initially, we speculate that both hydrophobic and electrostatic interactions might contribute to the interaction of TTAPE-Me and CL. As Figure 3A shows ionic strength indeed affects the fluorescence intensity of TTAPE-Me. With the increase of NaCl concentration, the fluorescence of the dye diminishes, which confirms that TTAPE-Me binds to CL via electrostatic attraction. The Na+ ions compete with the bound dye molecules. Once the dye is released into solution, the intramolecular motions are no longer restricted and the fluorescence is turned off. Because both CL and DOPC contain long alkyl chains while TTAPE-Me binds to CL only, the role of hydrophobic interactions is less significant. Furthermore, there is no any significant changes in fluorescence intensity of TTAPE-Me even after one and a half hour incubation with CL-containing LUVs (Figure S3). As a control, another water-soluble AIE luminogen, BSPOTPE, with two negative charges, is used, which exhibits no remarkable fluorescence enhancement with CL-containing vesicles (Figure S4).
Figure 3.
(A) Emission spectra of TTAPE-Me with CL-containing vesicles in the presence of varying concentrations of NaCl. [dye] = 10 μM; [lipid]total = 22 μM; λex = 350 nm. (B) Job plot for determination of the binding stoichiometry of TTAPE-Me to CL-containing vesicles. The total concentration of TTAPE-Me and CL is kept at 20 μM. (C) Calorimetric curves at 25 °C for titration of CL-containing vesicles with serial injections of TTAPE-Me. (D) Binding isotherm as a function of [TTAPE-Me]/[lipid]total molar ratio. CL-containing vesicles are composed of TOCL and DOPC (1:1 molar ratio).
According to the AIE principle,25 only the bound TTAPE-Me is fluorescent, and thus the fluorescence can report the binding of TTAPE-Me to CL-containing vesicles. The emission intensity at varying ratios of TTAPE-Me to CL-containing LUVs is then recorded and correlated as shown in Figure 3B. The Job plot has a peak at ∼0.67, corresponding to a 2:1 binding ratio for TOCL to TTAPE-Me. The binding ratio perfectly matches their charge ratio, further supporting that the binding of TTAPE-Me towards CL is primarily driven by electrostatic interactions. To determine how strong the affinity is, we have employed isothermal titration calorimetry (ITC). The result in Figure 3C indicates that the interaction of TTAPE-Me to CL is an exothermic process. Integration of the area of each injection peak followed by the subtraction of the dilution heat of dye molecules generated the binding curve (Figure 3D). Fitting of the curve gave a dissociation constant of 2.08 × 10⁻⁶ M.
To further evaluate the specificity of TTAPE-Me towards CL, we have examined the response of TTAPE-Me to other major lipids found on mitochondrial membranes: 1,2-dipalmitoleoyl-sn-glycero-3-phosphoethanolamine (DPPE), L-α-phosphatidylinositol (soy PI), 1,2-dioleoyl-sn-glycero-3-phospho-L-serine (DOPS), and N-hexanoyl-D-sphingomyelin (SM) (Chart S1).32 Six different types of LUVs composed of each of the above lipids as well as TOCL and DOPC at the exact percentage as mitochondrial membrane were fabricated (the rest are filled by DOPC). As can be seen in Figure 4A, the fluorescence of TTAPE-Me is selectively turned on with the TOCL vesicles, while other vesicles with the lipid components at their physiological concentrations do not cause any pronounced change of the fluorescence. Whereas DOPS and PI are also negatively charged, they carry only one charge per molecule and share only 1% and 2% of the total mitochondrial membrane lipids respectively (CL for ∼20%).36 Hence, the presence of such small percentage of DOPS and soy PI do not affect the selectivity and sensitivity of TTAPE-Me for CL detection. Photographs taken under UV illumination clearly show that only TOCL containing vesicles can turn-on the fluorescence of TTAPE-Me (Figure 4A inset). On the other hand, one might think that the negatively charged mitochondrial DNA (mtDNA) may interfere with the detection of CL by TTAPE-Me. However, in our control experiment, we do not observe any fluorescence enhancement of TTAPE-Me in the presence of plasmids, a model for the circular double-stranded mtDNA, at a wide range of concentration (Figure S5), implying the presence of mtDNA would not complicate the CL quantification. The specificity of TTAPE-Me towards CL has also been further investigated by using other charged biomolecules. As shown in Figure S6, the selectivity is not interfered by other charged biomolecules such as CL-free LUVs, charged amino acids and proteins, at the same concentrations.
Figure 4.
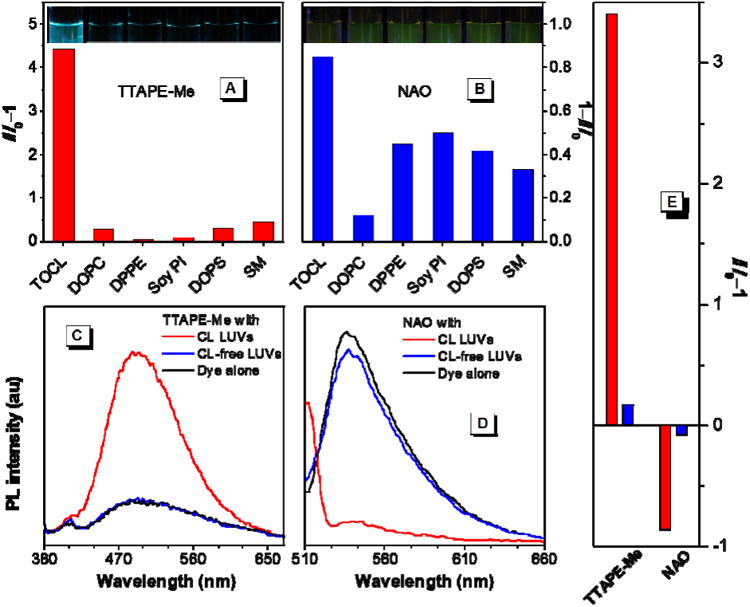
(A,B) Change in fluorescence intensity of (A) TTAPE-Me and (B) NAO with vesicles of different lipid contents (left to right: 20% TOCL, 100% DOPC, 40% DPPE, 2% soy PI, 1% DOPS, and 2% SM; the rest of each type of vesicles is filled by DOPC). Insets: Corresponding fluorescence photographs of TTAPE-Me and NAO solutions in the presence of these LUVs. (C,D) Emission spectra of (C) TTAPE-Me and (D) NAO with CL-containing and CL-free all-component vesicles. (E) Bar chart of the change in fluorescence intensity shown in panels C and D (red: CL-containing vesicles, blue: CL-free vesicles). [dye] = 10 μM; [lipid]total = 22 μM; for TTAPE-Me, λex = 350 nm, λem = 480 nm; for NAO, λex = 499 nm, λem = 530 nm.
Meanwhile, to mimic the mitochondrial membranes, we have prepared CL-containing and CL-free all-component LUVs, which are composed by the mixture of all the above mentioned lipids at their physiological ratios (Figure S7). With the CL-free all-component LUVs, the emission spectrum of TTAPE-Me remains identical to that of the free dye in buffer, while with CL-containing LUVs, the greenish-blue fluorescence is enhanced by over three-fold (Figure 3C & E). Parallel experiments are conducted with NAO as the probe. NAO is a turn-off sensor whose fluorescence is decreased in the presence of CL (Figure 4D). However, not only CL, other lipids such as DPPE, PI, or DOPS, can also induce the decrease of NAO signals to a large extend (Figure 4B). The decrease of the fluorescence intensity and the change in emission color is difficult to discern by naked eyes (Figure 4B inset).Thus, in addition to its poor selectivity, the sensitivity of NAO is not comparable to that of TTAPE-Me (Figure 4E).21
In addition to CL detection, we demonstrate the utility of TTAPE-Me for mitochondria quantification. Individual mitochondria from S. cerevisiae strain YPH 500 have been isolated and calibrated by Biuret test.22 As shown in Figure 5A, the emission of TTAPE-Me increases linearly with the increase of mitochondria concentration. Isolated mitochondria can be clearly visualized under fluorescence microscope with TTAPE-Me as the stain (Figure 5B & C). These results show that by using TTAPE-Me, quantification of mitochondria can be accomplished in a simple and easy manner with high sensitivity and low background noise. In contrast, time-consuming and intricate procedures are involved when using NAO for the quantification of isolated mitochondria.22 The isolated mitochondria are fixed by formaldehyde, followed by multiple rinsing, centrifugation and resuspension steps. The signal-to-noise ratio of NAO-based detection is much smaller probably due to the strong background of NAO in solution.22
Figure 5.
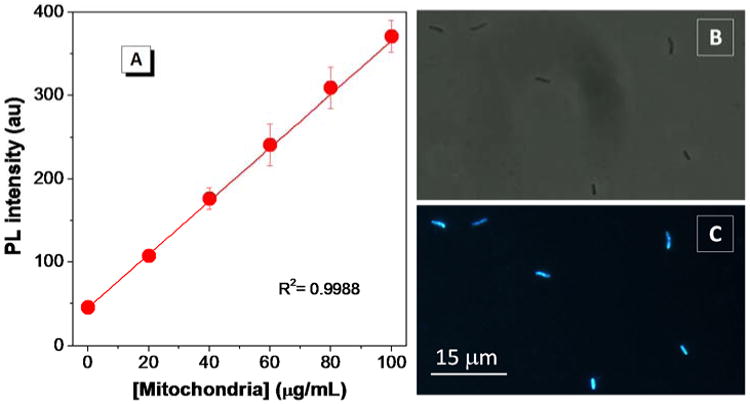
(A) Emission intensity of TTAPE-Me at 480 nm with different amounts of yeast mitochondria in SEM buffer (250 mM sucrose, 1 mM EDTA, 10 mM MOPS-KOH, pH 7.2). Images of TTAPE-Me stained yeast mitochondria were taken (B) under daylight and (C) with UV illumination. [dye] = 10 μM; λex = 350 nm.
Conclusions
In conclusion, a water-soluble AIE fluorogen, TTAPE-Me, has been developed for the detection and quantification of CL, a unique phospholipid in mitochondrial inner membrane. The fluorescence of TTAPE-Me is selectively turned on by CL-containing vesicles and the intensity is proportional to the concentration or fraction of CL. As a fluorescence turn-on sensor, TTAPE-Me can be used for quantitative analysis and visualization of isolated mitochondria. Compared with NAO, the only dye commercially available for CL sensing, TTAPE-Me provides much higher sensitivity and selectivity as well as well-defined working mechanism without any difficult or ambiguous protocols. With these advantages, TTAPE-Me could be a great alternative to NAO for specific detection and quantification of CL, which will find an array of applications in clinical diagnosis and mitochondria-related research.
Supplementary Material
Acknowledgments
This work was partially supported by National Basic Research Program of China (973 Program; 2013CB834701), the Research Grants Council of Hong Kong (HKUST2/CRF/10 and N_HKUST620/11), the University Grants Committee of Hong Kong (AoE/P-03/08), and National Institutes of Health Grants RO1-GM098502 (E.V.P.). B.Z.T. thanks Guangdong Innovative Research Team Program for support (201101C0105067115). We thank Prof. William Dowhan for the yeast strains.
Footnotes
Notes: The authors declare no competing financial interests.
Supporting Information: Synthetic route of TTAPE-Me; Chemical structures of phospholipids; Particle size analysis of LUVs; Emission spectra of TTAPE-Me and BSPOTPE dyed LUVs with different CL contents; Emission spectra of TTAPE-Me with different amount of DNA. This material is available free of charge via the Internet at http://pubs.acs.org.
References
- 1.van Meer G, Voelker DR, Feigenson GW. Nat Rev Mol Cell Biol. 2008;9:112. doi: 10.1038/nrm2330. [DOI] [PMC free article] [PubMed] [Google Scholar]
- 2.Stavru F, Palmer AE, Wang C, Youle RJ, Cossart P. Proc Natl Acad Sci USA. 2013;110:16003. doi: 10.1073/pnas.1315784110. [DOI] [PMC free article] [PubMed] [Google Scholar]
- 3.McMillin JB, Dowhan W. Biochim Biophys Acta. 2002;1585:97. doi: 10.1016/s1388-1981(02)00329-3. [DOI] [PubMed] [Google Scholar]
- 4.Dowhan W, Bogdanov M. Functional Roles of Lipids in Membrane Biochemistry of Lipids, Lipoproteins and Membranes. 4th. Chapter 1. Elsevier Science B. V.; Amsterdam: 2002. p. 1. [Google Scholar]
- 5.Shidoji Y, Hayashi K, Komura S, Ohishi N, Yagi K. Biochem Biophys Res Commun. 1999;264:343. doi: 10.1006/bbrc.1999.1410. [DOI] [PubMed] [Google Scholar]
- 6.Kagan VE, Tyurin VA, Jiang J, Tyurina YY, Ritov VB, Amoscato AA, Osipov AN, Belikova NA, Kapralov AA, Kini V, Vlasova II, Zhao Q, Zou M, Di P, Svistunenko DA, Kurnikov IV, Borisenko GG. Nat Chem Biol. 2005;1:223. doi: 10.1038/nchembio727. [DOI] [PubMed] [Google Scholar]
- 7.Balakrishnan G, Hu Y, Oyerinde OF, Su J, Groves JT, Spiro TG. J Am Chem Soc. 2007;129:504. doi: 10.1021/ja0678727. [DOI] [PMC free article] [PubMed] [Google Scholar]
- 8.Bergstrom CL, Beales PA, Lv Y, Vanderlick TK, Groves JT. Proc Natl Acad Sci USA. 2013;110:6269. doi: 10.1073/pnas.1303819110. [DOI] [PMC free article] [PubMed] [Google Scholar]
- 9.Hong Y, Muenzner J, Grimm SK, Pletneva EV. J Am Chem Soc. 2012;134:18713. doi: 10.1021/ja307426k. [DOI] [PMC free article] [PubMed] [Google Scholar]
- 10.Snider EJ, Muenzner J, Toffey JR, Hong Y, Pletneva EV. Biochemistry. 2013;52:993. doi: 10.1021/bi301682c. [DOI] [PMC free article] [PubMed] [Google Scholar]
- 11.Fernandez MG, Troiano L, Moretti L, Nasi M, Pinti M, Stefano S, Dobrucki J, Cossarizza A. Cell Growth Differ. 2002;13:449. [PubMed] [Google Scholar]
- 12.Geng X, Huang C, McCombs JE, Yuan Q, Harry BL, Palmer AE, Xia NS, Xue D. Proc Natl Acad Sci USA. 2012;109:18471. doi: 10.1073/pnas.1204668109. [DOI] [PMC free article] [PubMed] [Google Scholar]
- 13.Kim J, Minkler PE, Salomon RG, Anderson VE, Hoppel CL. J Lipid Res. 2011;52:125. doi: 10.1194/jlr.M010520. [DOI] [PMC free article] [PubMed] [Google Scholar]
- 14.Sorice M, Circella A, Misasi R, Pittoni V, Garofalo T, Cirelli A, Pavan A, Pontieri GM, Valesini G. Clin Exp Immunol. 2000;122:277. doi: 10.1046/j.1365-2249.2000.01353.x. [DOI] [PMC free article] [PubMed] [Google Scholar]
- 15.Kagan VE, Borisenko GG, Tyurina YY, Tyurin VA, Jiang J, Potapovich AI, Kini V, Amoscato AA, Fujii Y. Free Radical Biol Med. 2005;37:1963. doi: 10.1016/j.freeradbiomed.2004.08.016. [DOI] [PubMed] [Google Scholar]
- 16.Valianpour F, Wanders RJ, Overmars H, Vaz FM, Barth PG, van Gennip AH. J Lipid Res. 2003;44:560. doi: 10.1194/jlr.M200217-JLR200. [DOI] [PubMed] [Google Scholar]
- 17.Fobker A, Voss R, Reinecke H, Crone C, Assmann G, Watler A. FEBS Lett. 2001;500:157. doi: 10.1016/s0014-5793(01)02578-9. [DOI] [PubMed] [Google Scholar]
- 18.Bird SS, Marur VR, Sniatynski MJ, Greenberg HK, Kristal BS. Anal Chem. 2011;83:940. doi: 10.1021/ac102598u. [DOI] [PMC free article] [PubMed] [Google Scholar]
- 19.van Engelenburg SB, Palmer AE. Curr Opin Chem Biol. 2008;12:60. doi: 10.1016/j.cbpa.2008.01.020. [DOI] [PubMed] [Google Scholar]
- 20.Mileykovskaya E, Dowhan W, Birke RL, Zheng D, Lutterodt L, Haines TH. FEBS Lett. 2001:187. doi: 10.1016/s0014-5793(01)02948-9. [DOI] [PubMed] [Google Scholar]
- 21.Kaewsuya P, Danielson ND, Ekhterae D. Anal Bioanal Chem. 2007;387:2775. doi: 10.1007/s00216-007-1135-0. [DOI] [PubMed] [Google Scholar]
- 22.Fernandez MIG, Ceccarelli D, Muscatello U. Anal Biochem. 2004;328:174. doi: 10.1016/j.ab.2004.01.020. [DOI] [PubMed] [Google Scholar]
- 23.Petit JM, Maftah A, Ratinaud MH, Julien R. Eur J Biochem. 1998;209:267. doi: 10.1111/j.1432-1033.1992.tb17285.x. [DOI] [PubMed] [Google Scholar]
- 24.Hong Y, Lam JWY, Tang BZ. Chem Commun. 2009:4332. doi: 10.1039/b904665h. [DOI] [PubMed] [Google Scholar]
- 25.Luo J, Xie Z, Lam JWY, Cheng L, Chen H, Qiu C, Kwok HS, Zhan X, Liu Y, Zhu D, Tang BZ. Chem Commun. 2001:1740. doi: 10.1039/b105159h. [DOI] [PubMed] [Google Scholar]
- 26.Wang M, Zhang G, Zhang D, Zhu D, Tang BZ. J Mater Chem. 2010;20:1858. [Google Scholar]
- 27.Hong Y, Lam JWY, Tang BZ. Chem Soc Rev. 2011;40:5361. doi: 10.1039/c1cs15113d. [DOI] [PubMed] [Google Scholar]
- 28.Xu X, Huang J, Li J, Yan J, Qin J, Li Z. Chem Commun. 2011;47:12385. doi: 10.1039/c1cc15735c. [DOI] [PubMed] [Google Scholar]
- 29.Xu X, Li J, Li Q, Huang J, Dong Y, Hong Y, Yan J, Qin J, Li Z, Tang BZc. Chem Eur J. 2012;18:7278. doi: 10.1002/chem.201103638. [DOI] [PubMed] [Google Scholar]
- 30.Wang M, Zhang D, Zhang G, Tang Y, Wang S, Zhu D. Anal Chem. 2008;80:6443. doi: 10.1021/ac801020v. [DOI] [PubMed] [Google Scholar]
- 31.Wang M, Gu X, Zhang G, Zhang D, Zhu D. Anal Chem. 2009;81:4444. doi: 10.1021/ac9002722. [DOI] [PubMed] [Google Scholar]
- 32.Hong Y, Chen S, Leung CWT, Lam JWY, Tang BZ. Chem Asian J. 2013;8:1806. doi: 10.1002/asia.201300065. [DOI] [PubMed] [Google Scholar]
- 33.Tong H, Hong Y, Dong Y, Häußler M, Li Z, Lam JWY, Dong Y, Sung HHY, Williams ID, Tang BZ. J Phys Chem B. 2007;111:11817. doi: 10.1021/jp073147m. [DOI] [PubMed] [Google Scholar]
- 34.Meisinger C, Pfanner N, Truscott KN. Isolation of Yeast Mitochondria. In: Wei X, editor. Methods in Molecular Biology: Yeast Protocols. 2nd. Vol. 313. Humana Press Inc.; Totowa, NJ: 2006. p. 33. Chapter 5. [DOI] [PubMed] [Google Scholar]
- 35.Gornall AG, Bardawill CJ, David MW. J Biol Chem. 1949;177:751. [PubMed] [Google Scholar]
- 36.Voelker DR. Lipid Assembly into Cell Membrane Biochemistry of Lipids, Lipoproteins and Membranes. 4th. Elsevier Science B. V.; Amsterdam: 2002. p. 449. Chapter 17. [Google Scholar]
Associated Data
This section collects any data citations, data availability statements, or supplementary materials included in this article.


