

Abstract
In the final stage of radiation damage in cryo-electron microscopy of proteins, bubbles of hydrogen gas are generated. Proteins embedded in DNA bubble sooner than free-standing proteins and DNA does not bubble under the same conditions. These properties make it possible to distinguish protein from DNA. Here we explored the scope of this technique (“bubblegram imaging”) by applying it to bacteriophage T7, viewed as a partially defined model system. T7 has a thin-walled icosahedral capsid, 60 nm in diameter, with a barrel-shaped protein core under one of its twelve vertices (the portal vertex). The core is densely wrapped with DNA but details of their interaction and how their injection into a host bacterium is coordinated are lacking. With short (10 sec) intervals between exposures of 17 electrons/Å2 each, bubbling starts in the third exposure, with 1 – 4 bubbles nucleating in the core: in subsequent exposures, these bubbles grow and merge. A 3D reconstruction from fifth-exposure images depicts a bipartite cylindrical gas cloud in the core. In its portal-proximal half, the axial region is gaseous whereas in the portal-distal half, it is occupied by a 3 nm-wide dense rod. We propose that they respectively represent core protein and an end of the packaged genome, poised for injection into a host cell. Single bubbles at other sites may represent residual scaffolding protein. Thus, bubbling depends on dose rate, protein amount, and tightness of the DNA seal.
Keywords: nucleocapsid structure, cryo-electron microscopy, DNA ejection, radiation biology, 3-dimensional image reconstruction, differential mass mapping
Introduction
An essential step in the structural characterization of a macromolecular complex is to determine the locations of its various components - its molecular anatomy. A method of choice is electron microscopy based on “difference imaging”, whereby the complex is modified, biochemically or genetically, in some way that relates to a given component and the structures of the modified and unmodified complexes are compared. For example, the complex may be decorated with a Fab fragment (Steven et al., 2005; Wang et al., 1992); or some component may be cleaved off proteolytically (Carrascosa and Steven, 1978); or decorated with a heavy metal cluster (Al-Bassam et al., 2002; Cheng et al., 1999); or extracted by treating with a denaturant (Newcomb et al., 1993); or have an additional domain inserted at a defined site (Conway et al., 2010). However, these approaches are not applicable to components buried inside a complex where they are inaccessible to antibodies, proteases, or clusters.
It has long been known that when vitrified proteinaceous specimens are exposed to the electron beam, the end-point of radiation damage is bubbling (Dubochet et al., 1988). More recently, it has been observed that proteins which are surrounded by DNA bubble earlier than surface-exposed proteins (Black and Thomas, 2011; Wu et al., 2012). (DNA itself does not bubble in the relevant dose regime). We have attributed this property to the DNA obstructing the diffusion of radiolytic products from their sites of origin so that they build up more rapidly to a critical concentration at which bubbles – apparently of hydrogen gas at high pressure (Leapman and Sun, 1995; Meents et al., 2010) - are generated. Unlike images of the undamaged specimen in which the protein is contrast-matched with DNA, the bubbles are of much lower density and are readily visible. This property affords the basis for “bubblegram imaging” (Wu et al., 2012). The specimen is first imaged at a low electron dose typically used in cryo-EM (10 - 20 electrons/Å2); then it is subjected to additional similar exposures that induce bubbling in the buried proteins. The resulting information on bubble locations can then be exploited to identify protein components in a 3D reconstruction calculated from first-exposure micrographs in which the structure is well preserved.
As proof of principle, we demonstrated bubblegram imaging on bacteriophage φKZ (Wu et al., 2012). This virus has a large icosahedral nucleocapsid (T=27, 125 nm in diameter; (Fokine et al., 2007)) containing a proteinaceous “inner body” (Thomas et al., 2012). In that study, in which the location and the structure of the cylindrical inner body were determined (Wu et al., 2012), a three-dimensional reconstruction was calculated only from the first (low-dose) exposures and the distributions of bubbles, which varied stochastically from particle to particle, were used to locate the inner body in each image. However, if a reconstruction is also calculated from high-dose images (with bubbles), the resulting density maps have the potential to differentiate between protein and DNA on a finer scale. The greater radiation-hardiness of peripheral proteins means that they persist in the higher-dose images, providing a frame of reference for the averaged gas cloud to be seen in the bubblegram.
We have now used this approach to investigate the internal structure of bacteriophage T7. T7 has an icosahedral capsid which has a short conical tail extending from its portal vertex (Cerritelli et al., 2003a; Cuervo et al., 2013), the site via which DNA enters the capsid during assembly and exits during infection - Figure 1. On the interior surface of the portal vertex is mounted the “core”, a cylindrical protein complex ∼ 25 nm long by 20 nm in diameter (Serwer, 1976; Steven and Trus, 1986). It consists of stacked rings of three proteins, with 12-fold, 8-fold, and 4-fold symmetry, respectively (Agirrezabala et al., 2005a; Cerritelli et al., 2003b; Guo et al., 2013), mounted on the 12-fold ring of the portal protein (Agirrezabala et al., 2005b; Kocsis et al., 1995). The capsid is first assembled as precursor procapsid that contains the core but no DNA. As DNA is packaged, the procapsid matures, with both the capsid and the core undergoing major conformational changes (Cerritelli et al., 2003a; Ionel et al., 2011). Finally, the tail is added (Cuervo et al., 2013).
Figure 1.
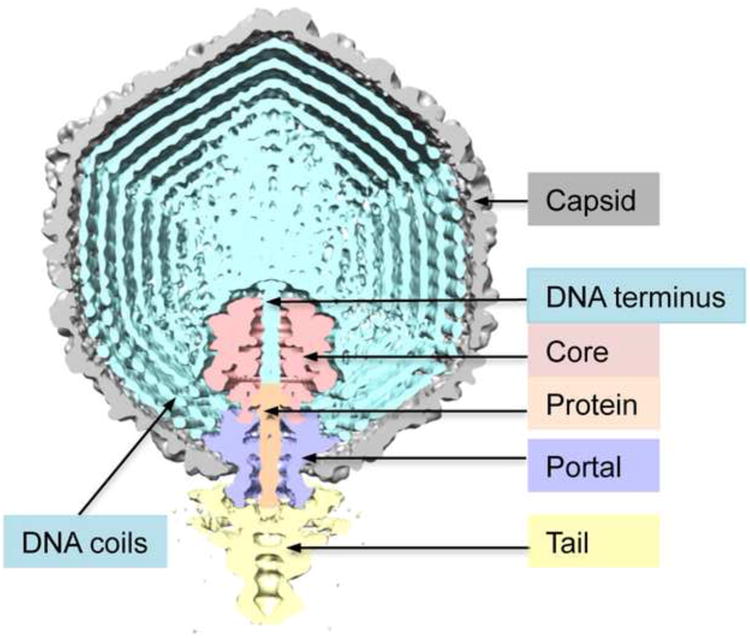
Segmented cutaway model of the T7 virion, taken from a cryo-EM reconstruction in which the only symmetry imposed and exploited was C5 symmetry around the portal axis. The various components are color-coded as shown. The region along the portal axis extending from the start of the portal is occupied by positive density. Based on bubblegram imaging (Results and Discussion), we identify the portal-proximal part (light brown) as protein and the portal-distal part as the “left” end of the genome, viz. “DNA terminus”. The virion has 6 tail-fibers distributed around the proximal portion of the tail but they are not seen in this reconstruction.
In the mature nucleocapsid, the 40 kbp viral genome is wrapped in coaxial coils around the portal axis (and the core), with a less ordered region towards the center (Cerritelli et al., 1997). It is thought that, during packaging, the incoming DNA passes axially through the core but this has not been demonstrated. Moreover, evidence has been presented that, during infection, the core is dismantled and core proteins reptate along the tail-tube into the host bacterium (Hu et al., 2013). This scenario requires that interactions between the DNA, the core, and the capsid/tail complex be closely coordinated. Here we investigate this issue by bubblegram imaging.
Materials & Methods
Preparation of T7 virions
100 ml of E. coli BL21 cells growing exponentially in LB medium at 37°C in a shaker flask were infected with wild-type T7 phage. Following lysis, clarification, DNase and RNase treatment, pelleting, and resuspension in buffered CsCl (density = 1.56 g/ml), the phage were banded (250,000°g, 12 h, 21°C in a TLS-55 rotor), collected by piston displacement, and dialyzed extensively against 50 mM Tris, 10 mM MgCl2, 50 mM NaCl (pH 7.5) to a final concentration of about 1012 virions/ml. Their protein composition, as revealed by SDS-PAGE, is shown in Figure 2.
Figure 2.
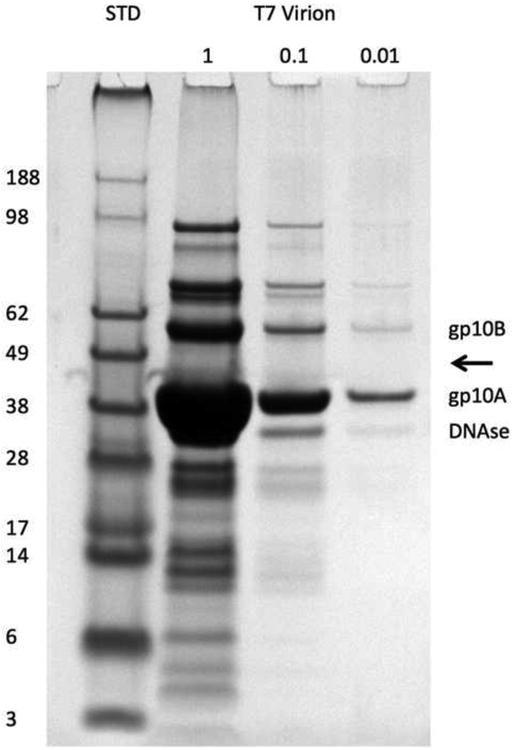
Proteins from purified T7 virions separated by reducing SDS-PAGE and stained with Coomassie Blue. The first lane (STD, standards) shows reference proteins with their molecular masses in kDa indicated on the left. The next three lanes show loadings of T7 proteins at serial 10-fold dilutions. The major and minor capsid proteins, gp10A and gp10B, are labeled, as is DNAse 1 which was added to digest viral DNA. The expected location of the scaffolding protein gp9 (Roeder and Sadowski, 1977) is indicated by an arrow.
Cryo-electron microscopy
21 dose series of images were collected and pooled. The micrographs were recorded on a CM200-FEG transmission electron microscope (FEI), operating at 120 keV and 38,000× magnification, as previously described (Cheng et al., 1999). Each exposure corresponded to a dose of 17 electrons/Å2. The 1st, 3rd, 5th, 7th and 9th exposures in each series were recorded on film (Kodak SO-163). The 2nd, 4th, 6th and 8th exposures were checked visually on a CCD camera, but were not recorded.
Image processing and reconstruction
The micrographs were digitized on a Nikon Super Coolscan 9000 scanner with a 6.35 μm step size and binned 2-fold, giving a sampling rate of 3.34 Å/pixel. EMAN (Ludtke et al., 1999) and EMAN2 (Tang et al., 2007) were used for image processing. To align the images in a given series, the centers of three corresponding particles on each image were marked. These three points define a triangle whose circumcenter was used to define a reference point on each image, while the vector from the circumcenter to one of the three particles was employed to calculate the rotation matrix needed to bring the images into alignment. The resulting translation and rotation parameters were used to align the particles from the 3rd, 5th, 7th, and 9th exposures with those of the 1st exposure. e2boxer.py and batchboxe were employed to pick all the usable particles in a given series. The zeroes of the contrast transfer function (CTF) were determined from the 1st-exposure images according to (Wu et al., 2013) and used to perform the same phase-flipping correction on all the images in that series. The particles' centers (origins), initially estimated as described above, were refined using cenalignInt in EMAN1.
To calculate reconstructions, capsid orientations were first determined by projection-matching, focusing on the 1st-exposure images and applying these results throughout the dose series. Initially, we assumed icosahedral symmetry and this yielded twelve symmetry-related possibilities for the location of the tail on any given particle. In order to locate its portal vertex (and thus the portal axis), we computed a projection for each of the 12 candidate orientations, using a tailed model calculated from a subset of particles whose tails were clearly evident. By comparing the positions of the tail in these projections and in the corresponding image, the portal vertex could be clearly identified in most cases. For ambiguous particles whose tails were eclipsed, we relied on the core-associated bubbles seen on the 5th -exposure images which are adjacent to the portal vertex (see below) to identify that vertex. “Asymmetric” reconstructions were then calculated according to (Guo et al., 2013), from all the 1st, 3rd, 5th, 7th and 9th -exposure particles, respectively, without enforcing any symmetry. The data set for each reconstruction comprised 2200 particles. Finally, C5 symmetry was enforced. We refer to these bubblegram reconstructions as B1, B3, etc. As adjudged by the Fourier shell coefficient criterion with a threshold of 0.5 applied to the capsid shell and tail regions of the reconstructed volumes, the resolutions were: B1 - 21 Å; B3 - 36 Å; B5 - 43 Å; B7 -49 Å; B9 - 56 Å.
Results
The onset of bubbling depends on the interval between exposures, i.e. it is dose rate-dependent
We monitored the evolution of bubbles and the accompanying changes in T7 virions during the course of two electron dose series. Micrographs were recorded at 17 electrons/Å2 per exposure (time, 1 sec). In the first series, the interval between exposures was 10 sec. Bubbling started in the third exposure with the appearance of clusters of 1 - 4 small bubbles, ∼ 3 nm to ∼ 6 nm in diameter, per virion (Figure 3). Most of the virions presented side-views, as attested by the conical tail protruding off to one side: some examples are marked with black arrows in Figure 3. In these virions, the bubble clusters were always positioned eccentrically on the tail-proximal side of the nucleocapsid, implying that they nucleated in the protein core. It appears that nucleation is a stochastic event, as neither the number of bubbles per cluster nor their spatial distribution followed a fixed pattern; nor did they share the 4-fold rotational symmetry of the core. In subsequent exposures, these bubbles grew and merged (Figures 4A & 4B). The growth in bubble volume with increasing cumulative electron dose is plotted for 100 virions in Figure 5A. In each case, the total bubble volume is given, as the number of distinct bubbles changes, with several small bubbles early in the series that merge to give fewer, larger, bubbles later in the series. The corresponding growth in bubble diameter is summarized in Table 1.
Figure 3.
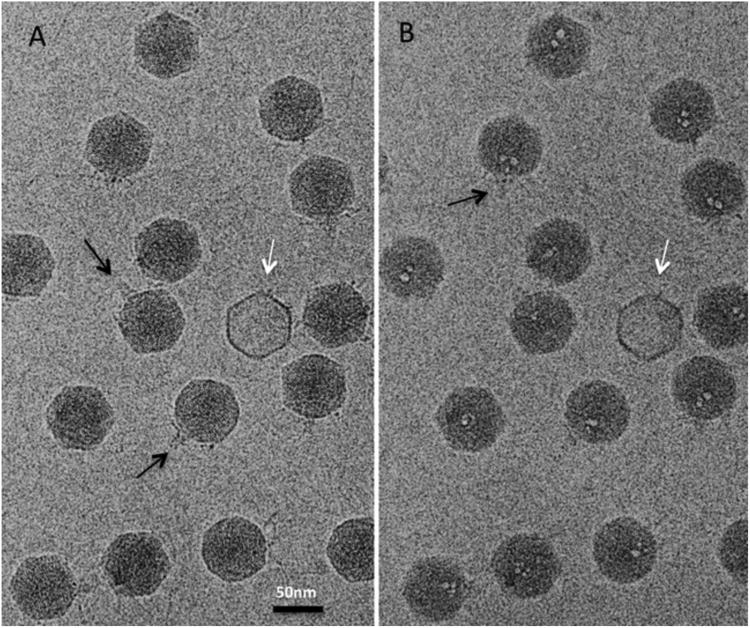
Two cryo-electron micrographs of the same field of T7 virions. (A) First exposure with good structural preservation and no bubbling. (B) Third exposure with incipient bubbling. There are no bubbles in the one empty (DNA-free) capsid (white arrow) nor in the peripheral regions (capsid shell) of the filled virions which are in direct contact with frozen buffer. Black arrows: two examples of tails seen in side-view.
Figure 4.
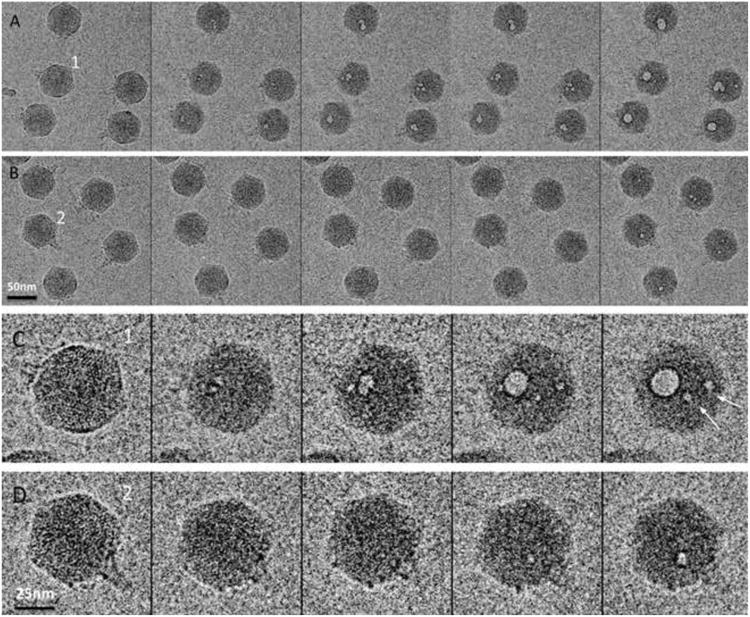
(A & B) Two dose series of images recorded as the 1st, 3rd, 5th, 7th and 9th exposures of the same fields of T7 virions, from left to right. The cumulative doses were 17, 51, 85, 119 and 153 electrons/Å2 respectively, while 10 seconds (A) and 10 minutes (B) were the respective waiting times between successive exposures. (C & D) Close-up views of particles 1 and 2 in panels A and B, respectively. In particle 1, the first small bubbles appeared in the 3r exposure (second panel). In particle 2, they appeared in the 7th/9th exposures (panels 4 and 5). White arrows in (C) point out two singleton bubbles.
Figure 5.
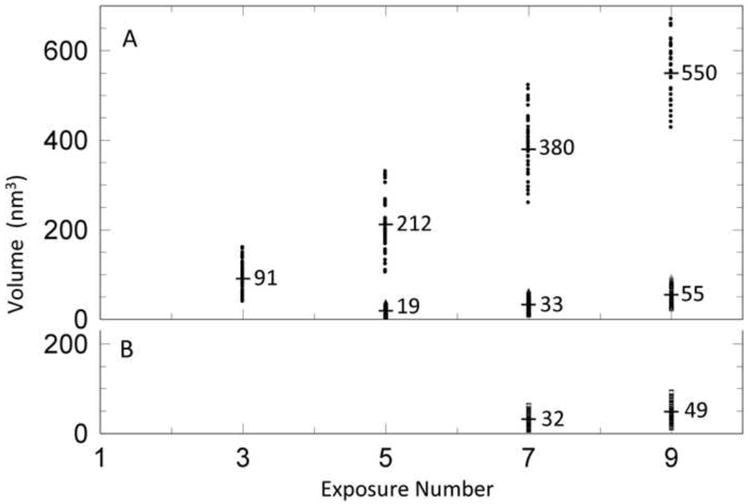
Increase in total bubble volume per virion over the course of two dose series. Each virion measured is represented by a data point. The numbers given are mean values. (A) A dose series with 10 seconds between exposures. Upper data points (means, 91 -550 nm3): core-associated bubbles. The number of bubbles nucleated varied between virions and fell during the course of the dose series, through bubble merging. The corresponding data on bubble diameters are given in Table 1. Lower data points: (means, 33 & 55 nm3): singletons. Few virions had more than one singleton. (B) A dose series with 10 min between exposures, for core-associated bubbles.
Table 1.
Average values of gas bubble volume and diameter, per virion.
| Exposure # | Numbers of bubbles/virions | Total bubble volume per virion (nm3) | Mean volume per bubble (nm3) | Mean bubble diameter (nm) |
|---|---|---|---|---|
| core clusters | ||||
| 3rd, 10 sec | 127/60 | 91 | 43 | 4.3 |
| 5th, 10 sec | 72/60 | 212 | 177 | 7.0 |
| 7th, 10 sec | 60/60 | 380 | 380 | 9.0 |
| 9th, 10 sec | 60/60 | 550 | 550 | 10.2 |
| singletons | ||||
| 5th, 10 sec | 120/95 | 19 | 15 | 3.1 |
| 7th, 10 sec | 257/230 | 33 | 30 | 3.9 |
| 9th, 10 sec | 151/131 | 55 | 48 | 4.5 |
| core clusters | ||||
| 7th, 10 min | 224/133 | 32 | 19 | 3.3 |
| 9th, 10 min | 227/132 | 49 | 29 | 3.8 |
According to the hypothesis outlined above (Introduction), a key factor in bubbling is the rate at which radiolytic products, notably molecular hydrogen, build up to a critical concentration. In turn, this depends on the rate at which the products can diffuse away from their sites of origin: the faster the diffusion rate, the larger the electron dose that can be sustained before bubbling starts. Thus the hypothesis predicts that longer intervals between exposures in a dose series should result in a later onset of bubbling. We tested this prediction and found that this is indeed the case. In the second dose series, the interval between exposures from 10 sec to 10 min. This was found to result in an approximately 3-fold increase in the total electron dose that preceded the appearance of visible bubbles (cf. Figures 4A & 4B and Figures 5A & 5B). The biggest change was between 5 min and 10 min (data not shown).
Singleton bubbles nucleate later and remain smaller than core-derived bubbles
In addition to these core-related clusters, we observed single bubbles at other internal locations (e.g. arrow in Figure 4B). We refer to these bubbles as “singletons”. Singletons appeared in about 10% of virions, whereas core-related clusters were seen in all of them. Occasionally, more than one singleton was observed in the same virion. The growth of singletons is plotted in Figure 5A. They tend to appear later than and remain much smaller than bubbles in core-related clusters. On the other hand, we never saw bubbles in the tail nor around the periphery of the virions where the capsid protein shell projects, nor in the few empty (DNA-free) capsids in this preparation (white arrow in Figure 3). Presumably, the same inelastic scattering events take place in the latter proteins but their radiolytic products diffuse away fast enough to forestall bubble formation, at least over the dose range covered in these experiments.
Three-dimensional reconstructions depict expanding, axially aligned, gas clouds
We then calculated three-dimensional reconstructions from the same set of virions imaged in successive exposures. Reconstructions were calculated for odd-numbered members of the series: first exposure, map B1; third exposure, map B3, etc. The symmetry imposed in the reconstructions was limited to 5-fold symmetry around the portal axis. This symmetry applies to the capsid shell, but not to the tail (6-fold), the portal (12-fold), or the core (which has 4-fold, 8-fold, and 12-fold components). As a result of these symmetry mismatches, the representations obtained of the latter structures are, in effect, cylindrical averages (e.g. the reconstructed tail was 30-fold symmetrized). Similarly, the gas clouds that develop in the cores, as averaged and symmetrized in the reconstructions, present as cylindrically symmetric (Figure 6). The following features are noteworthy:
In the B3 reconstruction, radiation damage is expressed as a general blurring of the structure (Conway et al., 1993). The layering associated with the concentrically coiled DNA, which is clear in B1, is barely resolved in B3 and is not distinguished at all in B5. Although there are incipient bubble clusters in almost all 3rd exposure virions (Figure 4), the bubbles are too small and too inconsistently located to register as a gas cloud when averaged together in the B3 reconstruction.
The most detailed bubblegram (B5 - Figure 6) contains a sharply defined gas cloud that is located in the core region but does not occupy its full volume. In particular, the tail-proximal region of the core is not yet gasified, presumably because radiolytic products generated in this location may diffuse out relatively easily. This gas cloud is divided into two subclouds of differing diameters (upper and lower white arrows): between them, there is a region of high density, about 12 nm in from the portal vertex. The asymmetry of the gas cloud suggests that there are particular sites in the core where bubbles preferentially nucleate. In addition, the two subclouds differ in their axial regions. That of the portal-proximal subcloud is gaseous whereas that of the portal-distal subcloud is dense. Transverse slices through the reconstructions at axial levels corresponding to the middles of the two subclouds are shown in Figure 6 (middle and bottom row). They further document the cylindrical symmetry of the subclouds and the differences between them in diameter and axial density.
In the later reconstructions, B7 and B9 in Figure 6, the two subclouds coalesce and continue to expand. In B9, the gas cloud envelope almost coincides with the region initially occupied by the protein core.
Figure 6.
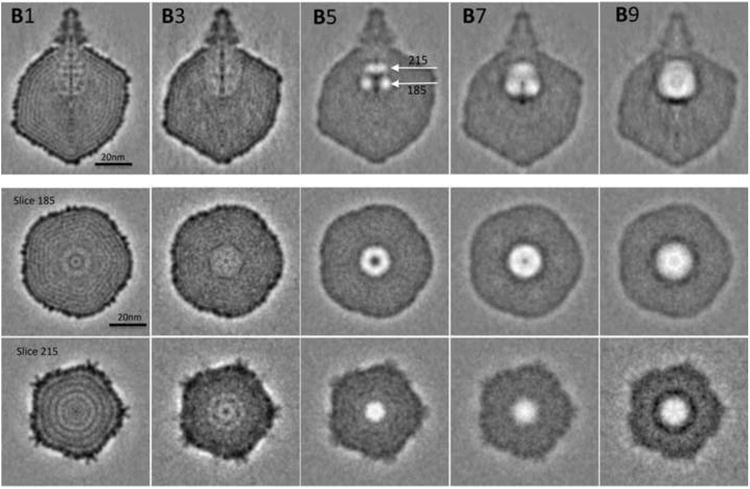
Grayscale sections through 3D reconstructions of the same set of T7 virions after increasing amounts of electron irradiation. B1 is the 1st exposure reconstruction; B3 is the 3rd exposure reconstruction, etc. At the top is the conical tail; immediately below it are the portal and core (see Figure 1). Some details of the thin capsid shell are resolved in B1, as are the layers of concentrically coiled DNA which are prominent in B1, rows 2 and 3. These features blur out in later reconstructions. The white arrows in B5 mark the axial levels of slices z=215 and z=185 (the central slice is at z=162). Rows 2 and 3 show transverse sections through the reconstructions at those levels. It is noteworthy that a dense layer builds up at the portal-distal end of the gas cloud in the B9 reconstruction: it may represent a deposition of non-volatile radiolytic products.
Discussion
Radiation damage in cryo-EM has been addressed in several recent articles (Baker and Rubinstein, 2010; Bammes et al., 2010; Garman and Weik, 2013; Glaeser, 2008). These accounts have mainly considered phenomena taking place in the pre-bubbling dose regime, in which damage is expressed by a progressive blurring of finer details (Conway et al., 1993). Here we first consider factors that may affect the outcome of bubblegram imaging and then discuss the implications of the present experiments for the organization of T7 virions.
Dependence of bubbling and data quality on dose rate
Extending the interval between exposures from 10 sec to 10 min resulted in an approximately 3-fold increase in the total dose before bubbling started, under the conditions used, viz. specimen temperature of ∼ -180°C; 1-second exposures; 17 electrons/Å2 per exposure. This observation strongly supports the idea that bubbling follows after radiolytic products build up to a critical concentration. It follows that - in this dose regime at least – dose rate affects the onset of bubbling: and as a corollary, appropriately controlling the dose rate can be a potentially important factor for minimizing radiation damage, even in the pre-bubbling regime.
Another parameter to be considered is specimen temperature, i.e. whether to work at a temperature of ∼ -180° (liquid nitrogen cooling) or ∼ -265° (liquid helium cooling). The diffusion rates of radiolytic products may be lower at the lower temperature and this may give a more rapid build-up in their concentration, promoting bubbling-related beam damage. This eventuality would be consistent with the observations of Iancu et al. (Iancu et al., 2006) who concluded that their cryo-electron tomograms obtained at liquid helium temperature were inferior to those recorded at liquid nitrogen temperature.
What is the optimal dose for bubblegram imaging? In general, bubble(s) increase in size with increasing dose while the state of preservation of the specimen deteriorates. The first-exposure micrographs yield a reference structure that is to be interpreted in light of the bubblegrams and the question of optimality comes down to the size, shape, and level of detail in the reconstructed gas cloud(s). The rate at which a gas cloud grows appears to depend on three factors: the amount of protein locally present (singleton bubbles appear later and remain smaller than core-derived bubbles); its proximity to bulk water (the portal-proximal part of the core is the last to gasify); and how tightly it is encased in DNA (at one extreme, we did not observe bubbling in empty, i.e. DNA-free capsids). The present results suggest that a serviceable dose, for at least some applications, is about 80 electrons/Å2, delivered in five exposures, 10 sec apart. On the other hand, a lower dose -say, 40 electrons/Å2 delivered in a single high-intensity exposure after the initial low-dose micrograph - may be appropriate for a bubbling-reluctant specimen whose protein core is less tightly enclosed in DNA.
In sum, we anticipate that bubblegram imaging should find many fruitful applications, not only in probing the internal structures of DNA viruses, but also those of dsRNA viruses and of nucleoprotein complexes in general. It may also prove useful in the analysis of nucleoprotein complexes whose proteins are on the outer surface, where induction of bubbling will require higher electron doses than for internal proteins but should still occur well before the doses required for nucleic acid to bubble.
Singletons may nucleate in residual (non-expelled) scaffolding protein
Singletons appear at other (non-core) internal sites, with a delay relative to core-related bubble clusters (Figure 4A). These bubbles do not give rise to gas cloud(s) in the reconstructions, implying that they are not consistently positioned from particle to particle and consequently are smeared out. Their internal locations and bubbling threshold suggest that they also originate in DNA-embedded protein. One likely candidate is the T7 scaffolding protein, gp9 (34 kDa). The T7 procapsid contains ∼ 250 copies of gp9 co-assembled with 415 copies of the coat protein gp10, and 12 copies of the portal protein (Cerritelli and Studier, 1996). During DNA packaging and maturation of the procapsid, gp9 is expelled, as is the norm for bacteriophage scaffolding proteins (Dokland, 1999). However, expulsion may not be 100% efficient. If a few copies of gp9 were to be retained and become buried in the DNA for a subset (∼10%) of mature virions, their band in SDS-PAGE would be too weak to be detected (Figure 2), but these proteins might well show up as radiation-induced singletons in individual virions. Alternatively, a few host cell protein(s) may be “accidentally” incorporated into the procapsid as it assembles in the crowded cytoplasm. The delay in the appearance of singletons and the fact they remain much smaller than core-cluster bubbles suggests that their protein sources are smaller. This scenario implies that bubblegram imaging can be a sensitive detector of DNA-embedded proteins; also that the size of the bubbles can give some indication of their size.
Relationship of gas cloud shape to core structure
If a spherical protein complex were to be present at the nucleocapsid center, we would expect the resulting gas cloud also to be spherical and concentric with the particle. However, the T7 core is markedly non-spherical, in addition to being eccentrically positioned. The gas cloud reconstructed at exposure 7 has about the same volume as the core (cf. B1 and B7 in Figure 6) but they are not congruent. The portion of the core closest to the tail remains dense (non-gaseous), presumably because radiolytic products generated in this region diffuse more easily out of the virion. The gas cloud at exposure 5 is smaller and distinctly asymmetric. It divides axially into two parts separated by positive density at about the level expected for gp15 (Figure 1). This asymmetry suggests that not all proteins are equally susceptible to bubbling. We conjecture that regions of the core that are particularly susceptible to bubbling may represent domains with relatively high contents of aliphatic residues which should provide a rich source of molecular hydrogen.
Implications for internal structure of the T7 virion
In the B1 reconstruction (undamaged virion), the entire axial region from the outer surface of the portal to the inner limit of the core is occupied by dense material (Figure 6, top left panel; Figure 1). In the B5 reconstruction (damaged virion; Figure 6), the tail-proximal portion of this axial region has low density, i.e. it has become part of the bubble, while the tail-distal portion is still occupied by a rod of density ∼ 11 nm long and ∼ 3 nm wide (Figure 6). Thus the material in the tail-proximal axial region is radiation-sensitive and therefore protein, whereas the material in the tail-distal region is radiation-tolerant and therefore DNA. A schematic diagram of the proposed arrangement is shown in Figure 7. We suggest that this protein may be a “head completion” molecule added after DNA packaging is completed. One candidate is gp6.7, a minor component of the nucleocapsid known to associate with the portal (Hauser et al., 2012), a possibility already proposed by Kemp and coworkers (Kemp et al., 2005). We tentatively interpret the 11 nm-long segment of radiation-resistant density as ∼ 30 bp of duplex DNA at one end of the linear T7 genome, presumably the “left” end which is the last to enter the capsid in packaging and the first to leave in infection (Black, 1989; Hartman et al., 1979). In this scenario, the DNA end is “threading the needle”, being ideally positioned to pass through the portal and the tail-tube after blockage by the axial protein is removed. How subsequent events in DNA injection proceed and how they are coordinated with injection of the core proteins remain to be determined.
Figure 7.
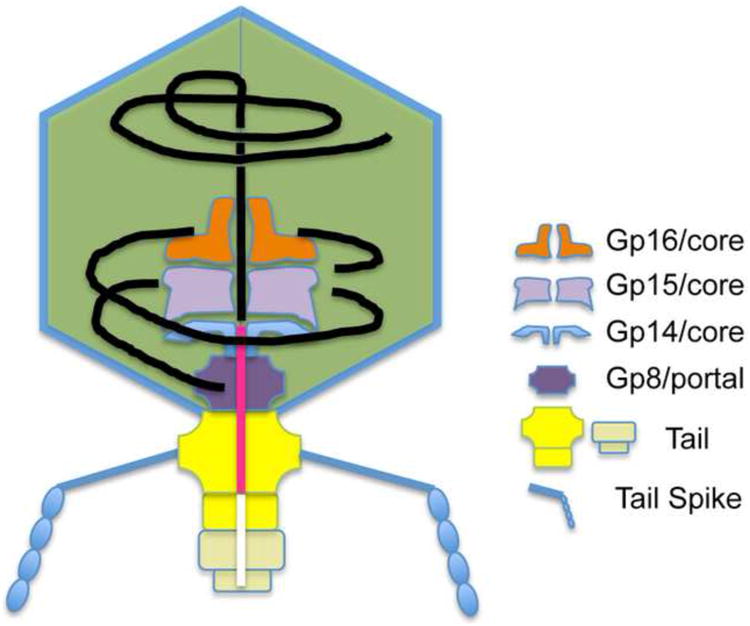
Schematic diagram of the T7 virion, focussing on the axial channel through the core/portal/tail complex inferred to be occupied by DNA (black) and protein (pink) in the mature T7 head.
Acknowledgments
We thank Ms. Lili You for collecting the data on bubble sizes and Drs. L.W. Black and R.L. Duda and Mr. M.A. DiMattia for helpful discussions. This research was supported by the Intramural Research Program of NIAMS.
Footnotes
Publisher's Disclaimer: This is a PDF file of an unedited manuscript that has been accepted for publication. As a service to our customers we are providing this early version of the manuscript. The manuscript will undergo copyediting, typesetting, and review of the resulting proof before it is published in its final citable form. Please note that during the production process errors may be discovered which could affect the content, and all legal disclaimers that apply to the journal pertain.
References
- Agirrezabala X, Martin-Benito J, Caston JR, Miranda R, Valpuesta JM, et al. Maturation of phage T7 involves structural modification of both shell and inner core components. EMBO J. 2005a;24:3820–9. doi: 10.1038/sj.emboj.7600840. [DOI] [PMC free article] [PubMed] [Google Scholar]
- Agirrezabala X, Martin-Benito J, Valle M, Gonzalez JM, Valencia A, et al. Structure of the connector of bacteriophage T7 at 8 Å resolution: structural homologies of a basic component of a DNA translocating machinery. J Mol Biol. 2005b;347:895–902. doi: 10.1016/j.jmb.2005.02.005. [DOI] [PubMed] [Google Scholar]
- Al-Bassam J, Ozer RS, Safer D, Halpain S, Milligan RA. MAP2 and tau bind longitudinally along the outer ridges of microtubule protofilaments. J Cell Biol. 2002;157:1187–96. doi: 10.1083/jcb.200201048. [DOI] [PMC free article] [PubMed] [Google Scholar]
- Baker LA, Rubinstein JL. Radiation damage in electron cryomicroscopy. Meth Enzymol. 2010;481:371–88. doi: 10.1016/S0076-6879(10)81015-8. [DOI] [PubMed] [Google Scholar]
- Bammes BE, Jakana J, Schmid MF, Chiu W. Radiation damage effects at four specimen temperatures from 4 to 100 K. J Struct Biol. 2010;169:331–41. doi: 10.1016/j.jsb.2009.11.001. [DOI] [PMC free article] [PubMed] [Google Scholar]
- Black LW. DNA packaging in dsDNA bacteriophages. Annu Rev Microbiol. 1989;43:267–292. doi: 10.1146/annurev.mi.43.100189.001411. [DOI] [PubMed] [Google Scholar]
- Black LW, Thomas JA. Condensed genome structure. In: Rossmann G, Rao V, editors. Viral Molecular Machines. Springer; New York: 2011. pp. 466–489. [Google Scholar]
- Carrascosa JL, Steven AC. A procedure for evaluation of significant structural differences between related arrays of protein molecules. Micron. 1978;9:199–206. [Google Scholar]
- Cerritelli ME, Studier FW. Assembly of T7 capsids from independently expressed and purified head protein and scaffolding protein. J Mol Biol. 1996;258:286–298. doi: 10.1006/jmbi.1996.0250. [DOI] [PubMed] [Google Scholar]
- Cerritelli ME, Cheng N, Conway JF, Trus BL, Steven AC. Molecular mechanisms in bacteriophage T7 procapsid assembly, maturation, and DNA containment. Adv Protein Chem. 2003a;64:301–23. doi: 10.1016/s0065-3233(03)01008-8. [DOI] [PubMed] [Google Scholar]
- Cerritelli ME, Cheng N, Rosenberg AH, McPherson CE, Booy FP, et al. Encapsidated conformation of bacteriophage T7 DNA. Cell. 1997;91:271–280. doi: 10.1016/s0092-8674(00)80409-2. [DOI] [PubMed] [Google Scholar]
- Cerritelli ME, Trus BL, Smith CS, Cheng N, Conway JF, et al. A second symmetry mismatch at the portal vertex of bacteriophage T7: 8-fold symmetry in the procapsid core. J Mol Biol. 2003b;327:1–6. doi: 10.1016/s0022-2836(03)00117-7. [DOI] [PubMed] [Google Scholar]
- Cheng N, Conway JF, Watts NR, Hainfeld JF, Joshi V, et al. Tetrairidium, a four-atom cluster, is readily visible as a density label in three-dimensional cryo-EM maps of proteins at 10-25 Å resolution. J Struct Biol. 1999;127:169–176. doi: 10.1006/jsbi.1999.4120. [DOI] [PubMed] [Google Scholar]
- Conway JF, Trus BL, Booy FP, Newcomb WW, Brown JC, et al. The effects of radiation damage on the structure of frozen hydrated HSV-1 capsids. J Struct Biol. 1993;111:222–233. doi: 10.1006/jsbi.1993.1052. [DOI] [PubMed] [Google Scholar]
- Conway JF, Cockrell SK, Copeland AM, Newcomb WW, Brown JC, et al. Labeling and localization of the herpes simplex virus capsid protein UL25 and its interaction with the two triplexes closest to the penton. J Mol Biol. 2010;397:575–86. doi: 10.1016/j.jmb.2010.01.043. [DOI] [PMC free article] [PubMed] [Google Scholar]
- Cuervo A, Pulido-Cid M, Chagoyen M, Arranz R, Gonzalez-Garcia VA, et al. Structural characterization of the bacteriophage T7 tail machinery. J Biol Chem. 2013;288:26290–9. doi: 10.1074/jbc.M113.491209. [DOI] [PMC free article] [PubMed] [Google Scholar]
- Dokland T. Scaffolding proteins and their role in viral assembly. Cell Mol Life Sci. 1999;56:580–603. doi: 10.1007/s000180050455. [DOI] [PMC free article] [PubMed] [Google Scholar]
- Dubochet J, Adrian M, Chang JJ, Homo JC, Lepault J, et al. Cryo-electron microscopy of vitrified specimens. Q Rev Biophys. 1988;21:129–228. doi: 10.1017/s0033583500004297. [DOI] [PubMed] [Google Scholar]
- Fokine A, Battisti AJ, Bowman VD, Efimov AV, Kurochkina LP, et al. Cryo-EM study of the Pseudomonas bacteriophage phiKZ. Structure. 2007;15:1099–104. doi: 10.1016/j.str.2007.07.008. [DOI] [PubMed] [Google Scholar]
- Garman EF, Weik M. Radiation damage to biological macromolecules: some answers and more questions. J Synchrotron Radiation. 2013;20:1–6. doi: 10.1107/S0909049512050418. [DOI] [PubMed] [Google Scholar]
- Glaeser RM. Retrospective: radiation damage and its associated “information limitations”. J Struct Biol. 2008;163:271–6. doi: 10.1016/j.jsb.2008.06.001. [DOI] [PubMed] [Google Scholar]
- Guo F, Liu Z, Vago F, Ren Y, Wu W, et al. Visualization of uncorrelated, tandem symmetry mismatches in the internal genome packaging apparatus of bacteriophage T7. Proc Nat'l Acad Sci USA. 2013;110:6811–6. doi: 10.1073/pnas.1215563110. [DOI] [PMC free article] [PubMed] [Google Scholar]
- Hartman PS, Eisenstark A, Pauw PG. Inactivation of phage T7 by near-ultraviolet radiation plus hydrogen peroxide: DNA-protein crosslinks prevent DNA injection. Proc Nat'l Acad Sci USA. 1979;76:3228–32. doi: 10.1073/pnas.76.7.3228. [DOI] [PMC free article] [PubMed] [Google Scholar]
- Hauser R, Blasche S, Dokland T, Haggard-Ljungquist E, von Brunn A, et al. Bacteriophage protein-protein interactions. Adv Virus Res. 2012;83:219–98. doi: 10.1016/B978-0-12-394438-2.00006-2. [DOI] [PMC free article] [PubMed] [Google Scholar]
- Hu B, Margolin W, Molineux IJ, Liu J. The bacteriophage T7 virion undergoes extensive structural remodeling during infection. Science. 2013;339:576–9. doi: 10.1126/science.1231887. [DOI] [PMC free article] [PubMed] [Google Scholar]
- Iancu CV, Wright ER, Heymann JB, Jensen GJ. A comparison of liquid nitrogen and liquid helium as cryogens for electron cryotomography. J Struct Biol. 2006;153:231–40. doi: 10.1016/j.jsb.2005.12.004. [DOI] [PubMed] [Google Scholar]
- Ionel A, Velazquez-Muriel JA, Luque D, Cuervo A, Caston JR, et al. Molecular rearrangements involved in the capsid shell maturation of bacteriophage T7. J Biol Chem. 2011;286:234–42. doi: 10.1074/jbc.M110.187211. [DOI] [PMC free article] [PubMed] [Google Scholar]
- Kemp P, Garcia LR, Molineux IJ. Changes in bacteriophage T7 virion structure at the initiation of infection. Virology. 2005;340:307–17. doi: 10.1016/j.virol.2005.06.039. [DOI] [PubMed] [Google Scholar]
- Kocsis E, Cerritelli ME, Trus BL, Cheng N, Steven AC. Improved methods for determination of rotational symmetries in macromolecules. Ultramicroscopy. 1995;60:219–228. doi: 10.1016/0304-3991(95)00070-2. [DOI] [PubMed] [Google Scholar]
- Leapman RD, Sun S. Cryo-electron energy loss spectroscopy: observations on vitrified hydrated specimens and radiation damage. Ultramicroscopy. 1995;59:71–9. doi: 10.1016/0304-3991(95)00019-w. [DOI] [PubMed] [Google Scholar]
- Ludtke SJ, Baldwin PR, Chiu W. EMAN: Semiautomated software for high-resolution single-particle reconstructions. J Struct Biol. 1999;128:82–97. doi: 10.1006/jsbi.1999.4174. [DOI] [PubMed] [Google Scholar]
- Meents A, Gutmann S, Wagner A, Schulze-Briese C. Origin and temperature dependence of radiation damage in biological samples at cryogenic temperatures. Proc Nat'l Acad Sci USA. 2010;107:1094–9. doi: 10.1073/pnas.0905481107. [DOI] [PMC free article] [PubMed] [Google Scholar]
- Newcomb WW, Trus BL, Booy FP, Wall JS, Steven AC, et al. Structure of the herpes simplex virus capsid: Molecular composition of the pentons and triplexes. J Mol Biol. 1993;232:499–511. doi: 10.1006/jmbi.1993.1406. [DOI] [PubMed] [Google Scholar]
- Roeder GS, Sadowski PD. Bacteriophage T7 morphogenesis: phage-related particles in cells infected with wild-type and mutant T7 phage. Virology. 1977;76:263–85. doi: 10.1016/0042-6822(77)90302-6. [DOI] [PubMed] [Google Scholar]
- Serwer P. Internal proteins of bacteriophage T7. J Mol Biol. 1976;10:271–291. doi: 10.1016/s0022-2836(76)80005-8. [DOI] [PubMed] [Google Scholar]
- Steven AC, Trus BL. The structure of bacteriophage T7. In: Harris JR, Horne RW, editors. Electron Microscopy of Proteins. Academic Press; London: 1986. pp. 1–35. [Google Scholar]
- Steven AC, Conway JF, Cheng N, Watts NR, Belnap DM, et al. Structure, assembly, and antigenicity of hepatitis B virus capsid proteins. Adv Virus Res. 2005;64:127–165. doi: 10.1016/S0065-3527(05)64005-5. [DOI] [PubMed] [Google Scholar]
- Tang G, Peng L, Baldwin PR, Mann DS, Jiang W, et al. EMAN2: an extensible image processing suite for electron microscopy. J Struct Biol. 2007;157:38–46. doi: 10.1016/j.jsb.2006.05.009. [DOI] [PubMed] [Google Scholar]
- Thomas JA, Weintraub ST, Wu W, Winkler DC, Cheng N, et al. Extensive proteolysis of head and inner body proteins by a morphogenetic protease in the giant Pseudomonas aeruginosa phage phiKZ. Mol Microbiol. 2012;84:324–39. doi: 10.1111/j.1365-2958.2012.08025.x. [DOI] [PMC free article] [PubMed] [Google Scholar]
- Wang GJ, Porta C, Cheng N, Baker TS, Johnson JE. Identification of a Fab interaction footprint site on an icosahedral virus by cryoelectron microscopy and X-ray crystallography. Nature. 1992;355:275–278. doi: 10.1038/355275a0. [DOI] [PMC free article] [PubMed] [Google Scholar]
- Wu W, Thomas JA, Cheng N, Black LW, Steven AC. Bubblegrams reveal the inner body of bacteriophage phiKZ. Science. 2012;335:182. doi: 10.1126/science.1214120. [DOI] [PMC free article] [PubMed] [Google Scholar]
- Wu W, Chen Z, Cheng N, Watts NR, Stahl SJ, et al. Specificity of an anti-capsid antibody associated with Hepatitis B Virus-related acute liver failure. J Struct Biol. 2013;181:53–60. doi: 10.1016/j.jsb.2012.10.004. [DOI] [PMC free article] [PubMed] [Google Scholar]