Abstract
Background and Aims
Postural control differs between infants born preterm and full term at 1–3 weeks of age. It is unclear if differences persist or alter the development of early behaviors. The aim of this longitudinal study was to compare changes in postural control variability during development of head control and reaching in infants born preterm and full term.
Methods
Eighteen infants born preterm (mean gestational age 28.3±3.1 weeks) were included in this study and compared to existing data from 22 infants born full term. Postural variability was assessed longitudinally using root mean squared displacement and approximate entropy of the center of pressure displacement from birth to 6 months as measures of the magnitude of the variability and complexity of postural control. Behavioral coding was used to quantify development of head control and reaching.
Results
Group differences were identified in postural complexity during the development of head control and reaching. Infants born preterm used more repetitive and less adaptive postural control strategies than infants born full term. Both groups changed their postural complexity utilized during the development of head control and reaching.
Discussion
Early postural complexity was decreased in infants born preterm, compared to infants born full term. Commonly used clinical assessments did not identify these early differences in postural control. Altered postural control in infants born preterm influenced ongoing skill development in the first six months of life.
Keywords: Preterm Infant, Behaviors, Development, Complexity, Posture, Reach, Head Control
Introduction
Infants born preterm are at an increased risk of developmental disabilities, including cerebral palsy, developmental coordination disorder, and learning disabilities, when compared to infants born full term.(1) Research from multiple groups suggests that reduced variability in infancy may be a predictor of developmental disability.(2–4) In this study, we investigate longitudinal changes in postural variability during the development of early behaviors in infants at risk for developmental disabilities and quantify group differences between infants born full term and preterm.
In the following sections of the introduction, we define variability and complexity, and describe their importance in development. Then we highlight the need to study the magnitude of variability and complexity in the postural control system of infants at risk for developmental disabilities during early development.
Variability
Variability is a general concept and term used in the developmental and biomechanical literature to describe a system which is apt to vary or change. Rather than an ‘error’ of a system attempting to produce a gold standard, variability is now a well-recognized concept in both developmental theory and empirical studies. For example, a dynamic systems view of development highlights how behavior can be conceptualized as having fluctuating periods of stability and variability (5). Moreover, Gibson (6) and Edelman (7) proposed that during development of new behaviors children explore possible strategies for that behavior, select a few strategies which are most efficient, and reduce the use of the non-preferred strategies. Variability is frequently described as a key indicator of typical motor development from fetal movements, to standing, sitting, and walking behaviors.(8, 9) In comparison, a lack of variability is frequently identified in infants and children who have developmental delays or disabilities.(4, 10) This study extends previous research and fills a gap in the literature by investigating group differences and changes in measures of postural variability, specifically magnitude of the variability and complexity of center of pressure (COP) displacement, in early infancy during the emergence of head and arm control.
Magnitude of Variability and Complexity
The majority of research on behavioral variability early in development focuses on the magnitude of variability or the amount of variability. However, the temporal structure of variability, referred to as complexity, provides a more in-depth insight into the developmental process. Complexity is a type of variability that measures the repetitive or predictable nature of variability in a time series.(9, 11) Optimal complexity is described as an intermediate state midway between excessive order or predictability and excessive disorder or no predictability.(12) Optimal complexity is proposed to characterize healthy human body function and signify effective cooperation between the participating subsystems, which enhances the system’s ability to adapt to changing task demands. (13) In general, behavior which is highly regular and predictable, can be said to lack complexity. Quantification of decreased complexity has been found to detect subtle disruptions of systems associated with cardiac conditions, concussions, and in the inactive elderly population. (13–15)
Magnitude of Variability and Complexity in Development
Studies that investigate the changes in complexity during the development of behavior provide insight into the process of how infants learn new behaviors.(9, 11) Harbourne and Stergiou(9) describe changes in the magnitude and complexity of postural sway variability longitudinally during the development of sitting in typically developing infants. Dusing and colleagues(11) describe changes in magnitude of the variability and complexity of postural sway during the development of early head control and reaching in supine for typically developing infants. The magnitude of the variability did not change systematically during the development of any of these behaviors. However, during the development of all three of these early behaviors in typically developing infants, complexity is initially high, which provides infants with learning opportunities, then it decreases as skill improves. (9, 11) The authors propose that this decrease after the initial stages of learning reflects the infant’s ability to select the most efficient postural control strategies for a given behavior, reducing the complexity of or increasing the regularity of the postural sway. The infant learns the available postural control strategies through experience during the earlier period of higher complexity and retains the capacity to select from multiple strategies, but uses a smaller number of strategies on a regular basis. (2, 9)
Postural complexity, or the use of a variety of postural control strategies, allows the infant to experience movement and interact with the environment from multiple vantage points. Action Perception Theory suggests that using a variety of actions provides varied perceptual input.(6) Postural complexity early in development provides infants with varied experiences from interactions between their body and the environment which promotes embodied learning. Advances in postural control and motor skills change the perceptual information an infant acquires from the environment and in turn, supports cognitive and language development. (16, 17)
Postural Complexity and Developmental Delay
Lack of postural complexity may be an early indicator of atypical or delayed development. (18, 19) For example, infants diagnosed with or at risk for cerebral palsy demonstrate less complex or more repetitive postural sway strategies in the early stages of sitting which is unlike typically developing infants who have a higher complexity at this stage of sitting.(19) Similarly, infants born preterm use a less complex or more repetitive postural sway pattern at 1–3 weeks of adjusted age as compared to infants who were born full term and are at low risk for developmental delays.(18) However, it is unclear if postural complexity is decreased in at risk infants only in the first weeks of age or if the differences persist through early development. An understanding of changes in postural complexity during early skill development is needed to more fully evaluate the impact of postural control on development in infants at high risk for developmental delays and cerebral palsy.(1) The current study addresses the need to compare longitudinal changes in postural complexity between infants born full term and preterm during the development of early behaviors.
The purpose of this study was to investigate group differences in postural variability between infants born preterm and at risk for developmental delays or disability and infants born full term with typical development, during the emergence of early behaviors. Specifically, we quantify postural variability using the magnitude of the variability and complexity (temporal structure) of the variability in center of pressure (COP) displacement during the emergence of two early behaviors: midline head control and initial reaching. Head control and reaching were selected because they emerge very early in infancy, rely on postural control, and are important for future object exploration, social interaction, and cognitive development.(20) Based on the research outlined above, we hypothesize that infant’s in both groups will demonstrate minimal change in the magnitude of the variability in COP displacement as head control and reaching emerge. In contrast, we hypothesize that complexity of the COP displacement will differ over time and between groups during behavior development.
Methods
Postural control involves controlling the body’s position for multiple purposes such as: (a) Orientation, the ability to maintain an appropriate relationship between body segments and the environment or a goal, (b) Stability, control of the center of mass in relationship to the base of support.(21) (c) Preparation for a movement or action, (d) Reaction to an internal or external perturbation. Postural control is a dynamic process which enables an individual to remain in a stable position while interacting with the environment or a task and is therefore, a foundation for most motor skills.(22) Postural control is frequently measured using the center of pressure (COP) at the base of support.(21) The variability in COP displacement over time has been used to assess the variability of postural control in a supine position and during the development of sitting and standing.(23)
In this study, we quantify the magnitude of the variability of postural control using root mean squared (RMS) of the COP displacement. RMS is a traditional reflection of the amount of variability in the COP displacement but does not describe complexity or how the COP is displaced over time. Complexity of the COP displacement can be quantified using Approximate Entropy (ApEN).(11) ApEN quantifies the repeatability or predictability of data patterns within a time series. Thus, ApEN of the COP displacement time series provides a useful indicator of how regular or repetitious the postural control strategies are, which is a measure of the complexity of the postural control system.(2)
Participants
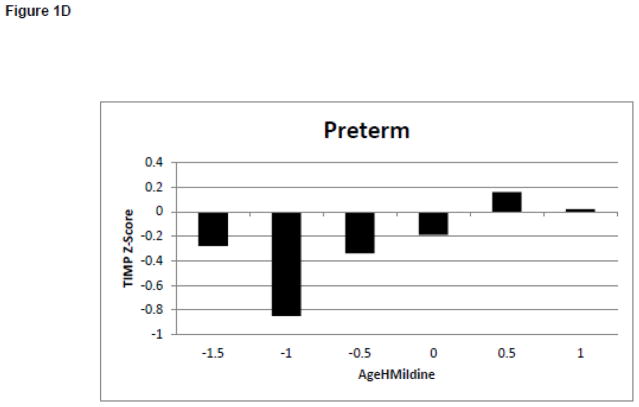
Twenty-three infants born at 32 weeks of gestation or less consented to participate in this longitudinal study. The infant’s mother was required to be 18 years of age or older, live within 1 hour of the hospital, and speak English. Infants were excluded from participation if they had genetic or musculoskeletal complications diagnosed in the neonatal intensive care unit (NICU). Infants were required to be medically stable to begin participation by 6 weeks of adjusted age. Infants were not excluded based on birth weight, neurological injury, or respiratory complication as the purpose of this study was to include at-risk infants. Infants were recruited from an academic medical center with a level III NICU in an urban community. All infants who were admitted to the NICU were screened for eligibility to reduce bias. Parents signed consent for their infant(s) to participate prior to the first study visit and the study was approved by the committee for human subjects. Five of the 23 infants born preterm were dropped from the study as they could not be reached following NICU discharge, resulting in a sample of 18 infants born preterm. (Table 1). The 18 infants born preterm were all at risk for developmental delays based on their preterm birth status.(1) Test of Infant Motor Performance (TIMP) z-scores at 3 months of adjusted age ranged from −3.8 to 1 (mean −0.46±1.2). The average TIMP scores for all but one infant were within 1 standard deviation of the mean. The mean score on the Bayley Scale of Infant and Toddler Development (Bayley) Gross Motor Subtest was 9.6±4.0 at 6 months and 8.4±3.7 at 12 months for the infants born preterm. Two infants born preterm had gross motor scores on the Bayley more than 1 standard deviation below the mean at 12 months. The infant with a TIMP z-score of −3.8 and a Bayley gross motor score greater than 2 standard deviations below the mean did not develop the ability to keep her head in midline or reach. Therefore, this infant was not included in either model described below. In this paper, all ages are presented as adjusted ages for the infants born preterm.
Table 1.
Demographics
| Group (n) |
Gestational age at birth (weeks) M±SD Range |
Birth Weight (grams) M±SD Range |
Twins |
Sex Female (%) |
Race C- Caucasian AA-African American |
NICU LOS (days) M±SD Range |
Medical Dx |
|---|---|---|---|---|---|---|---|
| Full term (22) | 39.5 ±1.1 37.3–41.0 |
3311±499 2322–4037 |
2 | 55% | 86% -C 14% -AA |
0 | none |
| Preterm (18) | 28.3±3.1 24.0–32.0 |
1178±493 480–2435 |
4 | 55% | 5% -C 95%- AA |
83±50 22–164 |
3 – Grade 3/4 IVH 2 – Ventricular Peritoneal shunt 4-Chronic lung Dz |
Data from a comparison group of twenty-two infants born full term (37–42 weeks of gestation) without medical complications from our previous work was used as a comparison group.(11) All infants born full term were typically developing with low risk of developmental delays.
Data Collection Procedures
In order to capture changes in postural control during the development of head control and reaching behaviors, study visits occurred twice per month through 3 months of age and monthly from 3 to 6 months of age. Age was categorically defined and all infants were seen within 5 days of the age for the specified visit. For the infants born preterm, study visits began at 1 month prior to the infant’s anticipated date of full term birth or when the infant was medically stable enough to complete the study visits. Each study visit included assessment of COP displacement and behaviors during 2 conditions, a Toy Condition and a No Toy Condition described below. Developmental assessments were performed to document changes in clinical measures of motor development and developmental outcomes. This study included a total of 208 visits for the infants born preterm including 178 visits assessing postural control at 6 months of age or earlier for an average of 9.8 visits per infant (range of 6–12 visits) and 30 developmental assessments between 6 and 12 months without a postural control assessment. One infant was lost to follow up after the 4 month visit, 1 was excluded from the study after the 4 month visit due to an injury which prohibited further participation, 2 additional infants were lost to follow up between 6 and 12 months. The fragile medical health of some of the infants resulted in 13 missed visits for illness. In addition, 3 visits were missed due to scheduling conflicts. Equipment related errors resulted in data loss for 4 visits. No infants were excluded from the study for having incomplete data. Visits that were cut short due to fatigue were rescheduled within 1–2 days whenever possible.
As in our previous work, COP measurements were completed using a Conformat1 pressure sensitive mat sampling at 5 Hz with the infant in supine for 5 minutes in each condition.(18) The first condition was the No Toy Condition in which the infant was positioned in supine without a visual stimulus or toy for 5 continuous minutes. The second condition was the Toy Condition in which the infant remained in supine and a rattle was suspended over the infant at 75% of the infant’s arm length, midway between the infant’s shoulders. A new toy was presented every minute for 5 minutes to maintain the infant’s interest. Infants were allowed to grasp the toy but not remove it from the examiner’s hand. The entire COP measurement was video recorded from 2 views, lateral and overhead, and synchronized with the COP data. In order to describe the sample, the TIMP was completed for all infant visits between 0 to 4 months of age. (24) The Bayley was completed at 6 and 12 months of age to document developmental outcomes of the infants.(25)
Data Analysis
Video of the COP assessments were used for behavioral coding. Behavioral coding was completed using the MacShapa verson1.1.2a2 coding program and coders trained to 85% agreement with the formula: Agree/(Agree+Disagree)*100. Twenty percent of all visits were coded twice to ensure ongoing reliability.(11) Agreement on behavioral coding variables ranged from 94.4% to 98.3%. HMidline was operationally defined as the percent of the duration of the No Toy Condition in which the infant’s head was within 30 degrees of midline. TContact was operationally defined as the percent of the duration of the Toy Condition in which either of the infant’s hands was in contact with the toy. LegUp was defined as the percent of the duration of the condition in which either leg, from the thigh to the foot, was off the support surface.
The purpose of this study required the comparison of the COP data when all infants were at the same developmental level. Since infants learned to keep their head in midline or reach at different ages, time was described in relation to the onset of the behavior. The first visit in which an infant’s head was in midline at least 50 percent of the No Toy Condition period was reported as the age of onset of head midline (AgeHMidline = 0).(11) One infant born preterm did not meet the Hmidline criteria before 6 months of age and was excluded from this analysis. The first visit at which an infant’s hand was in contact with a toy 15 percent of the Toy Condition period was reported as the age of onset of early reaching in supine (AgeTContact =0).(11) Four infants born preterm were excluded from this analysis as data was not available for the onset of reaching. Two infants were lost to follow up before reaching, one did not demonstrate reaching during data collection but could by parent report, and 1 was unable to reach at 6 months of age during the last assessment of postural control. To compare postural control between visits during the emergence of head control and reaching, COP and behavioral data from 1.5 months before onset to1.0 months after onset were included in the skill specific analysis for this study.(11)
The behavioral coding data was used to identify continuous COP time series in which the infant was in supine, alert, no one was touching the infant and the infant was not touching the toy. As in our previous work, the COP time series of 500 data samples or 100 seconds in length were identified from the data collection period. The dependent variables of RMS and ApEN in the caudal cephalic (cc) and medial lateral (ml) directions were calculated (RMScc, RMSml, ApENcc, and ApENml) for each time series using custom Matlab3 (version 2008a) programs. RMS was calculated as described by Prieto et al.(21) The ApEn was calculated using Matlab code developed by Kaplan and Staffin,(26) implementing the methods of Pincus et al,(27) using a lag value of 1, an r value of 0.2 times the standard deviation of the data file, and a vector length m of 2. The average of all time series of length 500 data samples for each visit and Condition was calculated and used in all statistical analysis. If an infant was unable to stay in a quiet alert state or was in contact with the toy for a large portion of the assessment (preventing the identification of a 500 data sample time series) then no COP data was included for that Condition for that visit. Thus, the number of infants included at each age varies with a mean of 12 infants born preterm included in the No Toy Condition at each age and 9 infants born preterm included in the Toy Condition at each age. Visits prior to 0.5 months of age are excluded from all analysis as there were no data from the full term comparison group and about half the sample of infants born preterm was not medically stable or able to maintain alertness long enough to complete the visits. The number of infants included in the 5 and 6 month visits in the Toy Condition decreased as more infants were in contact with the toy prohibiting collection of the COP data than at younger ages.
Statistical analysis
The dependent variables RMScc, RMSml, ApENcc and ApENml were transformed using a (natural) logarithmic transformation to more closely approximate a normal distribution, Ln(RMScc), Ln(RMSml), Ln(ApENcc), and Ln(ApENml), respectively. All analyses were conducted using these transformed dependent variables. All statistical analysis was completed using SAS® version 9.2.4 A p-value of 0.10 was set in order to reduce the likelihood of a type 2 error during this preliminary study which could result in the research missing a finding which may benefit from additional research.(28) Effect sizes were calculated for all variables using partial eta squared.(29) While there is not a clear consensus of what continues a small, medium, or large effect size using a partial eta squared, one reference suggests that a value of partial eta squared of 0.02 is a small effect, a value of 0.13 is a medium effect and a value of 0.26 is a large effect.(30, 31) This inclusion of the effect sizes allows the reader to interpret the data without regard for sample size and use this data for sample size calculations in future research.
Two mixed linear models were used to address our purpose by evaluating group differences and change in the magnitude of the variability and complexity of the COP time series [Ln(RMScc), Ln(RMSml), Ln(ApENcc), and Ln(ApENml)] during the development of each behavior separately. Each model analyzed data from one condition, included a group term (preterm or full term), time term (AgeHMidline or AgeTContact), and an interaction term (Group*Time). Model one reflected change in the COP measures during the development of head in midline during spontaneous movement without a visual stimulus (AgeHMidline) in the No Toy Condition. Model two reflected change in the COP measures during early reaching behaviors with a visual stimulus (AgeTContact) in the Toy Condition. AgeHMidline and AgeTContact were fitted into the models as categorical variables without assumptions regarding linearity of the model.
Results
Model 1
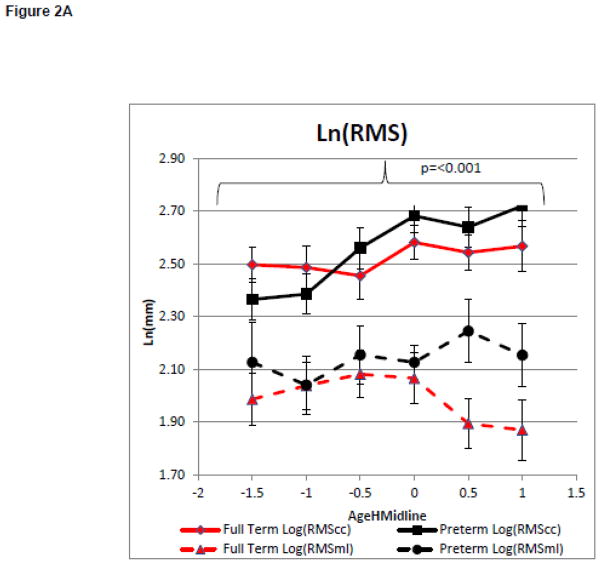
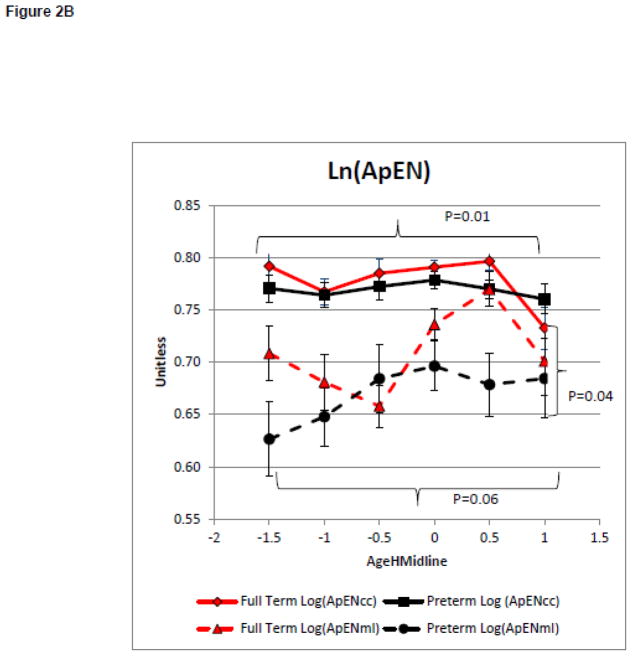
On average infants included in models 1 and 2 maintained their head in midline more than 50 percent of the time in the No Toy Condition at 2.4+ 0.6 months of age for the full term group and 2.7+ 1.2 months of age for the infants born preterm. Model 1 compared the groups change in the magnitude and complexity of postural variability with increasing head control during spontaneous movements in the No Toy Condition. There was no main effect for group on the magnitude of variability as measured by Ln(RMScc) or Ln(RMSml), (F=0.37, p=0.55, partial eta squared = 0.01 and F=2.27, p=0.14, partial eta squared = 0.06, respectively, Figure 1A). However, there was a main effect of AgeHMidline, for Ln(RMScc) but not for Ln(RMSml) (F=5.96, p<0.001, partial eta squared = 0.21 and F=0.43, p=0.83, partial eta squared = 0.02 respectively, Figure 2A). This suggests that the magnitude of the COP displacement variability was influenced by the infant’s head control only in the caudal cephalic direction and did not differ between groups. There was a no significant group effect for Ln(ApENcc). However, there was a significant main effect for group for Ln(ApENml) (F=0.57, p=0.45, partial eta squared = 0.02 and F=4.40, P=0.04, partial eta squared = 0.11 respectively, Figure 2B). There was a significant main effect for AgeHMildine on Ln(ApENcc) and for Ln(ApENml) (F=3.00, P=0.01, partial eta squared = 0.12 and F=2.21, p=0.06, partial eta squared = 0.09 Figure 2B). These findings suggest that postural complexity in the medial lateral direction was influenced by preterm or full term status. Infants born preterm has a lower Ln(ApENml) of less complex COP movement than infants born full term during the development of midline head control (Figure 2B). The postural complexity in both the caudal cephalic and medial lateral direction was influenced by the infant’s increasing head control.
Figure 1.
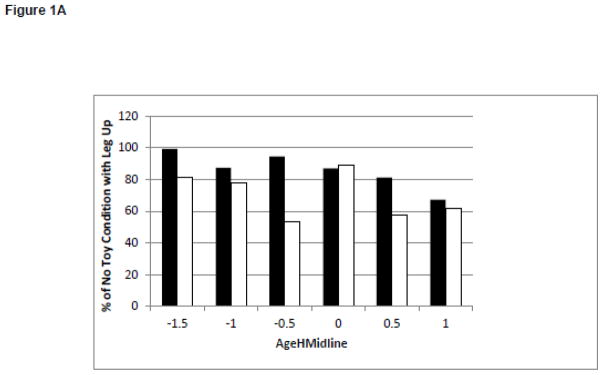
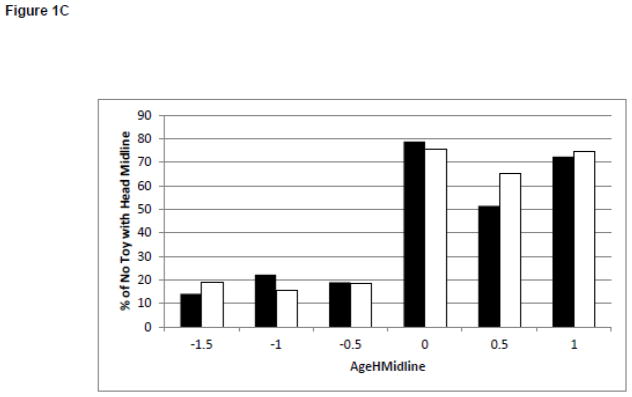
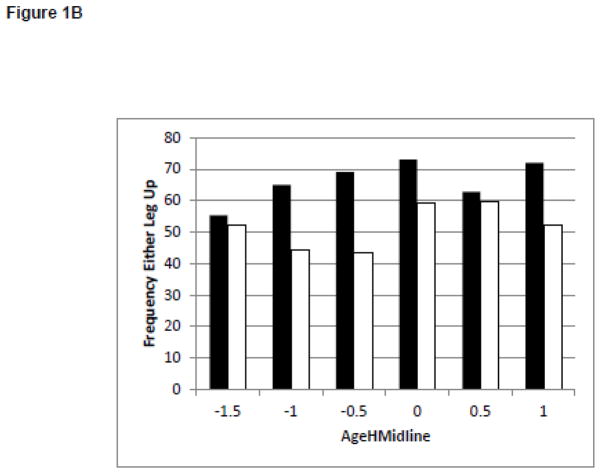
Changes in Behaviors and Test of Infant Motor Performance Scores During the Development of Midline Head Control. White bars represent the infants born full term. Black bars represent the infants born preterm. Figure 1A: Duration of Leg Lift in the No Toy Condition. Figure 1B: Frequency of Leg Lift in the No Toy Condition. Figure 1C: Duration of Headin Midline in the No Toy Condition. Figure 1D: TIMP Z-Score
Figure 2.
Model 1: Postural Control Assessment During Emergence of Head in Midline.
Curves represent the average of the dependent variable for each group. Error bars represent the standard error of the mean. The negative AgeHeadMidline values represent the time when the infant was attempting the skill but was unable to meet to criterion and the positive values represent the month after meeting the criterion.
2A: Magnitude of the Variability of COP Displacement
2B: Complexity of the COP Time Series
Model 2
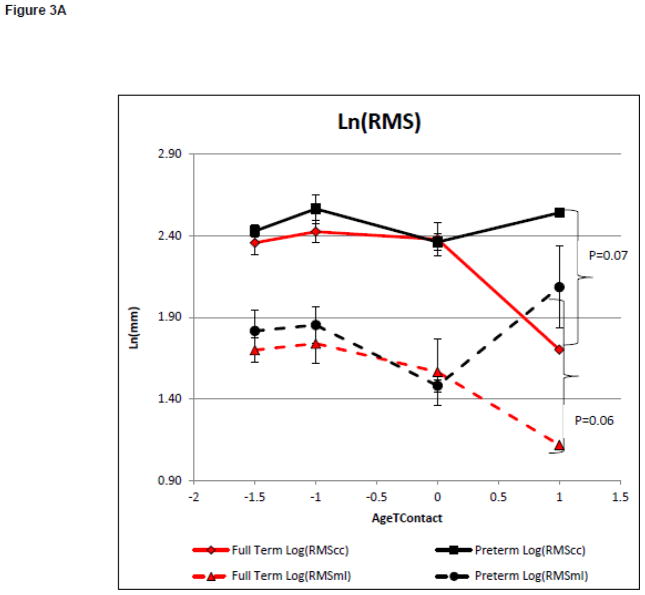
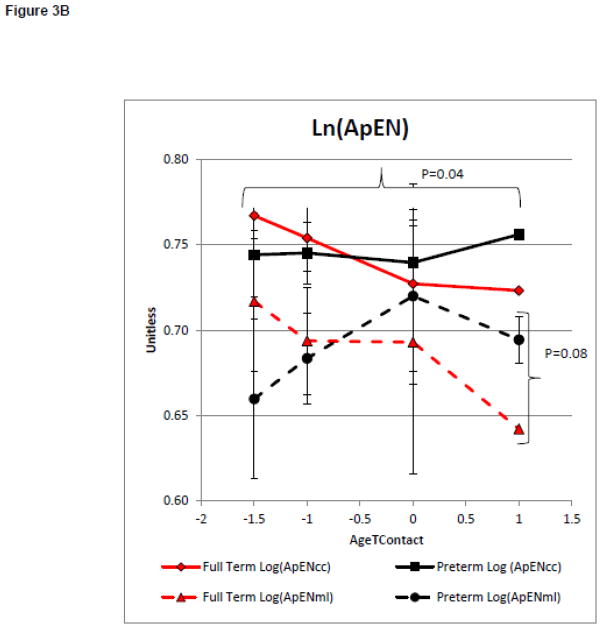
On average infants met the reaching criteria at 4.5+0.9 and 4.7+0.9 months of age for the infants born full term and preterm, respectively. Model 2 evaluated group differences in the magnitude and complexity of postural variability with increasing reaching ability. There was a significant main effect on the magnitude of variability as measured by Ln(RMScc) and Ln(RMSml) between groups (F=3.58, p=0.07, partial eta squared = 0.12 and F=3.74, p=0.06, partial eta squared = 0.12 respectively, Figure 3A). There was no significant main effect on the magnitude of variability as measured by Ln(RMScc) or Ln(RMSml) with increasing AgeTContact, (F=0.38, p=0.82, partial eta squared = 0.08, and F=0.61, p=0.66, partial eta squared = 0.13, respectively, Figure 3A). This suggests that the magnitude of postural variability was not influenced by increasing reaching ability. However, the preterm group had a larger magnitude of postural variability in both directions. There was no significant effect of group on Ln(ApENcc). However, there was a significant group effect on Ln(ApENml) (F=1.73, p=0.20, partial eta squared = 0.06 and F=3.26, p=0.08, partial eta squared = 0.11 respectively Figure 3B). There was a significant main effect of AgeTContact on Ln(ApENcc), but not on Ln(ApENml) (F=3.31, p=0.04, partial eta squared = 0.43 and F=1.00, p=0.43, partial eta squared = 0.19 respectively, Figure 3B). This suggests postural complexity in the medial lateral, but not caudal cephalic, direction was influenced by the group in our small sample of infants born preterm who learned to reach by 6 months of age. However, postural complexity in the caudal cephalic, but not the medial lateral direction, was influenced by increasing reaching ability.
Figure 3.
Model 2: Postural Control Assessment During Emergence of Reaching.
Postural Control Assessment During Emergence of Reaching.
Curves represent the average of the dependent variable for each group. Error bars represent the standard error of the mean. The negative AgeToyContact values represent the time when the infant was attempting the skill but was unable to meet to criterion.
3A: Magnitude of the Variability of COP Displacement
3B: Complexity of the COP Time Series
Discussion
Magnitude of the Postural Variability Between Groups
The magnitude of the variability of the COP displacement provided little insight into the developmental of early behaviors in this study As hypothesized, the magnitude of the postural variability did not differ between groups during the development of head control. A group difference in the magnitude of the postural variability was found in both directions during the development of reaching, with small to medium effect sizes. While there is large group variability and no significant interaction, the groups differed most after the development of reaching. Infants born preterm had a larger magnitude of postural variability than infants born full term. Based on these finding we suggest that the magnitude of the postural variability provides limited assistance in the detection of infants at risk for delayed head control or reaching before a delay is present.
Magnitude of the Postural Variability During Development of Early Behaviors
There was limited change in the magnitude of the postural variability during development of midline head control or reaching. The only significant finding was that infants born full term and preterm sway more in a caudal cephalic direction as they learned to keep their head in midline, but not as they learned to reach. It is possible that this increase in the magnitude of the postural variability is related to behavioral changes such as leg movement. Visual inspection of post hoc behavioral coding of leg lifting suggests little change in the duration of leg lifting. (Figure 1A) However, infants born preterm increase the frequency of leg lifting as they learn to keep their head in midline (Figure 1B) which may contribute to the increased magnitude of the variability in postural sway in the caudal cephalic direction with improved head control.
The above findings are consistent with research which found highly variable changes in the magnitude of the variability in postural sway as sitting emerged as well as limited group differences.(9,19) Our previous work found group differences in RMScc and RMSml at 1–3 weeks of age. However, it did not compare these measures during skill attainment, as was done in this study.(18) Based on the lack of skill dependent changes and limited group differences in the magnitude of the variability, we suggest that this measure alone does not provide enough information to assess the relationship between postural variability and the emergence of behaviors or to predict delays in behavioral skill attainment in infants at risk for disabilities.
Postural Complexity Differences Between Groups
The results of this study provide evidence of impaired postural complexity in infants at risk for developmental delays before postural control or developmental delays are typically detected using routine clinical measures. Consistent with our hypothesis, infants born preterm had lower measures of postural complexity in the medial lateral direction than infants born full term while learning to control the head and learning to reach. Infants born preterm had lower complexity early in the development of head control and had less change in complexity over time (Figure 2B). While these group differences are more notable and statistically significant for the medial lateral direction, a similar non-significant trend of lower complexity in the infants born preterm is noted for the caudal cephalic direction.
The analysis of postural complexity during the development of reaching closely resembles the analysis of the development of head control. The infants born preterm had lower early postural complexity and did not reduce postural complexity in the same way as the infants born full term while learning to reach (Figure 3B).
These findings provide preliminary evidence that reduced postural complexity before the development of midline head control or early reaching may be an indicator of a future delay in these skills. If verified in larger more formal studies, clinical assessment of the postural complexity may help to identify infants who are at increased risk for delays who might benefit from early intervention, before the onset of developmental delays.
Postural Complexity During Development of Early Behaviors
Postural complexity changes during the development of head control and reaching, confirming previous research, suggesting that postural complexity is a valuable tool for measuring developmental changes in postural control. As hypothesized, there was a reduction in postural complexity in the caudal cephalic direction as ability increased for both behaviors and in the medial lateral direction during development of head control. Similar to previous research on sitting, this suggests that the infants had higher complexity early in development and reduced the use of postural complexity as they became proficient in selecting effective postural control strategies.
While there was no significant interaction found between group and skill development in either model, visual inspection of the data suggests with a larger sample, an interaction may be identified. Reduced postural complexity in the infants born preterm is the more pronounced during the onset of each skill. These differences early in development suggest that the infant born preterm did not “try out” large numbers of postural control strategies early in development that the infants born full term did. Specifically, infants born full term utilize multiple postural control strategies while learning to control their head or reach, reflected as higher complexity around AgeHmidline or AgeTcontact of −1.5. We propose that this early experience with multiple postural control strategies allows the infants born full term to select a few efficient strategies to keep the head in midline, thus reducing postural complexity at AgeHmidline or AgeTcontact of 0.0 to 1.0 months. In contrast, the infants born preterm have experience with a smaller number of postural control strategies. Thus, when learning to control the head or reach, the infant born preterm must select from a smaller number of previously utilized strategies. This may result in the infants born preterm only having inefficient postural control strategies to select from or having fewer efficient strategies overall. A complete lack of efficient strategies may impede the infant’s ability to learn new behaviors in the typical manner. A limited number of efficient strategies may impact the infant’s ability to adapt to changing task demands. For example, when presented with a toy that is heavier than expected, an infant who had higher complexity while learning to reach can quickly recall and select a strategy to accomplish the task of holding the heavy toy demonstrating adaptation to the task demands. An infant who had limited complexity and practiced fewer postural control strategies while learning to reach, such as the infants born preterm in this study, may not have an efficient postural control strategy to recall when presented with a heavy toy. Thus, the infant may select a strategy which is inefficient for the task and roll, inadvertently, to the side or drop the toy to prevent instability. This example demonstrates the cascading effect that a lack of early complexity may have on development which is consistent with the Action Perception Theory. As the infant expands its attempts to interact with objects and the environment, the lack of experience with adaptive postural control strategies is likely to result in global developmental delays.
The results of this study provide preliminary findings which support considering a change in intervention for high-risk infants. Our current model of waiting for a delay then providing intervention to teach the missing skills may not meet the needs of these infants. Rather, the identification of early impairments in postural complexity before a delay is present suggests we could treat the underlying lack of postural complexity and possibly overt the delay. While preliminary in nature, this study provides critical information for developing interventions to increase early postural complexity and reducing postural-related developmental delay in this population.
Developmental Outcomes and Treatment Needs
Reduced early complexity was present in the group of infants born preterm before the delays were detected on the TIMP or Bayley.(25, 32) While several infants included in the analysis had developmental delays on the Bayley at 12 months, the relationship between developmental outcomes and the measures of postural complexity in supine was unclear. Individual subject analysis is needed to determine which tools are more effective for identifying infants, which was beyond the scope of this study.
Measures of postural complexity during the development of sitting vary depending on the population studied.(10,19) A recent comparison revealed the infants later diagnosed with cerebral palsy demonstrated fewer postural control strategies compared to infants with developmental delay but not diagnosed cerebral palsy.(19) The infants in this study were too young to receive a definitive diagnosis of cerebral palsy during the study period. This limited our ability to associate the postural complexity results in this study with long-term developmental outcomes. Quantification of decreased postural complexity may identify subtle developmental impairments predictive of disability or may simply identify a difference which will resolve over time. Further research is needed to describe the relationship between postural complexity, behaviors, and developmental outcomes.
Measures of early postural complexity will be helpful in the development of interventions to advance postural control. The infants in this study were considered to be at risk for developmental disabilities, however, many would not have qualified for Early Intervention Services, under Part C of IDEIA(33) until a developmental delay could be measured on a standardized assessment tool. Rather than waiting for a severe, global developmental delay to occur as a result of limited experience with a variety of postural control strategies, we suggest it is possible that intervention could prevent the delay by providing experience with varied postural control strategies in the first months of life based on more specific assessments of postural control complexity.
Study Limitations
As with any study, this study has limitations which should be considered in the interpretation of the results. The infants born full term and preterm were enrolled about 1 year apart from each other and differed in racial and socioeconomic backgrounds. In addition, the higher incidence of medical complications effecting the physiologic state and general health of infants born preterm may have impacted development during the study period. The loss to follow-up in the preterm group and missing data due to illness, scheduling challenges, and inability to complete an assessment due to fatigue reduced our sample size and may have influenced our results. Specifically, the infants who were the sickest and missed or did not complete visits were more likely to be at higher risk for developmental delays. Exclusion of the infant who did not meet the head control and reaching criteria limits our ability to describe postural complexity of an infant with severe motor impairments. Thus, our results may have under estimated actual group differences. The sample size limitations also prohibited an analysis of individual level data and group differences at each time point during skill development. Future research is needed to replicate this study’s findings and complete longer developmental follow-up.
Conclusion
This study provides evidence of group differences in postural complexity in the first 6 months of life. These early postural control differences were related to the development of foundational behaviors suggesting that altered postural complexity influences ongoing skill development, particularly in infants born preterm. Decreased early postural complexity may contribute to not only motor delays but may also limit exploration of the environment impacting cognitive development. Intervention to address these early deficits in postural complexity may be the key to improving outcomes in early infancy.
Acknowledgments
The authors would like to acknowledge Neonatal Intensive Care staff, especially Marty Lewis, at the Children’s Hospital of Richmond, Virginia Commonwealth University Health System and the families who generously allowed us to share in the development of their infants. We also thank the research staff in the Motor Development Lab at Virginia Commonwealth University for their support in this study.
This research was funded in part by the National Institutes of Health (1K12HD055931 and UL1TR000058) and the AD Williams Trust Fund. The funding sources did not contribute to the study design, analysis, or publication of the results.
Footnotes
Tekscan 307 West First St. South Boston, AM 20127-1309, USA
MacSHAPA v1.1.2a Department of Mechanical and Industrial Engineering, University of Illinois at Urbana-Champaign.1206 West Green Street, Urbana, IL 61801
The MathWorks, Natick, MA
SAS Institute INC., Cary NC, USA
All authors declare that they participated in the design, execution, and analysis of the paper by Dusing and colleagues entitled Postural Complexity Differs Between Infant Born Full Term and Preterm During the Development of Early Behaviors
All authors have seen and approved the final version and it has neither been published nor submitted elsewhere. We also declare that I have no conflict of interest, other than any noted in the covering letter to the editor”
See signed documents uploaded as a separate file.
Publisher's Disclaimer: This is a PDF file of an unedited manuscript that has been accepted for publication. As a service to our customers we are providing this early version of the manuscript. The manuscript will undergo copyediting, typesetting, and review of the resulting proof before it is published in its final citable form. Please note that during the production process errors may be discovered which could affect the content, and all legal disclaimers that apply to the journal pertain.
Contributor Information
Stacey C Dusing, Email: scdusing@vcu.edu, Motor Development Lab, Associate Professor, Department of Physical Therapy, Virginia Commonwealth University.
Theresa A. Izzo, Email: tizzo@mcvh-vcu.edu, Virginia Commonwealth University Health System, Richmond, VA, United States.
Leroy R. Thacker, Email: s2lrthac@vcu.edu, Department of Biostatistics, Virginia Commonwealth University.
James C Galloway, Email: jacgallo@udel.edu, Department of Physical Therapy, Biomechanics and Movement Sciences Program, University of Delaware, Newark, DE 21921.
References
- 1.Allen MC. Neurodevelopmental outcomes of preterm infants. Curr Opin Neurol. 2008 Apr;21(2):123–8. doi: 10.1097/WCO.0b013e3282f88bb4. Epub 2008/03/05. eng. [DOI] [PubMed] [Google Scholar]
- 2.Dusing SC, Harbourne RT. Variability in postural control during infancy: implications for development, assessment, and intervention. Phys Ther. 2010 Dec;90(12):1838–49. doi: 10.2522/ptj.2010033. Epub 2010/10/23. eng. [DOI] [PMC free article] [PubMed] [Google Scholar]
- 3.Fetters L. Perspective on variability in the development of human action. Phys Ther. 2010 Dec;90(12):1860–7. doi: 10.2522/ptj.2010090. Epub 2010/10/23. eng. [DOI] [PubMed] [Google Scholar]
- 4.Hadders-Algra M. Variation and variability: key words in human motor development. Phys Ther. 2010 Dec;90(12):1823–37. doi: 10.2522/ptj.20100006. Epub 2010/10/23. eng. [DOI] [PubMed] [Google Scholar]
- 5.Thelen E, Smith LB. A dynamic systems approach to the development of cognition and action. Cambridge, Mass: MIT Press; 1994 1996. [Google Scholar]
- 6.Gibson E. Perceptual Learning in Development: Some Basic Concepts. Ecological Psychology. 2000;12(4):295–302. [Google Scholar]
- 7.Edelman GM. Neural Darwinism: the theory of neuronal group selection. New York: Basic Books; 1987. p. 371. [DOI] [PubMed] [Google Scholar]
- 8.Hadders-Algra M. Variability in infant motor behavior: A hallmark of the healthy nervous system. Infant Behavior and Development. 2002;25(4):433–51. [Google Scholar]
- 9.Harbourne RT, Stergiou N. Nonlinear analysis of the development of sitting postural control. Dev Psychobiol. 2003 May;42(4):368–77. doi: 10.1002/dev.10110. [DOI] [PubMed] [Google Scholar]
- 10.Harbourne RT, Deffeyes JE, Kyvelidou A, Stergiou N. Complexity of postural control in infants: linear and nonlinear features revealed by principal component analysis. Nonlinear Dynamics Psychol Life Sci. 2009 Jan;13(1):123–44. [PubMed] [Google Scholar]
- 11.Dusing SC, Thacker LR, Stergiou N, Galloway JC. Early complexity supports development of motor behaviors in the first months of life. Developmental Psychobiology. 2012:n/a–n/a. doi: 10.1002/dev.21045. [DOI] [PMC free article] [PubMed] [Google Scholar]
- 12.Stergiou N, Decker LM. Human movement variability, nonlinear dynamics, and pathology: is there a connection? Hum Mov Sci. 2011 Oct;30(5):869–88. doi: 10.1016/j.humov.2011.06.002. Epub 2011/08/02. eng. [DOI] [PMC free article] [PubMed] [Google Scholar]
- 13.Pincus SM. Assessing serial irregularity and its implications for health. Ann N Y Acad Sci. 2001 Dec;954:245–67. doi: 10.1111/j.1749-6632.2001.tb02755.x. Epub 2002/01/19. eng. [DOI] [PubMed] [Google Scholar]
- 14.Cavanaugh JT, Guskiewicz KM, Giuliani C, Marshall S, Mercer V, Stergiou N. Detecting altered postural control after cerebral concussion in athletes with normal postural stability. Br J Sports Med. 2005 Nov;39(11):805–11. doi: 10.1136/bjsm.2004.015909. Epub 2005/10/26. eng. [DOI] [PMC free article] [PubMed] [Google Scholar]
- 15.Cavanaugh JT, Kochi N, Stergiou N. Nonlinear analysis of ambulatory activity patterns in community-dwelling older adults. J Gerontol A Biol Sci Med Sci. 2010 Feb;65(2):197–203. doi: 10.1093/gerona/glp144. Epub 2009/10/14. eng. [DOI] [PMC free article] [PubMed] [Google Scholar]
- 16.Soska KC, Adolph KE, Johnson SP. Systems in Development: Motor Skill Acquisition Facilitates Three-Dimensional Object Completion. Developmental Psychology. 2010;46(1):129–38. doi: 10.1037/a0014618. [DOI] [PMC free article] [PubMed] [Google Scholar]
- 17.Berger SE, Adolph KE. Learning and development in infant locomotion. In: Hofsten Cv, Rosander K., editors. Progress in Brain Research. Vol. 164. Elsevier; 2007. pp. 237–55. [DOI] [PubMed] [Google Scholar]
- 18.Dusing S, Kyvelidou A, Mercer VS, Stergiou N. Infants Born Preterm Exhibit Different Patterns of Center of Pressure Movement Than Infants Born at Term. Physical Therapy. 2009;89(12):1354–62. doi: 10.2522/ptj.20080361. [DOI] [PMC free article] [PubMed] [Google Scholar]
- 19.Kyvelidou A, Harbourne RT, Willett SL, Stergiou N. Sitting postural control in infants with typical development, motor delay, or cerebral palsy. Pediatr Phys Ther. 2013 Spring;25(1):46–51. doi: 10.1097/PEP.0b013e318277f157. [DOI] [PubMed] [Google Scholar]
- 20.Corbetta D, Snapp-Childs W. Seeing and touching: The role of sensory-motor experience on the development of infant reaching. Infant Behavior & Development. 2009;32(1):44–58. doi: 10.1016/j.infbeh.2008.10.004. [DOI] [PubMed] [Google Scholar]
- 21.Prieto TE, Myklebust JB, Hoffmann RG, Lovett EG, Myklebust BM. Measures of postural steadiness: differences between healthy young and elderly adults. IEEE Trans Biomed Eng. 1996 Sep;43(9):956–66. doi: 10.1109/10.532130. [DOI] [PubMed] [Google Scholar]
- 22.Goldfield E. Emergent Forms: origins and early development of human action and perception. New York: Oxford University Press; 1995. The action systems. [Google Scholar]
- 23.Fallang B, Saugstad OD, Hadders-Algra M. Goal directed reaching and postural control in supine position in healthy infants. Behav Brain Res. 2000 Oct;115(1):9–18. doi: 10.1016/s0166-4328(00)00231-x. Epub 2000/09/21. eng. [DOI] [PubMed] [Google Scholar]
- 24.Campbell. The Test of Infant Motor Performance: Test User’s Manual Version 2.0. Chicago, IL: Infant Motor Performance Sclares, LLC; 2005. p. 37. [Google Scholar]
- 25.Bayley N. Bayley Scales of Infant and Toddler Development. 3. San Antonio, TX: PsychCorp; 2006. p. 266. [Google Scholar]
- 26.Kaplan DSP. Software for Heart Rate Variability. Macalester College; St. Paul, MN: 1996. [Google Scholar]
- 27.Pincus SM, Gladstone IM, Ehrenkranz RA. A regularity statistic for medical data analysis. J Clin Monit. 1991 Oct;7(4):335–45. doi: 10.1007/BF01619355. [DOI] [PubMed] [Google Scholar]
- 28.Mudge JF, Baker LF, Edge CB, Houlahan JE. Setting an Optimal α That Minimizes Errors in Null Hypothesis Significance Tests. PLoS ONE. 2012;7(2):1–7. doi: 10.1371/journal.pone.0032734. [DOI] [PMC free article] [PubMed] [Google Scholar]
- 29.Bakeman R. Recommended effect size statistics for repeated measures designs. Behavior Research Methods. 2005;37(3):379–84. doi: 10.3758/bf03192707. [DOI] [PubMed] [Google Scholar]
- 30.Wiki MC. Rules of thumb on magnitudes of effect sizes [updated 2013-11-13] Available from: http://imaging.mrc-cbu.cam.ac.uk/statswiki/FAQ/effectSize.
- 31.Yatani Koji. Analysis of Variance (ANOVA) for comparing the means. Available from: http://yatani.jp/HCIstats/ANOVA.
- 32.Campbell, Levy P, Zawacki L, Liao PJ. Population-based age standards for interpreting results on the test of motor infant performance. Pediatr Phys Ther. 2006 Summer;18(2):119–25. doi: 10.1097/01.pep.0000223108.03305.5d. [DOI] [PubMed] [Google Scholar]
- 33.Individuals with Disabilities Education Improvement Act. 2004 http://www.copyright.gov/legislation/pl108-446.pdf.


