Abstract
Previous studies have shown that by minimizing the total variation (TV) of the to-be-estimated image with some data and/or other constraints, a piecewise-smooth X-ray computed tomography image can be reconstructed from sparse-view projection data. However, due to the piecewise constant assumption for the TV model, the reconstructed images are frequently reported to suffer from the blocky or patchy artifacts. To eliminate this drawback, we present a total variation-stokes-projection onto convex sets (TVS-POCS) reconstruction method in this paper. The TVS model is derived by introducing isophote directions for the purpose of recovering possible missing information in the sparse-view data situation. Thus the desired consistencies along both the normal and the tangent directions are preserved in the resulting images. Compared to the previous TV-based image reconstruction algorithms, the preserved consistencies by the TVS-POCS method are expected to generate noticeable gains in terms of eliminating the patchy artifacts and preserving subtle structures. To evaluate the presented TVS-POCS method, both qualitative and quantitative studies were performed using digital phantom, physical phantom and clinical data experiments. The results reveal that the presented method can yield images with several noticeable gains, measured by the universal quality index and the full-width-at-half-maximum merit, as compared to its corresponding TV-based algorithms. In addition, the results further indicate that the TVS-POCS method approaches to the gold standard result of the filtered back-projection reconstruction in the full-view data case as theoretically expected, while most previous iterative methods may fail in the full-view case because of their artificial textures in the results.
Index Terms: Low-dose computed tomography, total variation-stokes, sparse-view, image reconstruction
I. Introduction
In the past several decades, X-ray computed tomography (CT) has been widely used clinically for diagnosis and image guidance for interventions. However, the excessive X-ray radiation exposure during clinical exams has been reported to be linked to increased lifetime risk of cancers in patients [1,2]. Therefore, the issue of radiation dose reduction during the X-ray CT inspection has been raised and received great attention. To our knowledge, two classes of strategies have been widely discussed for radiation reduction: (1) lower the X-ray flux towards each detector bins (by lower X-ray tube current–measured by milliampere-seconds (mAs) or lower X-ray tube voltage–measured by kilovoltage-peak (kVp)); and (2) lower the required number of projection views during the inspection. The strategy of adjustment in mAs or kVp usually leads to noisy projection data at each view and result in inconsistent images compared to the data from normal-mAs or kVp scan. The inconsistency may cause image artifacts. The latter strategy usually suffers aliasing artifacts due to insufficient angular sampling and may also cause image artifacts. As a result, the diagnostic quality of the CT images could be degraded if inadequate methods are applied during the image reconstruction operations. To address these problems, various image processing and reconstruction methods with capability for noise suppression and recovery of missing data have been reported [3–21].
The first method focuses on restoring the ideal line integrals sinogram data (i.e., projection data after log-transformation) from acquired low-mAs (or low-kVp) projection data [3–9,10–12,16,18,19]. The objective of these methods is improving the image quality via either statistics-based sinogram restoration [5,6,9–12] or statistics-based iterative image reconstruction [7,8,16,18]. For example, the noise properties of low-mAs CT sinogram data were studied by analyzing repeatedly-scanned data from a commercial CT scanner and a nonlinear relationship between the sample mean and variance of the acquired low-mAs sinogram data was determined [4,9,18]. The relationship provides reasonable theoretical predictions of the variance of the projection data for statistical CT image reconstruction. Based on the relationship, the CT image can be reconstructed from the acquired low-mAs or low-kVp scans by minimizing the penalized re-weighted least-squares (PRWLS) cost function [12], where the re-weighting is due to the dependence of the variance on the mean because of the non-stationary noise property [16,19]. Such restoration principle can be also applied for sinogram restoration based on the penalized likelihood function [10,11]. A series of general sophisticated CT image reconstruction algorithms were also reported [7,8].
The second method focuses on reconstructing the CT image from acquired sparse-view data with adequate prior information about the desired image [13–15,17,20,21]. In 2006, Donoho proposed the concept of Compressed Sensing (CS) and proved that sparse signals or piecewise images could be satisfactorily reconstructed from far less sampling data than the requirement of the Nyquist sampling theorem [22]. However, for CT image reconstruction, the associated transfer matrix of sparse signals in the transfer domain is less likely to meet the restricted isometry property condition [13,15]. Therefore, an exact implementation of the CS theorem for low-dose CT may not be feasible. An alternative solution, which is called as adaptive steepest-descent-projection onto convex sets (ASD-POCS) method, was invented by Sidky et al. by minimizing the total variation (TV) of the desired image for CT image reconstruction from sparse projection views [13,15]. In their method, both fan-beam and cone-beam artifacts from sparse or limited projection views can be efficiently suppressed compared to other classical methods, e.g., the well-known expectation maximization algorithm. Recently, a more general term of TV, called adaptive-weighted total variation (AwTV) model, was proposed to improve the preservation of edge details by bringing the local information into the above conventional TV model [20]. Besides the ASD-POCS method and its general case: AwTV-POCS method, a prior image-constrained compressed sensing (PICCS) method and Dictionary learning methods were introduced to further reduce the number of required projection views by incorporating prior images or patch information to the CS theorem [14,21]. While good results have been reported from the above TV-based methods, some artificial phenomena have been observed because of the presence of undesired data noise and the use of unsuitable or imperfect prior penalty term. For example, the TV-based image reconstruction results showed some patchy artifacts [17,20,23,24] and Tang et al. claimed that the TV model usually suffers from the staircase and patchy artifacts due to the piecewise constant assumption [23]. This assumption always neglects the smoothly changing voxel values in the desired image which makes the isophote lines in some part of the images were artificially distorted. Those patchy artifacts are misleading and fatal for clinical diagnosis. For example, in lung nodule studies, the patchy artifacts may obfuscate the real lung node with vessels in 2D transverse images.
In order to eliminate the undesired patchy artifacts of the above TV-based methods, a high order derivative model: total variation stokes (TVS) model [25,26], which was aimed to eliminate the patchy artifacts by introducing tangent direction of isophote lines, was adapted in this study for low-dose CT image reconstruction from sparse-view data. To enforce the sparse-view data constraints, we incorporate the POCS strategy [13,15] in our proposed TVS-based reconstruction method, which is called TVS-POCS method hereafter. The TVS-POCS method involves two procedures in its implementation: (1) estimation of tangent field from initial or intermediate images; and (2) image reconstruction with data constraints in the normal field, which is derived from the estimated tangent field. The introduction of the tangent field is corresponding to the utility of an incompressible velocity field to preserve the image consistency along the isophote directions, or more specifically to retain continuous and smooth isophote lines. By imposing the condition that the tangent field is divergence free, the experimental outcome of this study revealed the possibility to recover the missing data in the tangent field, indicating the utility of the CS concept [24,27]. By the same divergence free condition, this study further revealed another gain in recovery of the isophote lines in the tangent field, indicating the more consistency on the isophote lines for continuity and smoothness. Thus, visually pleasant images with smooth regions and continuous boundaries were obtained, where the staircase and patchy artifacts caused by the over-smoothing along the normal directions in the above TV-based approaches were efficiently mitigated.
The remainder of this paper is organized as follows. In Section II, the TVS model is briefly reviewed and its associated minimization functions are presented. In Section III, the TVS-POCS method for reconstruction is proposed and the algorithm for solving the TVS-POCS minimization problem is described. In Section IV, experimental results are reported. Finally, discussions and conclusions are given in Section V.
II. TVS Model
For simplicity, the model presentation is given in a two-dimensional (2D) space. For a given 2D image f(µ), where µ is the desired attenuation coefficient in CT image, two orthogonal vectors in the image domain, i.e., the normal vector n and the tangent vector τ of the image, are mathematically defined as:
and
| (1) |
where ∇ denotes the differential operator, T represents the transpose operator, and ∇⊥ is the orthogonal differential operator, subscripts x and y are the indices of the directions of the attenuation coefficients. According to the connection between the isophote direction of the image and the fluid velocity in Navier-Stokes equation [27], the two vectors should satisfy the irrotationality and incompressibility conditions respectively, which can be mathematically expressed as:
| (2) |
where the left equation, i.e., the cross product of the differential operator and the normal vector n equals zero, shows the curl of the normal vector is zero, which indicates that the normal vector is a conservative vector field and correspondingly the image vectors have continuous gradient (i.e., normal vectors) changes. The right equation, i.e., the dot product of the differential operator and the tangent vector τ equals zero, shows the divergence of the tangent vector is zero, which guarantees that there always exists an image such that its isophote directions are restored vectors for the image consistency. The above two equations indicate the potentials for smoothly changing pixels across an image with preservation of edge details via restoring the missing data along the isophote directions [25]. Therefore, the image could be reconstructed by solving the steady equation with constraints from Eq. (2).
Inspired by previous studies [25,26], the steady equation could be achieved by minimizing the TVS of the desired image. Therefore, instead of directly minimizing the TV norm of the desired image as we did in TV-based method, we minimize the TV norm of the tangential vector with the incompressibility constraints. This tangent field estimation (hereafter called the “TFE”) can be mathematically calculated by:
| (3) |
where i denotes the indices of the pixel of the desired image with N pixels.
Based on the definition of TV, the Eq. (3) is convex [13]. One simple way to solve such partial differential equations is described in [28] by using the augmented Lagrangian (AL) method, where it is claimed that the recently proposed dual method [29] and the split Bregman iteration method [30] can be either deduced from or equivalent to the AL method. Thus, the cost function for (3) can be further written as:
| (4) |
where λ denotes the Lagrange multiplier to deal with the constraints and β represents a penalty parameter. In this study, inspired by previous work in [25], we let β=1. By solving the Eq. (4), the saddle point of this optimization problem should meet the following conditions,
| (5) |
| (6) |
The gradient-descent method is utilized to calculate the solution of (5) and (6) by introducing an artificial step variable t1:
| (7) |
| (8) |
For description purpose, we defined the following operators and vectors:
Define the forward/backward difference operators along x and y directions as and;
Define the centered difference operators along x and y directions as and, where h corresponds to the order of neighbors of the central pixels. In this study, we set h=1;
Define the average operators (i.e., average of the nearby pixels, e.g., the four neighbors in 2D case) along x and y directions as Mx and My;
- Define a vector ( u, v) as:
and(9)
Then, the values of the variable u, v and λ at step n+1 can be calculated from:
| (10) |
| (11) |
| (12) |
| (13) |
| (14) |
| (15) |
ε1 is a relax parameter introduced to avoid the denominator going to zero, and t1 was defined before as an artificial step variable to control the updating step length.
Once we have the estimated isophote lines from the TFE step, we can use them as a prior knowledge for recovering the desired images. However, it is impossible to directly utilize this efficient method to CT image reconstruction because there is no such prior image available for isophote lines estimation. To overcome this shortage, a novel TVS-POCS method which combines the CT image modeling and TVS model to solve the CT image reconstruction from sparse-view data problem is detailed in the following section.
III.CT Image Reconstruction from sparse-view Data
A. Image modeling
In realistic CT imaging, the acquired data and the desired image are often assumed to satisfy the following linear equations:
| (16) |
where P denotes the discrete projection data, A stands for the projection matrix and [ Aµ]j is the mean of data at detector bin j. In this study, due to the sparse-view sampling in projection domain, the linear equations are under-determined. Thus, it is very difficult to directly solve such inverse problem. In [13], the author investigated a general iterative scheme to solve linear equations by successive and repeated applications of several projection operators, which is called as POCS method later [13]. This step is basically the operation of the well-known Algebraic Reconstruction Technique (ART). For illustration purpose, we adopt the Simultaneous ART (SART) [31,32] to solve the under-determined linear system of (16). More specifically, the SART algorithm is used to yield an image estimate from the initially estimated image by minimizing the distance between the measured and estimated projection data. The associative update scheme can be described as follows:
| (17) |
| (18) |
| (19) |
| (20) |
where M was defined as the total number of image voxels and N is the total number of data samples. ω is a relax parameter for updating the current estimate of the image. k indicates the iterative number. p̄(µ) is the re-projected data from the current estimation of the desired image. Due to the transform matrix A is an under-determined linear system (i.e., N<M), there are multiple solutions for Eq. (16). As discussed in [13–15], an adequate object function is desired to formulate a constrained optimization problem, which can produce a unique solution. In this part, we assume the normal vector of the desired image should be consistent with the TVS model described above. Thus, a TVS model based TVS-POCS method is proposed and discussed in the following section.
B. The present TVS-POCS method
Inspired by the computational advantages of the two-step iterative framework for minimization of dual condition problems as introduced in [25,26] for image denoising and inpainting, we adapted the framework in this work to address the CT image reconstruction problems from sparse-view data. The desired image is reconstructed by fitting the normal vector of the desired image to the computed normal image with constraints from data fidelity. This step is called as image reconstruction (hereafter called “IR”) step. Mathematically, this is achieved by solving the following minimization problem:
| (21) |
In this equation an error tolerance parameter σ2 is introduced to denote the inconsistency in acquired projection data due to noise. After obtaining the restored tangent vector τ* from TFE step (i.e.,Eq. (3)), the corresponding optimized normal vector n* are calculated for low-dose CT image reconstruction. Then the desired image’s normal vectors shall fit the computed normal vector n* with constraints from the data fidelity. According to the description in ASD-POCS method [15], we consider the objective function (i.e., the left formula of (21)) and the constraints (i.e., the right formula of (21)) separately for image reconstruction after the normal vectors n* are calculated.
The objective function can be written as:
| (22) |
Note that the minimization of Eq. (22) is non-convex and difficult to solve numerically. Inspired by the similar idea in [33], a numerical approximation was introduced in the iterative formula to ensure the convexity of the minimization problem. The minimization of this Eq. (22) can be performed by the Euler-Lagrange (EL) method. The corresponding set of EL equations for the saddle point is:
| (23) |
According to [25], the updating scheme of (23) can be mathematically expressed as:
| (24) |
where
| (25) |
| (26) |
and
| (27) |
where ε2 and ε3 were two relax parameters introduced to avoid the denominator going to zero, t2 is an artificial step variable.
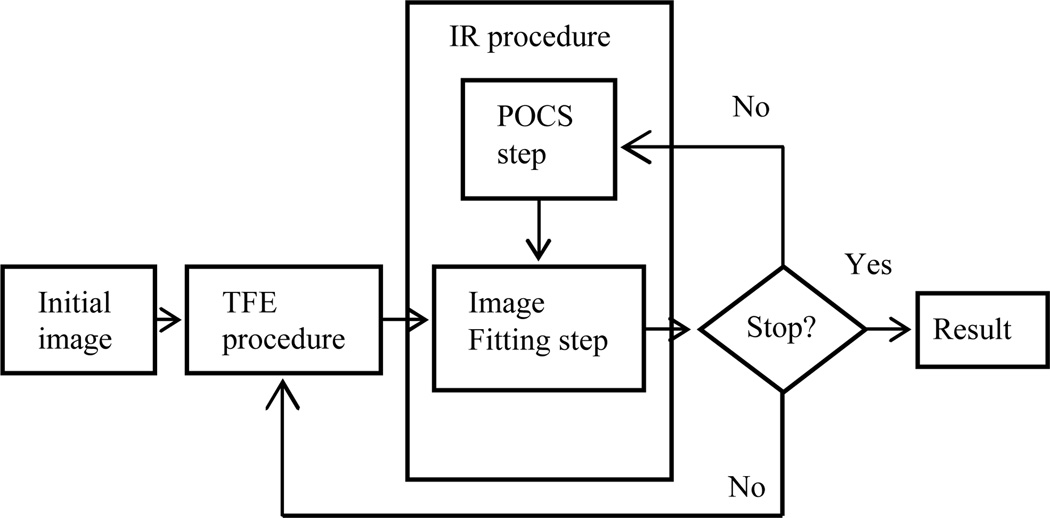
The constraints in Eq. (21) reflect the data modeling and were solved by using the POCS strategy. However, directly utilizing the two-procedure framework (i.e.Eqs. (3) and (21)) may not be feasible due to the lack of prior image. Therefore, in this study, the desired image was obtained by performing the above two procedures (i.e., TFP step and IR step) in an alternating fashion until a stopping criterion is satisfied. The flowchart for TVS-POCS method is described in Fig. 1 and the corresponding details of the two-step implementation are given below.
Figure 1.
The flowchart of the TVS-POCS method.
C. Pseudo-code of the TVS-POCS reconstruction algorithm
The pseudo-code for the presented TVS-POCS image reconstruction algorithm is listed as follows:
| 1: | initial: µ(0) | |||
| 2: | initial: Δ t1, Δ t2, ε1, ε2 and ε3; | |||
| 3: | caculate the initial vectors u and v from µ(0); | |||
| 4: | while stop criterion is not met; | |||
| 5: | for n =1,2,…, N; (TFS) | |||
| 6: | calculate τn,
|
|||
| 7: | end for; | |||
| 8: | for j 1, 2,…, J; (POCS) | |||
| 9: | if j==1; | |||
| 10: | µ(j):=SART(µ(0),ω); | |||
| 11: | else µ(j) :=SART(µ( j-1),ω); | |||
| 12: | end if; | |||
| 13: | end for; | |||
| 14: | if, then | |||
| 15: | else | |||
| 16: | end if; | |||
| 17: | for i = 1, 2,…, I; (Image Fitting) | |||
| 18: | calculate n1, n2, | |||
| 19: | |
|||
| 20: | end for; | |||
| 21: | end if stop criterion is satisfy. |
In line 1, an initial estimate of the to-be-reconstructed image is set to be uniform ones. In line 2, five parameters, Δ t1, Δ t2, ε1, ε2 and ε3, are initialized before iteration starts. The selection of parameters will be discussed in next section. In line 3, the initials of two vectors (i.e., u and v) are calculated from the initial image values. Each outer loop (lines 4–21) is performed by two separated parts, i.e., N TFE steps for tangential vector estimation (line 5–7) and IR step which contains J POCS steps (lines 8–16) and I image fitting steps (lines 17–20). In line 21, an adequate stop criterion is selected to stop the iterations.
D. Parameter selection
1) Selection of the iteration numbers for sub-iterations
The selection of iteration number for each sub-iteration step is important for obtaining satisfies results in an efficient time. Although, a large number of iterations can ensure that a converged solution is obtained, it may take a long time. Due to the characteristic of two step iterative framework, adequate number of the TFE iteration in each general loop is usually enough to give us an intermediate solution for performing the following IR step.
In the IR step, inspired by the similar idea as proofed in [15], several steps in image fitting steps were performed to nudge the image toward the TVS solution. In order to yield the image within the feasible region, the parameters and step number selection in POCS step were following the instruction described in [15].
2) Selection of the artificial step variables Δ t1 and Δ t2
Similar to other optimization problems, the artificial step variables Δ t1 and Δ t2 control the step lengths of the updating procedure. Clearly, a too large step length would unavoidably increase the variation of the solution, resulting the cost function may not converge steadily. On the other hand, a too small step length will require a large number of iterative cycles to reach a steady value, which will unavoidably increase the computational time. Thus, how to choose adequate optimal parameters is an important issue.
In our experimental studies, we found the results were less sensitive to the value of Δ t1. For all reconstruction cases, the value range 1×10⁻⁷ ≤ Δ t1 ≤ 1×10⁻⁶ has always led to convergence of the estimated tangent vectors. The Δ t2 value affected the smoothness of the computed normal vectors, and its selection was related to the noise level and sampling rate of the projection data. A less smooth normal vector requires a smaller value of Δ t2, vice versa. The selection of Δ t2 values will be reported for difference cases in the following section.
3)Selection of the relax parameters
In order to ensure that the denominators would not go to zero, ε1, ε2 and ε3 were introduced as relax parameters. It should be mentioned that the ε1, ε2 and ε3 may have different values due to the different scales of the different denominators (i.e.,Eq. 10,11,25 and 27). In this study, we manually choose them equal to the same value 10−9, which is small enough for all the denominators.
4) Selection of the stop criterion
The selection of the stop criterion often depends on the convergence of the desired algorithm. In this study, the mean-square-errors (MSE) metric, which calculates the similarity between the resulting image and true image, was used to measure the quality of the desired image. The MSE is defined as follows:
| (28) |
where f̂ (µi) represents the true attenuation coefficient at pixel i and f (µi) denotes the reconstructed attenuation coefficient at pixel i, N is the total number of pixels of the desired image. A small MSE value indicates a small difference value between the two images and vice versa. In this study, we stop the reconstruction process when the change of the reconstructed image becomes very small. Therefore, when MSE is small enough, the reconstruction is stopped.
E. Other experiments’ settings
To validate and evaluate the performance of the presented TVS-POCS method, the ASD-POCS method described in [15] and the AwTV-POCS method investigated in [19] were adopted for comparison purpose. The optimization principle for ASD-POCS method can be mathematically described as:
| (29) |
where in the TV of image, i.e., ‖µ‖TV is defined as:
| (30) |
x and y are the indices of the directions of the attenuation coefficients [15].
The AwTV model was implemented by incorporating a diffusion-type weighting coefficients in the conventional TV model:
| (31) |
where
| (32) |
and
| (33) |
where δ in the weights ( wx,x-1, y,y and wx, x, y, y-1) is a scale factor which controls the strength of the diffusion during each iteration [19]. The optimization function of the AwTV-POCS is: given as follows:
| (34) |
The relative parameters and stop criterions of the ASD-POCS and AwTV-POCS methods will be reported for difference cases in the following section.
IV. Experimental Design and Results
In this work, three types of data (computer simulated digital phantom projection data, experimental physical phantom projection data, and patients’ projection data) were used to evaluate the proposed TVS-POCS method with comparison to the previous TV-based ASD-POCS and AwTV-POCS algorithms. The well-known filtered back-projection (FBP) reconstruction was performed and its output was set as the reference wherein that from the full-view data was used as the gold standard. In the simulation study, a modified Shepp-Logan mathematical phantom was used for simulating the sparse-view projection data. Because the digital phantom and data generation are known, the difference of different reconstruction algorithms is expected to be clearly seen in their associative results. In the physical phantom study, a set of cone-beam projection data of the CatPhan® 600 phantom was acquired for experiments. The physical phantom data acquisition may bring in some uncertainty, but the uncertainty shall not render a different outcome from that of the simulation study. In the patient study, the projection data acquired from a patient, after the informed consent, was used to perform a pilot clinical study.
A. Shepp-Logan digital phantom study
1) Data simulation
In the digital phantom study, the Shepp-Logan phantom was modified based on the mass attenuation coefficients of different tissues in the objects as indicated in [20]. For simplicity, without loss of generality, a parallel-beam CT imaging geometry was used for sinogram data simulation. This geometry was modeled with 1024 bins on a 1D detector for 2D image reconstruction, and several sets of projection data with different numbers of views, i.e., 20, 40 and 60, were simulated at equal angular increment on 360 degrees around the phantom. The distance between the centers of two neighboring detector elements or bins is 0.25mm and pixel size is 0.5mm×0.5mm. For the purpose of focusing on the sparse issue for low-dose CT imaging, no noise was considered in the noise-free cases (i.e., ideal cases). In order to further analyze the robustness of the proposed method for controllable noise, a Poisson distributed quantum noise plus Gaussian distributed electronic noise were introduced to simulate noisy transmission data as indicated in [18,20]. The noisy transmission data at each view were simulated at low dose level, i.e., 120 kVp and 40 mAs [18,20]. Then the transmission data were converted to sinogram data by the use of the Lambert-Beer’ law [20].
2) Parameter selection
For the TVS-POCS method, sufficient iterative cycles were executed to ensure its convergence to a stable solution, where each of the iterative cycle consisted of 40 TFE iterations, 10 POCS iterations and 50 image fitting iterations. In both noise-free and noisy cases, Δ t1 was selected as 1×10⁻⁷. Since the noise levels are different in the ideal and low-mAs data acquisitions, Δ t2 was set to 6×10⁻⁵ for noise-free cases and 8×10⁻⁵ for noisy cases. For the ASD-POCS and AwTV-POCS algorithms, each of their iterative cycles included 10 POCS iterations and 10 gradient descent iterations. The initial value of ω and τ were set as 1 and 0.7×10⁻⁵, respectively. The scale factor used in the AwTV model [20] was set to 0.6×10⁻². The stop criteria of ASD-POCS and AwTV-POCS algorithms were the same as discussed in [20]. For the FBP method, the Hanning window at 0.5 Nyquist frequency cutoff was implemented to suppress the high frequency noise.
3) Convergence analysis
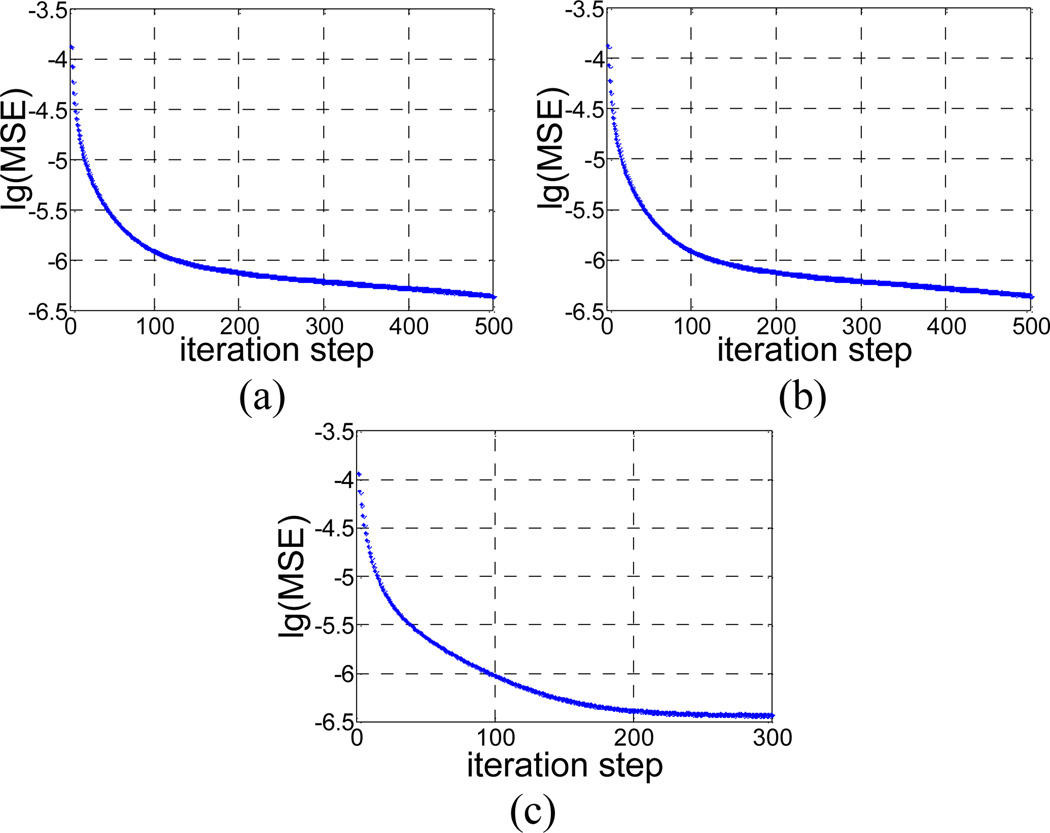
Due to the alternating minimization framework, it is challenging to prove the convergence of the present TVS method. Although, each procedure monotonically decrease the objective functions, respectively [25,26], it does not mean the convergence of the reconstruction process. Inspired by the similar idea as the adaptive dictionary based statistical iterative reconstruction (ADSIR) method in [21], with appropriate parameters selection, our proposed algorithm indeed yielded a steady state.Figure 2 shows the lg( MSE) versus the iteration steps for the proposed TVS method from 20, 40 and 60 projection views in noise-free cases, respectively. We can observe that the proposed algorithm can converge to a steady status (i.e., lg( MSE) =−6.3) after enough iteration steps in term of MSE measure. In addition, the convergence speed was accelerated as the number of projection views increased with the fixed parameter settings. For example, the lg( MSE) value converged to a small level at about 500th step for the case of 20-views, meanwhile for the case of 60-views, only about 200 steps were needed. The results demonstrated that with appropriate parameters selection the present algorithm can successfully minimize the objective functions with a satisfactory solution in different cases.
Figure 2.
lg( MSE) v.s. iteration steps: (a) 20 projection views; (b) 40 projection views; (c) 60 projection views.
4) Universal quality index study
To perform the quantitative analysis of the TVS-POCS method in the digital phantom study, the universal quality index (UQI), which measures the similarity between the desired image and its baseline image were studied in this section for both noise-free and noisy cases [23]. Three factors, i.e., loss of correlation, luminance distortion and contrast distortion are considered in the UQI indices [34]. Let f0(µ) denote the true image used as the baseline image, and f1(µ) denote the resulting or testing images, and then the mean, variance and co-variance in a ROI with N′ pixels are defined as [24]:
| (35) |
| (36) |
| (37) |
Then, the UQI is defined as:
| (38) |
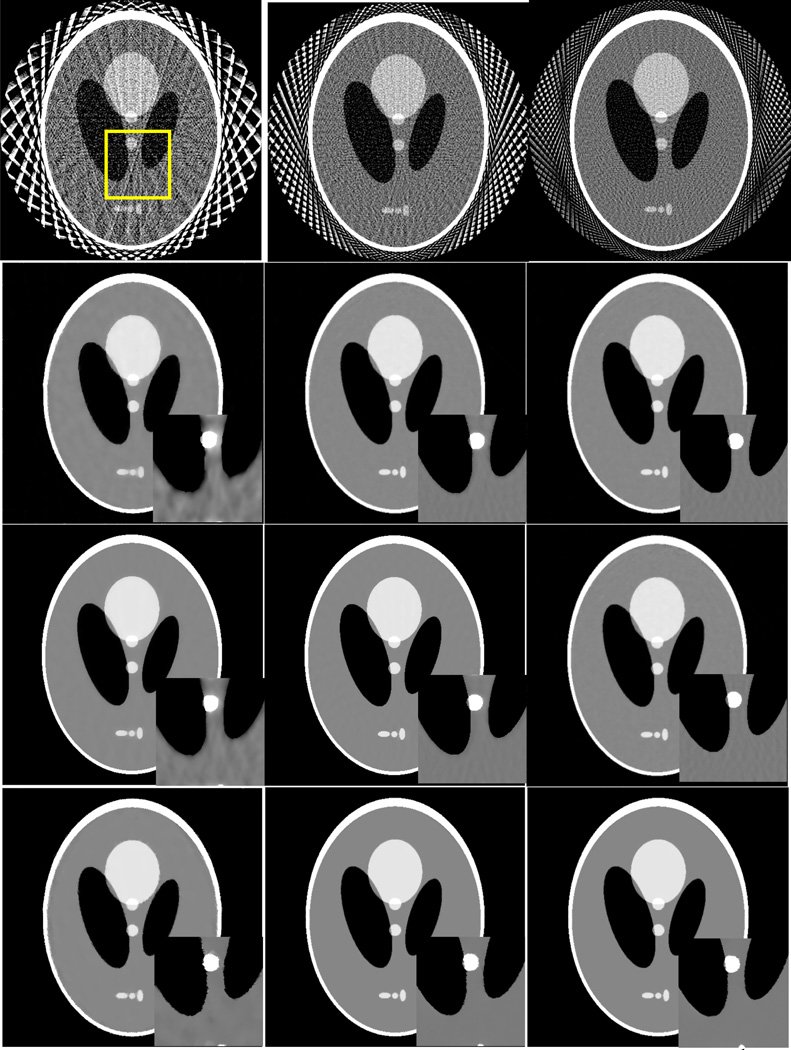
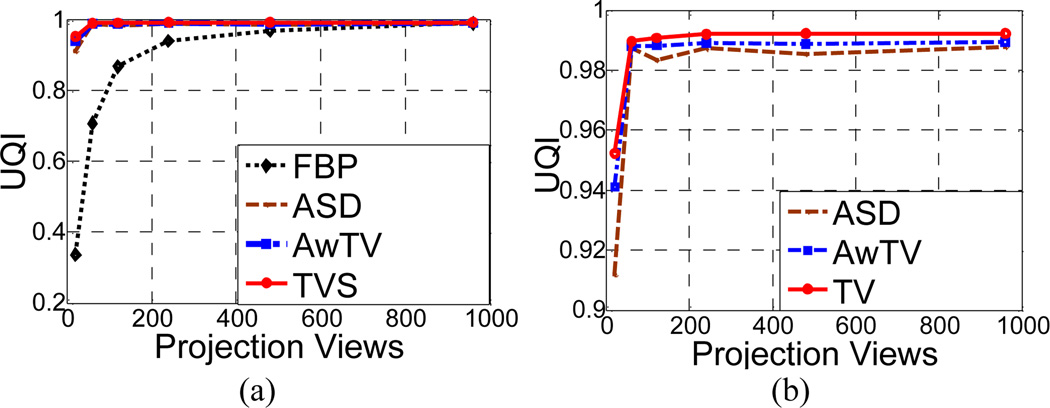
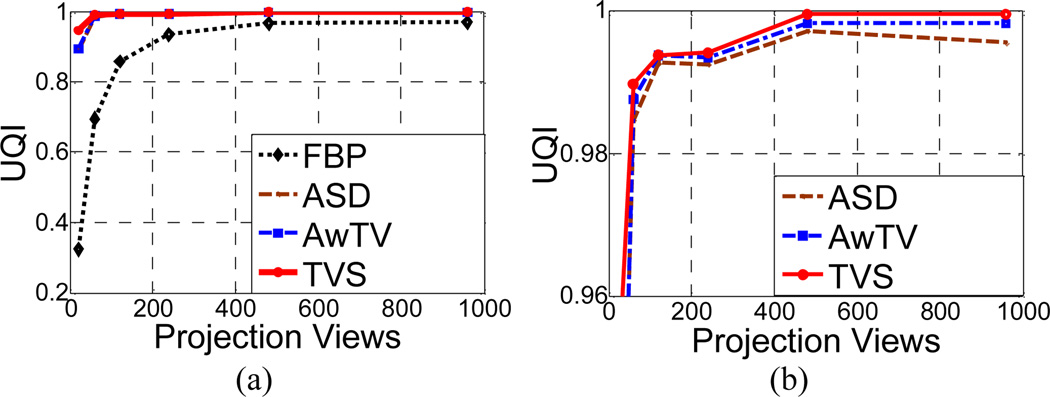
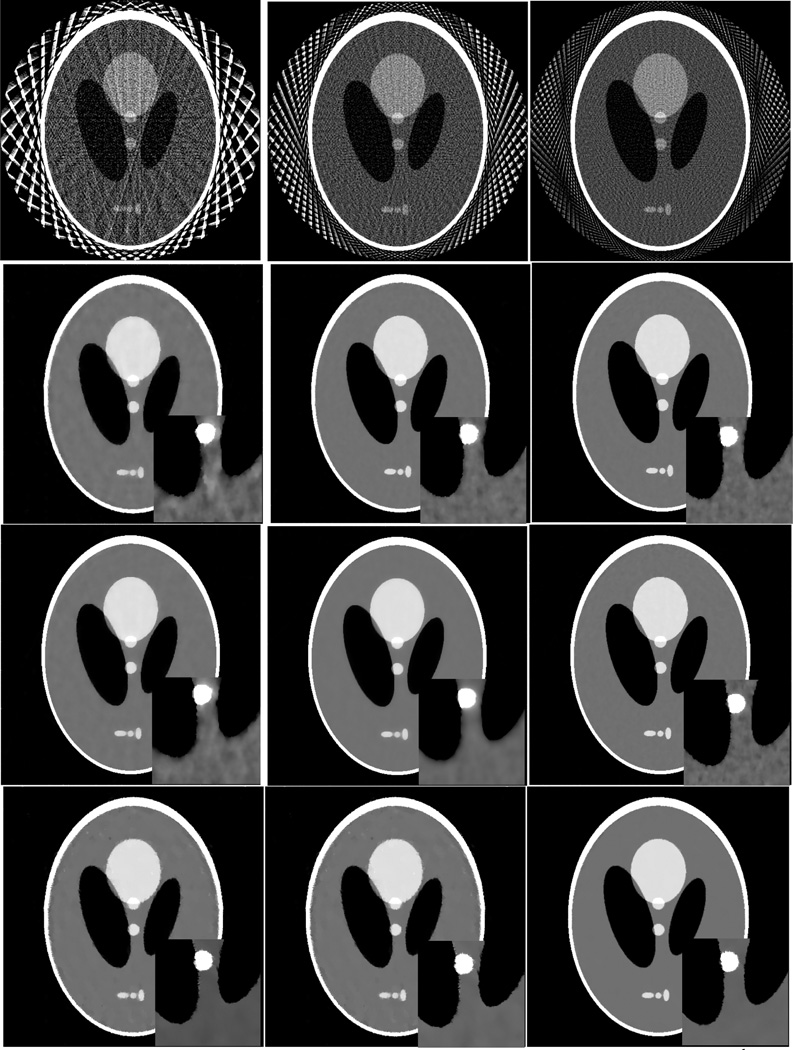
By definition, the range of UQI values is between zero and one. A higher UQI value indicates a higher similarity between the testing image and the baseline image, and vice versa. The ROI which contained multiple edges as indicated by a rectangular window in Fig 3 was selected to calculate the UQI values. The curves of UQI values versus the number of projection views for the noise-free case are shown in Fig. 7.
Figure 3.
The images reconstructed by FBP (1st row), ASD-POCS (2nd row), AwTV-POCS (3rd row) and TVS-POCS (4th row) algorithms from 20 (left column), 40 (middle column), and 60 (right column) projection views in noise-free cases, respectively. The display window is [0, 0.0034] mm−1 for the full field of view (FOV) images and is [0.0013, 0.0018] mm−1 for the ROI images.
Figure 7.
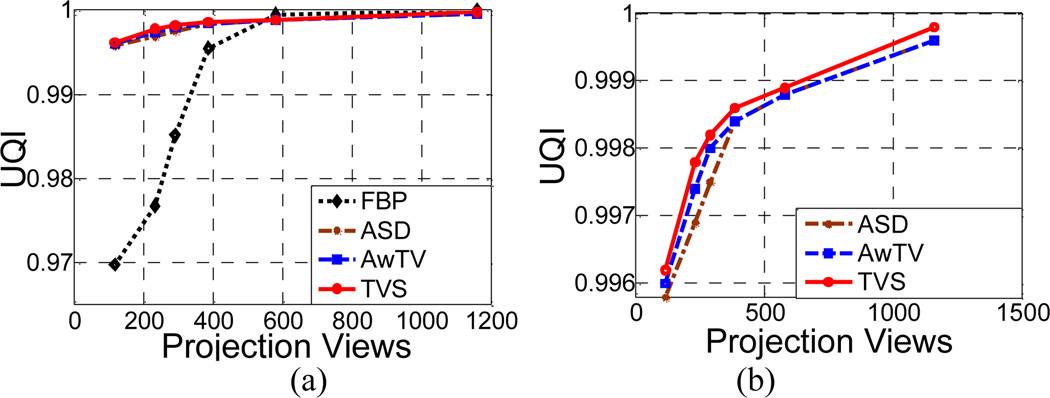
UQI study in the noise-free case: (a) The UQIs versus the number of projection views; and (b) zoom-in views of (a) for ASD/AwTV-POCS and TVS-POCS comparison.
In the full-view case (i.e., >= 960 views), the UQI values of all the three methods (two TV-based ones plus the TVS-POCS) approached to that of the FBP result, which has the highest UQI value as expected by theory and therefore was set as the gold standard as the number of projection views were sufficient large. As the number of projection views decreased, the results from three methods are much closer to the true image as compared to the FBP results in the sparse-view cases, which are consistent with the CS theory. In order to visualize the difference among the ASD/AwTV-POCS and TVS results, a zoom-in view of Fig. 7(a) is shown in Fig. 7(b). From this figure we can observe that TVS curve is the closest one to the gold standard among the three methods. Thus, we can conclude that the TVS method can be more likely to produce matching results compared to the TV-based ASD/AwTV-POCS methods in the sparse-view noise-free cases. Besides the overall comparison of the three methods’ curves, we also observed small ripples from the ASD-POCS results at 480 and 120 views, which indicated that the ASD-POCS method introduced some undesired textures (i.e., patchy artifacts) in these sparse-view cases. However, the UQI curve from the TVS method monotonously decreased as the number of projection views decreased, which indicated a better performance in the sparse-view cases.
In the noisy cases, the curves of the UQI values versus the number of projection views are shown in Fig. 8. From this figure, we can observe that the curves have very similar trends as the curves in the noise-free cases shown in Fig. 7. The results demonstrate that the TVS method yields noticeable gains in this UQI study for both noise-free and noisy cases compared to the FBP and ASD/AwTV-POCS methods.
Figure 8.
UQI study in the noisy case: (a) The UQIs versus projection views curves; (b) zoom-in views of (a) for ASD/AwTV-POCS and TVS-POCS comparison.
B. Catphan® 600 physical phantom study
To further evaluate the performance of the proposed TVS-POCS method with comparison to the TV-based ASD/AwTV-POCS algorithms in a more realistic environment, we conducted a CatPhan® 600 physical phantom study. Compared to the simulated noisy projection data in the digital phantom study, the physical phantom projection data contain more complex and unpredictable noise coming from the X-ray source, detectors and system electronics, etc., and are more close to the projection data acquired at clinics.
1) Data acquisition
In this physical phantom study, cone-beam CT projection data were acquired by the Ancuity Simulator (Varian Medical System, Palo Alto, CA) [35] and the central slice of the sinogram data was extracted for the following 2D investigation for illustration purpose. The X-ray tube current was set to be 80mA and the duration of the X-ray pulse at each projection view was 12ms. A total of 634 projection views were acquired for a fully 360-degree rotation on a circular orbit. The source-to-axis distance was 100cm and source-to-detector distance was 150cm. The pixel size in the reconstructed image is 0.776×0.776mm3. The array size of the reconstructed image is 350×350. Sixty-three projection views were evenly extracted from the total 634 projection views to simulate a sparse-view data. Other numbers of projection views can be chosen to simulate different degrees of sparsity.
2) Parameter selection
For the TVS-POCS method, each of the general iteration consisted of 40 TFE iterations, 10 POCS iterations and 50 image fitting iterations. The stop criteria (i.e., lg( MSE) between the images from current step and previous step) was set to be −8.5, which made the iterative process stop at the 97th iteration. The parameters were set as: Δ t1 =1×10⁻⁷, Δ t2 =1×10⁻⁶. For the ASD-POCS and AwTV-POCS algorithms, each of the general iteration contained two POCS iterations and 12 gradient descent iterations as indicated in [20]. The indicator factor cα defined in [20] was set to be −0.6 for the AwTV-POCS algorithm and −0.5 for the ASD-POCS algorithm, and both values were used as stop criteria to ensure a steady solution. The initial step length was 0.5 for the POCS iteration and 1.2×10⁻⁴ for the gradient descent step. The scale factor was set to 0.6×10⁻² for the AwTV model. The reconstruction by the FBP method with Hanning window at 0.8 Nyquist frequency cutoff, which treated the noise at each projection view satisfactorily, was generated as the reference image.
3) Visualization-based evaluation
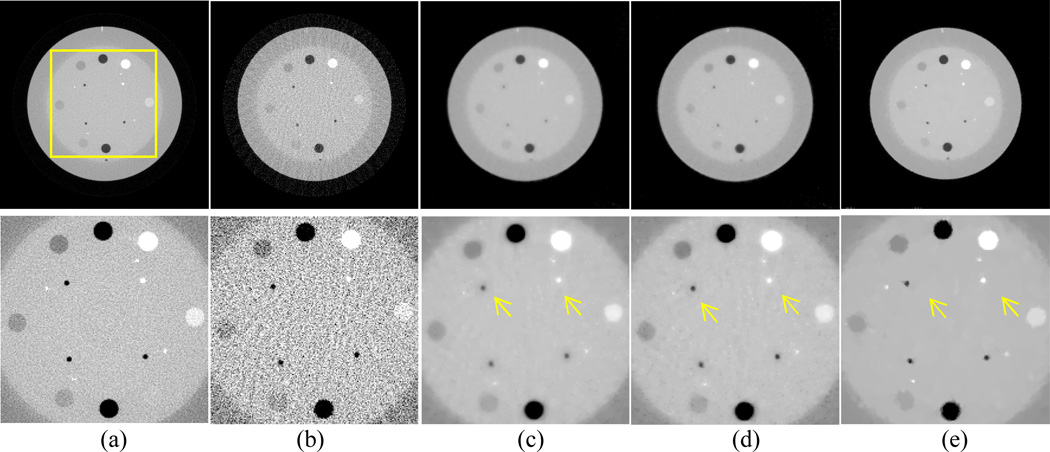
Figure 9 illustrates the physical phantom results from different methods. It can be seen that all the three methods (ASD/AwTV-POCS and TVS-POCS) produced much better images as compared to the FBP method in the sparse 63-views case. Compared to the gold standard image of the full-view FBP reconstruction, the FBP result in the sparse 63-view case suffered from severe artifacts due to the low sampling rate and noisy data measurement. The ASD/AwTV-POCS algorithms suffered from the artifacts in a less degree. In the zooming ROI images at the bottom of this figure, the TVS-POCS result shows a very pleasant image quality. Compared to the ASD/AwTV-POCS results, the TVS-POCS result is smooth in the uniform area and has better contrast on both hot and cold spot as indicated by the arrows in Figs. 9(c), 9(d) and 9(e). It should be mentioned that due to the ultra-low angle sampling, it is hard to recover the boundary of the low-contrast circle without distortion.
Figure 9.
CatPhan® 600 phantom image reconstructions by different algorithms from the 63 projection views. Column (a) shows the reconstruction by the FBP method from the full or total 634 projection views as a reference. Column (b) shows the reconstruction by the FBP method from the sparse or 63-projection views. Column (c) shows the reconstruction by the AwTV-POCS method from the 63 projection views. Column (d) shows the reconstruction by the ASD-POCS method from the 63 projection views. Column (e) shows the reconstruction by the TVS method from the 63 projection views. The bottom row shows the zoomed pictures. The display window of top row is [0, 0.0271]mm−1. The display window of bottom row is [0.0039, 0.0258]mm−1.
4) Profile-based comparison
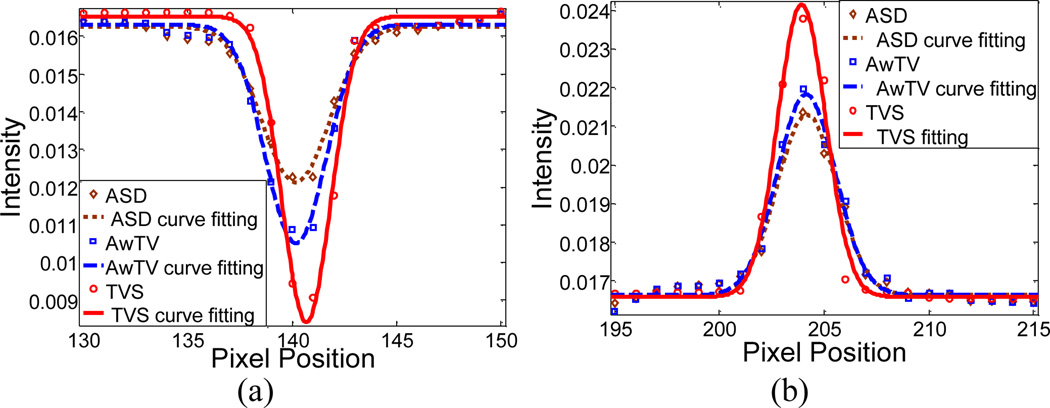
In order to further compare the performance of the TVS-POCS method to the ASD/AwTV-POCS algorithms in this CatPhan® 600 physical phantom study, profiles passing through the two spots, as indicated by the arrows in Fig. 9, were fitted by a Gaussian like function and shown in Fig. 10. From this figure, it can be observed that the peak values of the TVS-POCS result are much higher than that of the TV-based ASD/AwTV-POCS results, which indicate that the TVS method yielded a higher resolution than other methods. To further quantitatively analyze the gains of the TVS method, the full-width-at-half-maximum (FWHM) values of the two spots (a cold spot and a hot spot) are discussed in next section.
Figure 10.
Horizontal profiles of the CatPhan® 600 phantom images reconstructed by different algorithms from the 63-view 80mA projection data. Picture (a) shows the profiles across the cold spot (along the 146th row, from the 135th to the 155th column). Picture (b) shows the profiles across the hot spot (along the 139th row, from the 200th to the 220th column).
5) FWHM measures
The FWHM measure was always used as an indicator to indicate the resolution of the desired image [20]. A larger FWHM value indicates that a low-contrast image is obtained and a smaller FWHM value means that a high-contrast image is obtained. In this study, the FWHM of the fitted Gaussian broadening kernel is defined by 2.35 σG, where σG is the standard deviation of the fitted Gaussian function [16]. The FWHM of the Gaussian curves in Fig. 10 were calculated and shown in Table I, revealing that the TVS method produced smaller FWHM values than the ASD-POCS and AwTV-POCS methods on both the hot and cold spots and indicating that higher contrast spots were obtained by the TVS-POCS method. These FWHM measures are consistent with our observations in the profile comparison study.
Table I.
The FWHM values of the cold and hot spots in Fig. 7.
| Position | ASD-POCS | AwTV-POCS | TVS-POCS |
|---|---|---|---|
| cold spot | 5.1582 | 4.8763 | 3.8799 |
| hot spot | 4.6789 | 4.5966 | 3.7647 |
6) UQI study
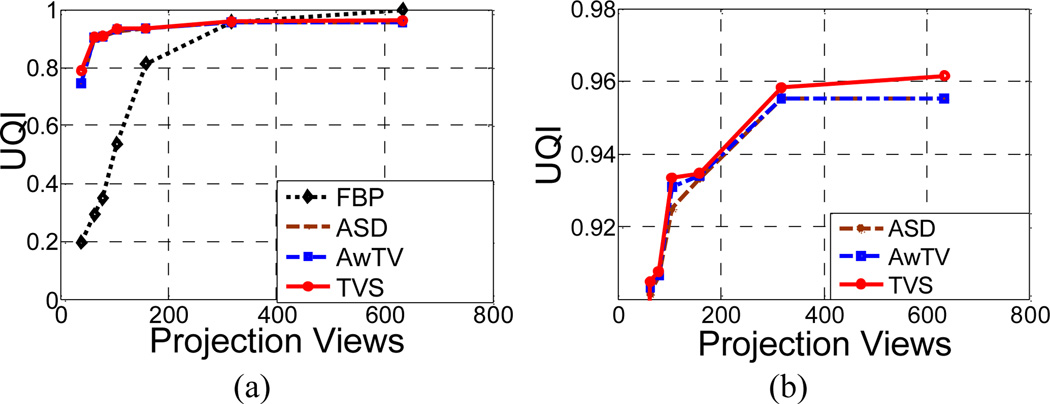
In this UQI evaluation, the gold standard image was the FBP reconstruction in the full-view case was utilized as the baseline image. The UQI curves of the selected ROIs as indicated by rectangular window in Fig.9 are shown in Fig.11. From this figure, we can observe: (1) the ASD/AwTV-POCS and TVS-POCS results have much higher UQI values than the FBP result in the sparse-view cases and they approached to the gold standard in the full-view case; and (2) the TVS-POCS results have higher UQI values than that of the ASD/AwTV-POCS results. Thus, the TVS-POCS method can produce more close matching results compared to the TV-based algorithms in the sparse-view cases.
Figure 11.
(a) the curves of UQI values versus the numbers of projection views; and (b) the zoom-in views of (a).
C. Clinical data analysis
1) Data acquisition
In this pilot clinical study, the raw projection data set was acquired from a patient who was scheduled for CT-guided lung needle biopsy for lung nodule analysis in Stony Brook University Hospital under the approval of the Institutional Review Board (IRB). The patient was scanned by a Siemens SOMATOM Sensation 16-slice spiral CT scanner in non-FFS model (i.e., 1,160 projection views per 360°, 0.3103448° for the tube angle increment). The number of channels in each detector row was 672, the fan angle increment for each channel was 0.0775862° and the bin size along the z axis was 0.75mm. The radius of the focal spot circle was 570mm, and distance between the source and the detector plane was 1,040mm. The FOV was 51.2×51.2cm2 with the corresponding pixel size of 1×1mm2. The tube voltage was set to 120kVp and the tube current was set to 100mAs.
The spiral cone-beam raw data from the 16-slice CT system are usually rebinned into multi-slice fan-beam projection data by considering the effects of pitch (i.e., the movement of the patient along the z axis) [36]. In this study, we were interested in the image slice containing the lung nodule and therefore extracted the corresponding sinogram from the multi-slice fan beam sinogram data. The FBP reconstruction from the full-view 100mAs data was assumed as our gold standard image.
2) Visualization-based evaluation
In reality, one of our mostly concerned questions about low-dose CT image reconstruction would be stated as “how many projection views are necessary to reconstruct satisfactory images at a fixed mAs level?” Accordingly, most researchers agreed that the sparsity of the desired image and the noise level in the projection data would be two important factors [13–15,17,20–23,37]. In this study, we evenly extract 116, 232, 290, 386, 580 and 1,160 projection views from the sinogram data acquired at 100mAs (i.e., normal-mAs level) to ensure the same noise level for each projection view of the sparse-view data. Therefore, the overall dosage of each sparse case depends only on the number of projection views.
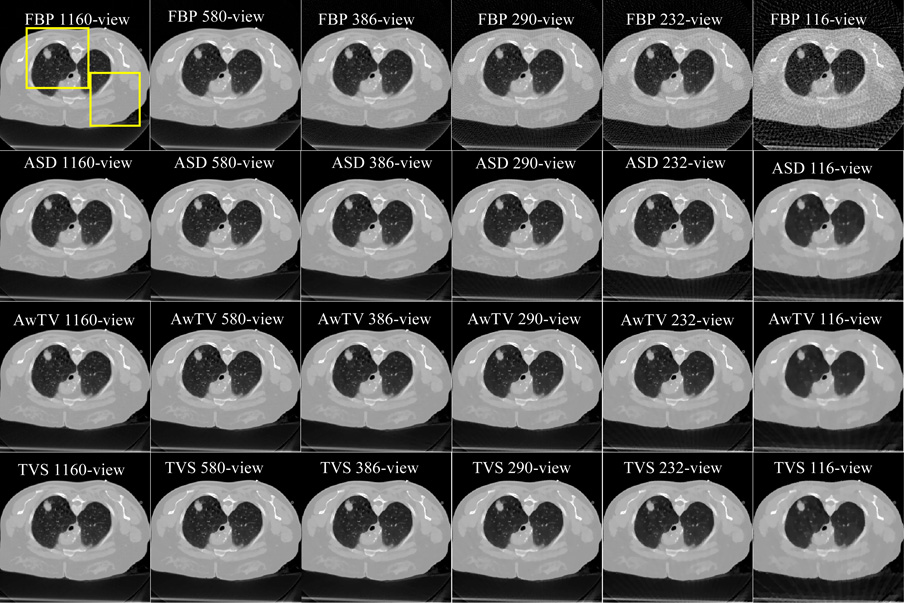
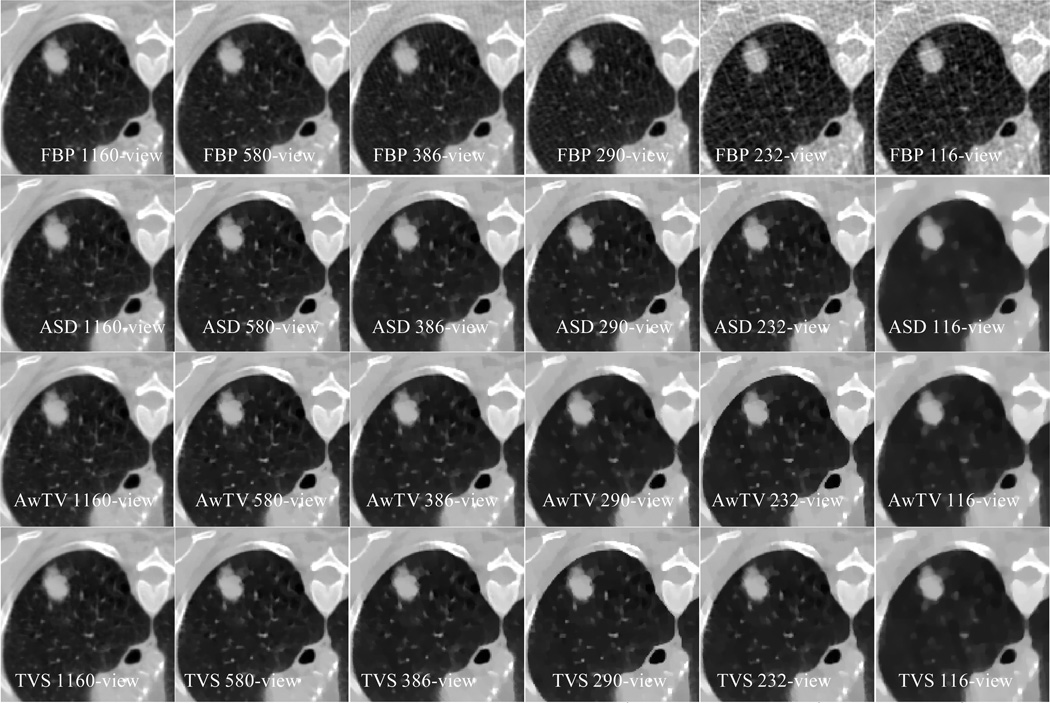
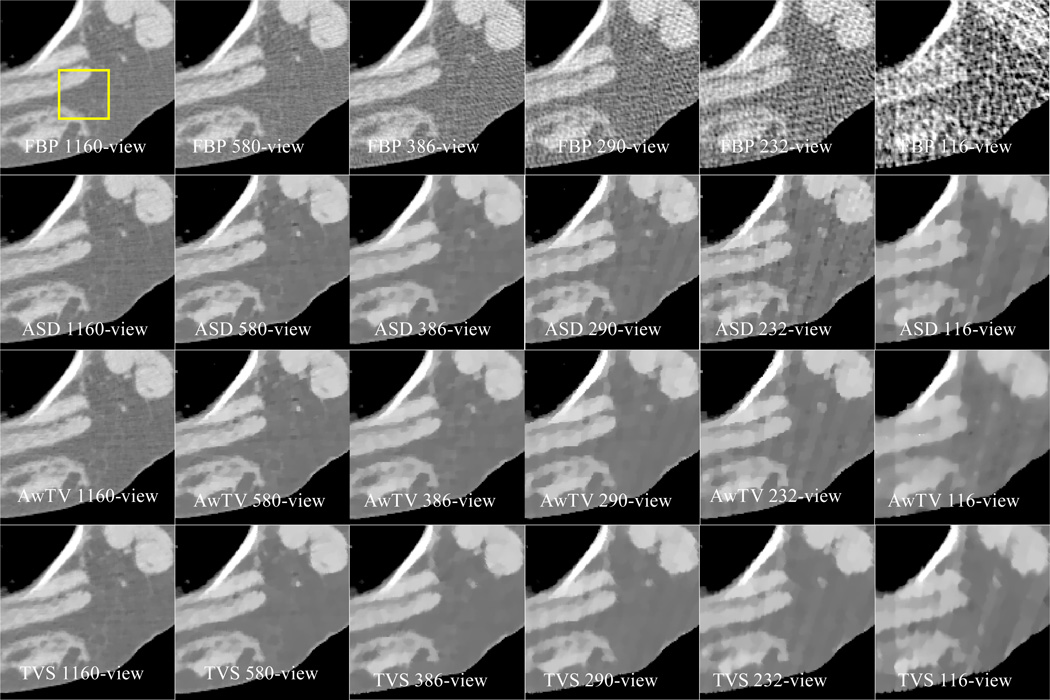
The reconstructed images from the patient’s sinogram data are shown in Figs. 12,13 and 14. Clearly, the FBP algorithm had the worst results in the sparse cases, and the ASD/AwTV-POCS methods had more patchy artifacts than the TVS-POCS method in 580, 386 and 290-view cases. If the number of projection views decreased below 290, all the three methods (two TV-based plus the presented TVS-based) generated more straight artifacts and severe noise due to the severe insufficient measurement. The zoom-in-view in Fig. 13 and Fig. 14 illustrated that the TVS reconstruction from the 290-projection views has superior image quality for the clinical biopsy purpose. However, to produce a similar image reconstruction with the TVS-POCS method, the ASD/AwTV-POCS methods need at least 386 projection views. The results further demonstrate that the gains from the TVS-POCS method over the gold standard image in dose reduction would be (386–290)/290% or 33%.
Figure 12.
The images reconstructed by FBP (1st row), ASD-POCS (2nd row), AwTV-POCS (3rd row) and TVS-POCS (4th row) methods from 1,160-, 580-, 386-, 290-, 232- and 116-projection views. The display window is [0, 0.0587]mm−1.
Figure 13.
The zoom-in views of images reconstructed by FBP (1st row), ASD-POCS (2nd row), AwTV-POCS (3rd row) and TVS (4th row) methods from 1,160-, 580-, 386-, 290-, 232- and 116-projection views. The display window is [0,0.0373]mm−1.
Figure 14.
The zoom-in views of images reconstructed by FBP (1st row), ASD-POCS (2nd row), AwTV-POCS (3rd row) and TVS (4th row) methods from 1,160-, 580-, 386-, 290-, 232- and 116-projection views. The display window is [0.0373, 0.0587]mm−1.
3) Normal vector flow study
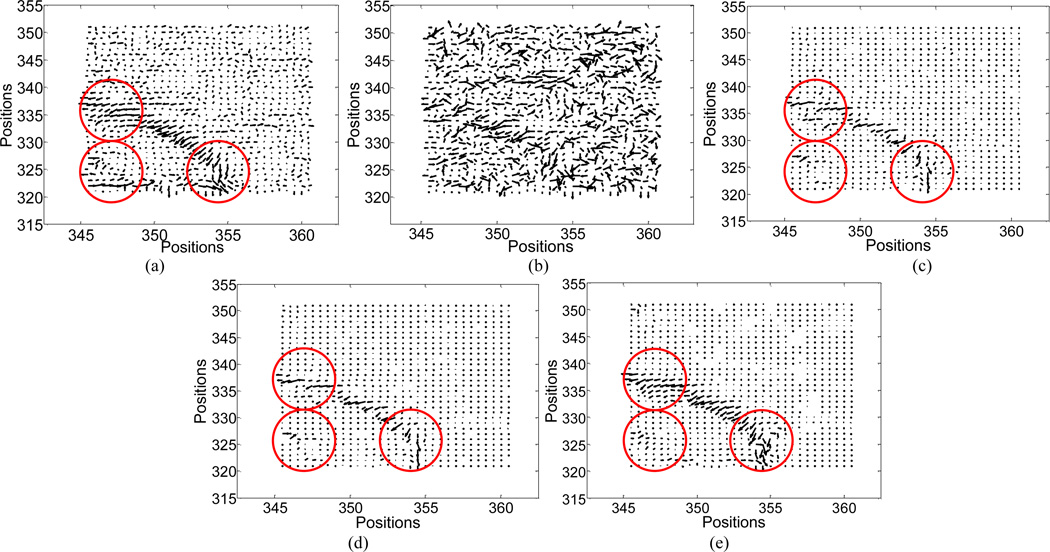
In order to further verify the improvement of the TVS-POCS method over the TV-based ones, small ROIs from the 290-view results as indicated by rectangular window in Fig. 14 were selected to plot the normal vector flow (NVF) images and the plots are shown in Fig. 15. In this figure, the NVF image of the FBP reconstruction from the full-view (or 1,160-view) data was drawn as gold standard. According to our knowledge, the gradual changes of the intensities in the desired image are often shown as ordered arrows in the NVF images, while the noise in the image are often shown as disordered arrows, as shown in Fig. 15(a) and 15(b). From in figures 15(c) and 15(d), it can be seen that although the disordered arrows were eliminated by the use of AwTV/TV-POCS methods, some ordered arrows were falsely replaced by small dots as indicated by the circles. The replacements were caused by patchy artifacts, which tried to uniform all the intensities within a local patch. Meanwhile, the NVF images of the TVS-POCS methods illustrate that the more ordered arrows were recovered, which indicated small textures of the resulting image were well preserved, as indicated by circle in Fig. 15(e).
Figure 15.
The NVF images of the reconstructed images from: (a) the 1,160 views by FBP (the gold standard); (b) the 290 views by FBP; (c) the 290 views by ASD-POCS; (d) the 290 views by AwTV-POCS; and (e) the 290 views by TVS-POCS.
4) UQI study
The above reconstructed images were also quantitatively evaluated by the UQI measure, as shown in Fig. 16. The results indicate that all three methods (two TV-based plus the TVS-based) approached to the full-view FBP reconstruction (or the gold standard reference) with significant gains over the FBP method at sparse-view cases with less than 580 projection views. The zoom-in-display of the curves is in Fig. 16(b), which shows that the TVS-POCS method outperformed the ASD/AwTV-POCS algorithms. These results are consistent with our previous observations in both digital and physical phantom studies.
Figure 16.
(a) The curves of the UQI values versus the numbers of projection views; and (b) the zoom-in views of (a).
V. Discussion and Conclusion
In this work, we reviewed the TVS model and presented a TVS-POCS method for CT image reconstruction from sparse-view data. This method was investigated by computer simulations, physical phantom experiments, and clinical pilot studies.
Different from the previous TV and AwTV regularization strategies, the isophote directions were introduced in the TVS model. The key motivation for the TVS model was to retain the continuous property of the image along both the tangent and the normal directions. Use of the TVS-POCS method for image reconstruction from sparse-view data has been shown to improve the quality of the image reconstruction by mitigating the patchy artifacts of the previous TV and AwTV regularization strategies. Moreover, this new method has been shown to improve the preservation of both gradually varying boundaries and sharply changing edges.
In our digital phantom study, the convergence was shown to be monotonically decreasing toward a steady solution. The TVS-POCS method outperformed the ASD/AwTV-POCS algorithms for image reconstruction from sparse-view data in both noise-free and noisy cases. The TVS-POCS method eliminated the patchy artifacts and produced pleasant results at the uniform regions and also around the edges. In addition to visual inspection of the results, we also performed several quantitative evaluations by using different merits. The profile analysis and UQI study indicated the improvement by the TVS-POCS method.
While the projection data in the physical phantom study suffered the photon count noise and electrical background noise, the outcomes rendered a similar conclusion as that of the digital phantom data. This reflects the robustness of the TVS-POCS method to a more realistic scanning environment.
In the clinical pilot data study, beside the photon count noise and electrical background noise due to the scanning system, the projection data were affected by more variables from the subjects. Many reconstruction methods failed to demonstrate their gains in clinical data case, although their performances in phantom studies were impressive. In our clinical data case, we tested the proposed method by sparse-view projection data at a fixed mAs level. In this scenario, the TVS-POCS method outperformed the other two TV-based algorithms on both visual inspection and UQI study. For low-dose CT image reconstruction, another concerning question would be stated as “what is the better way to minimize the dosage (i.e., decreasing the number of projection views or decreasing the photon flux). As we mentioned in the introduction section, decreasing the photon flux per view will unavoidably increase the noise level at each projection view. Therefore, an open question would be if the TVS model still has advantages over the TV-based model when we use the statistical-based image reconstruction methods, such as the PRWLS method [12]. Addressing this question is one of our research tasks in the future.
At last, there are still some other open questions that need be answered in the future. The first one is about how to accurately determine an adequate value for each of the parameters. This interesting question perplexes almost all the iterative image reconstruction algorithms. In our TVS model, there are parameters whose values need to be determined: Δ t1, Δ t2, ε1, ε2 and ε3. In implementation, the value of Δ t1 depends only on the intensities of the desired image and can be determined before running the algorithm. The value of ε1, ε2 and ε3 are always chosen to be small values to achieve a smooth convergence. Parameter Δ t2 is related to the smoothness of the normal vector, a large Δ t2 will often lead to an over-smoothed image. Thus, we can give a large initial value to Δ t2, and then gradually decrease the value to recover subtle information of the resulting images. Another question is about the computational cost. The computational time for the TVS-POCS method is longer than that of the TV-based ASD/AwTV-POCS algorithms because it needs extra time for the tangent vector estimation. So the gain in image reconstruction quality comes with the cost of longer computing time. Accelerating the computation can be achieved by using multi-core CPU and GPU hardware which can compute the result in a more efficient and parallel fashion. The acceleration hardware cost may be a less concerning issue as new computer technologies are available. An alternative acceleration may be the development of an alternative efficient computing algorithm for the TVS-POCS method. Addressing the above open questions is another task in our future research.
Figure 4.
The images reconstructed by FBP (1st row), ASD-POCS (2nd row), AwTV-POCS (3rd row) and TVS-POCS (4th row) algorithms from 20 (left column), 40 (middle column), and 60 (right column) projection views in noisy cases, respectively. The display window is [0, 0.0034] mm−1 for the full FOV images and is [0.0013, 0.0018] mm−1 for the ROI images.
Figure 5.
Horizontal profiles (410th row) of the images reconstructed from different numbers of projection views for noise-free cases: (a) 20 projection views; (b) 40 projection views; and (c) 60 projection views.
Figure 6.
Horizontal profiles (410th row) of the images reconstructed from different numbers of projection views for noisy cases: (a) 20 projection views; (b) 40 projection views; and (c) 60 projection views.
Acknowledgments
This work was supported in part by the NIH/NCI under grant #CA143111 and #CA082402. J. Ma is partially supported by the National Natural Science Foundation of China under grant #81101046, the science and Technology Program of Guangdong Province of China under grant #2011A030300005 and the 973 Program of China under grant #2010CB732503. H. Lu is partially supported by the National Natural Science Foundation of China under grant #81230035 and #81071220. J. Ma and H. Lu also are partially supported by the National Key Technologies R&D Program of China under grant #2011BAI12B03.
Contributor Information
Yan Liu, Departments of Radiology and Electrical and Computer Engineering, Stony Brook University, Stony Brook, NY 11794, USA. (yanliu@mil.sunysb.edu).
Zhengrong Liang, Departments of Radiology, Computer Science and Biomedical Engineering, Stony Brook University, Stony Brook, NY 11794, USA. (jzl99@mil.sunysb.edu).
Jianhua Ma, School of Biomedical Engineering, Southern Medical University, Guangzhou, 510515, China.
Hongbing Lu, Department of Biomedical Engineering, Fourth Military Medical University, Xi’An, Shanxi, 710032, China.
Ke Wang, Department of Applied Mathematics and Statistics, Stony Brook University, Stony Brook, NY 11794, USA.
Hao Zhang, Departments of Radiology and Biomedical Engineering, Stony Brook University, Stony Brook, NY 11794, USA.
William Moore, Department of Radiology, Stony Brook University, Stony Brook, NY 11794, USA.
References
- 1.Einstein AJ, Henzlova MJ, Rajagopalan S. Estimating risk of cancer associated with radiation exposure from 64-slice CT coronary angiography. Journal of American Medical Association. 2007 Jul;vol. 298:317–323. doi: 10.1001/jama.298.3.317. [DOI] [PubMed] [Google Scholar]
- 2.Brenner DJ, Hall EJ. CT--an increasing source of radiation exposure. New England Journal of Medicine. 2007 Nov;vol. 357:2277–2284. doi: 10.1056/NEJMra072149. [DOI] [PubMed] [Google Scholar]
- 3.Sauer K, Liu B. Non-stationary filtering of transmission tomograms in high photon counting noise. IEEE Transactions on Medical Imaging. 1991 Sep;vol. 10(no. 3):445–452. doi: 10.1109/42.97595. [DOI] [PubMed] [Google Scholar]
- 4.Lu H, Hsiao I, Li X, Liang Z. Noise properties of low-dose CT projections and noise treatment by scale transformations. Nuclear Science Symposium and Medical Imaging Conference Record. 2001 Nov;vol. 3:1662–1666. [Google Scholar]
- 5.Demirkaya K. Reduction of noise and image artifacts in computed tomography by nonlinear filtration of the projection images. Proceeding of SPIE Medical Imaging 2001. 2001 Jul;vol. 4322:917–923. [Google Scholar]
- 6.Lu H, Li X, Liang Z. Analytical noise treatment for low-dose CT projection data by penalized weighted least-square smoothing in the K-L domain. Proceeding of SPIE Medical Imaging 2002. 2002 May;vol. 4682:146–152. [Google Scholar]
- 7.Elbakri IA, Fessler JA. Statistical image reconstruction for polyenergetic X-ray CT. IEEE Transactions on Medical Imaging. 2002 Feb;vol. 21(no.2):89–99. doi: 10.1109/42.993128. [DOI] [PubMed] [Google Scholar]
- 8.Elbakri IA, Fessler JA. Efficient and accurate likelihood for iterative image reconstruction in X-ray CT. Proceeding of SPIE Medical Imaging 2003. 2003 Feb;vol. 5032:1839–1850. [Google Scholar]
- 9.Li T, Li X, Wang J, Wen J, Lu H, Hsieh J, Liang Z. Nonlinear sinogram smoothing for low-dose X-ray CT. IEEE Transactions on Nuclear Science. 2004 Oct;vol. 51(no. 5):2505–2513. [Google Scholar]
- 10.La Riviere PJ. Penalized-likelihood sinogram smoothing for low-dose CT. Medical Physics. 2005;vol. 32(no. 6):1676–1683. doi: 10.1118/1.1915015. [DOI] [PubMed] [Google Scholar]
- 11.La Rivière PJ, Bian J, Vargas PA. Penalized-likelihood sinogram restoration for CT. IEEE Transactions on Medical Imaging. 2006 Aug;vol. 25(no. 8):1022–1036. doi: 10.1109/tmi.2006.875429. [DOI] [PubMed] [Google Scholar]
- 12.Wang J, Li T, Lu H, Liang Z. Penalized weighted least-squares approach to sinogram noise reduction and image reconstruction for low-dose X-ray CT. IEEE Transactions on Medical Imaging. 2006 Oct;vol.25(no. 10):1272–1283. doi: 10.1109/42.896783. [DOI] [PMC free article] [PubMed] [Google Scholar]
- 13.Sidky E, Kao C, Pan X. Accurate image reconstruction from few-views and limited angle data in divergent-beam CT. Journal of X-Ray Science and Technology. 2006;vol. 14(no. 2):119–139. [Google Scholar]
- 14.Chen G, Tang J, Leng S. Prior image constrained compressed sensing (PICCS) Proc. Soc. Photon Instrum. Eng. 2008 Mar;vol. 6856:1–18. doi: 10.1117/12.770532. [DOI] [PMC free article] [PubMed] [Google Scholar]
- 15.Sidky E, Pan X. Image reconstruction in circular cone-beam CT by constrained, total-variation minimization. Physics in Medicine and Biology. 2008 Aug;vol. 53:4777–4807. doi: 10.1088/0031-9155/53/17/021. [DOI] [PMC free article] [PubMed] [Google Scholar]
- 16.Wang J, Li T, Xing L. Iterative image reconstruction for CBCT using edge-preserving prior. Medical Physics. 2009 Jan;vol. 36(no. 1):252–260. doi: 10.1118/1.3036112. [DOI] [PMC free article] [PubMed] [Google Scholar]
- 17.Han X, Bian J, Eaker DR, Timothy L Kline, Sidky EY, Ritman EL, Pan X. Algorithm-Enabled Low-Dose Micro-CT Imaging. IEEE Transactions on Medical Imaging. 2011 Mar;vol. 30(no. 3):606–620. doi: 10.1109/TMI.2010.2089695. [DOI] [PMC free article] [PubMed] [Google Scholar]
- 18.Ma J, Liang Z, Fan Y, Liu Y, Huang J, Chen W, Lu H. Variance analysis of X-ray CT sinograms in the presence of electronic noise background. Medical Physics. 2012 Jun;vol. 39(no. 7):4051–4065. doi: 10.1118/1.4722751. [DOI] [PMC free article] [PubMed] [Google Scholar]
- 19.Liu Y, Ma J, Zhang H, Wang J, Liang Z. Low-dose CT image reconstruction by adaptive-weighted TV-constrained penalized weighted least-squares approach. Proceedings of The Second International Conference on Image Formation in X-Ray Computed Tomography. 2012 Jun;:41–45. [Google Scholar]
- 20.Liu Y, Ma J, Fan Y, Liang Z. Adaptive-weighted total variation minimization for sparse data toward low-dose x-ray computed tomography image reconstruction. Physics in Medicine and Biology. 2012 Nov;vol. 57:7923–7956. doi: 10.1088/0031-9155/57/23/7923. [DOI] [PMC free article] [PubMed] [Google Scholar]
- 21.Xu Q, Yu H, Mou X, Zhang L, Hsieh J, Wang G. Low-dose X-ray CT reconstruction via dictionary learning. IEEE Transactions on Medical Imaging. 2012 Sep;vol.31(no. 9):1682–1697. doi: 10.1109/TMI.2012.2195669. [DOI] [PMC free article] [PubMed] [Google Scholar]
- 22.Donoho D. Compressed sensing. IEEE Transactions on Information Theory. 2006 Apr;vol. 52(no. 4):1289–1306. [Google Scholar]
- 23.Tang J, Nett BE, Chen G. Performance comparison between total variation (TV)-based compressed sensing and statistical iterative reconstruction algorithms. Physics in Medicine and Biology. 2009 Oct;vol. 54:5781–5804. doi: 10.1088/0031-9155/54/19/008. [DOI] [PMC free article] [PubMed] [Google Scholar]
- 24.Bian J, Siewerdsen JH, Han X, Sidky EY, Prince JL, Pelizzari Ca, Pan X. Evaluation of sparse-view reconstruction from flat-panel-detector cone-beam CT. Physics in Medicine and Biology. 2010 Oct;vol. 55:6575–6898. doi: 10.1088/0031-9155/55/22/001. [DOI] [PMC free article] [PubMed] [Google Scholar]
- 25.Rahman T, Tai X, Osher S. A TV-stokes denoising algorithm; SSVM'07 Proceedings of the 1st international conference on Scale space and variational methods in computer vision; 2007. pp. 473–483. [Google Scholar]
- 26.Tai X, Osher S, Holm R. Image inpainting using a TV-Stokes equation. Image Processing Based on Partial Differential Equations Mathematics and Visualization. 2007:3–22. [Google Scholar]
- 27.Bertalmio M, Bertozzi AL, Sapiro G. Navier-Stokes, fluid dynamics and image and video inpainting. Proc. Conf. Comp. Vision Pattern Rec. 2001 Dec;:355–362. [Google Scholar]
- 28.Tai X, Wu C. Augmented lagrangian method, dual methods and split bregman iteration for ROF model; SSVM '09 Proceedings of the Second International Conference on Scale Space and Variational Methods in Computer Vision; 2009. pp. 502–513. [Google Scholar]
- 29.Chan TF, Marquina A, Mulet P. A nonlinear primal-dual method for total variation-based image restoration. SIAM J. Sci. Comput. 1999;vol. 20:1964–1977. [Google Scholar]
- 30.Goldstein T, Osher S. The split Bregman method for L1 regularized problems. UCLA MAM Report 08-29. 2008:1–29. [Google Scholar]
- 31.Andersen A, Kak A. Simultaneous algebraic reconstruction technique (SART): A superior implementation of ART. Ultrasonic Imaging. 1984 Jan;vol. 6(no.1):81–94. doi: 10.1177/016173468400600107. [DOI] [PubMed] [Google Scholar]
- 32.Jiang M, Wang G. Convergence of the simultaneous algebraic reconstruction technique (SART) Conference Record of the Thirty-Fifth Asilomar Conference on Signal, Systems and Computers 2011. 2001 Nov;vol. 1:360–364. [Google Scholar]
- 33.Chen D, Cheng L, Su F. A New TV-Stokes Model with Augmented Lagrangian method for Image Denoising and Deconvolution. Journal of Scientific Computing. 2012 Jun;vol. 51(issue 3):505–526. [Google Scholar]
- 34.Wang Z, Bovik AC. A universal image quality index. IEEE Signal Processing Letters. 2002 Mar;vol. 9(no. 3):81–84. [Google Scholar]
- 35.Wang J, Li T, Liang Z, Xing L. Dose reduction for kilovotage cone-beam CT in radiation therapy. Physics in Medicine and Biology. 2008 May;vol. 53:2897–2909. doi: 10.1088/0031-9155/53/11/009. [DOI] [PMC free article] [PubMed] [Google Scholar]
- 36.Noo F, Defrise M, Clackdoyle R. Single-slice rebinning method for helical cone-beam CT. Physics in Medicine and Biology. 1999 Feb;vol. 44:561–570. doi: 10.1088/0031-9155/44/2/019. [DOI] [PubMed] [Google Scholar]
- 37.Candès E, Romberg J, Tao T. Robust uncertainty principles: Exact signal reconstruction from highly incomplete frequency information. IEEE Transactions on Information Theory. 2006 Feb;vol. 52(no. 2):489–509. [Google Scholar]


