INTRODUCTION
Historically, magnetic resonance (MR) imaging techniques used to evaluate muscle disorders in children have included T1-weighted images (T1WI) and water-sensitive sequences, such as short-tau inversion recovery (STIR) or T2-weighted images (T2WI), with or without fat suppression. These techniques have been limited primarily to the evaluation of gross morphologic changes of the muscles.1 Recent developments in advanced MR techniques and postprocessing software have expanded the use of MR imaging to include quantitative analysis.2–4 These advances allow for the objective analysis ofcomposition,4–7 architecture,8,9 mechanical properties,10 and function down to a microscopic level in normal and pathologic skeletal muscles in the pediatric population.11,12
This article reviews T1WI and water-sensitive sequences as examples of qualitative or semiquantitative imaging tools used to subjectively analyze the morphology and compositional changes of muscle. Quantitative MR imaging techniques, such as T2 relaxation time mapping, Dixon imaging, diffusion-weighted (DW) imaging, diffusion tensor (DT) imaging, MR elastography, and MR spectroscopy are also reviewed, along with their physiologic basis and clinical applications (Tables 1 and 2).
Table 1.
MR parameters of quantitative MR imaging
| TR/TE | Matrix | Echo Train Length | Section Thickness | Section Gap (mm) | Field of View (cm) | Acquisition Time (min) | Pretreatment | |
|---|---|---|---|---|---|---|---|---|
| T2 relaxation time mapping (pelvic and thigh MR) | 1500/8, 16, 24,., 128 ms | 512 × 512 | 16 | 5 mm | 10–50 | 32–46 | 5–7 | Forgo excessive exercise for 12 h before MR examination |
| Dixon (pelvis and thigh MR) | For 3 T: 3.5/1.15 (TE1)/2.3 (TE2) For 1.5 T: 7/2.3 (TE1)/4.6 (TE2) |
220 × 196 | 1 | 1.5–3 mm | 0 | 32–46 | 2–3 | |
| DW imaging | 3000/27.5 | 192 × 128 | 1 | 6 mm | 9 | Depends on the size of the ROI | 2–5 | |
| DT imaging | 6514/72 | 76 × 76 | b-value = 500 | 2–3 mm | 0 | 18–24 | 4 | |
| MR elastography | 100/19.6 (100 Hz motion) | 256 × 64 | 1 | 5–10 mm | 0 | 24–36 | 1–2 | |
| PRESS MR spectroscopy | 3000/20 | Spectral width 2000 Hz, number of points 1024, 32–138 averages | NA | 2 cm/side | NA | NA | 5 |
Abbreviations: DT, diffusion tensor; DW, diffusion-weighted; NA, no data available; PRESS, point-resolved spectroscopy; ROI, region of interest; TE, echo time; TR, repetition time.
Table 2.
Summary of quantitative MR imaging interpretation
| Quantitative Images | ||
|---|---|---|
| T2 map | Decay of MR signal from altered environmental water binding | Increased inflammation: T2 relaxation time prolonged Increased fatty infiltration: T2 relaxation time prolonged |
| Dixon | Fat quantification using in-phase and opposed-phase imaging | Increased fatty infiltration; increased fat fraction (fat/fat 1 water) |
| DW imaging | Random motion of water molecule | Increased cellularity in neoplasm: ADC value decreased Increased inflammation: ADC value increased Increased fatty infiltration: ADC value decreased |
| DT imaging | Muscle fiber tracking | Increased muscle injury: FA value decreased Increased muscle injury: MD increased |
| MR elastography | Mechanical properties measuring shear stiffness | Increased stiffness with increased disease |
| MR spectroscopy | Chemical information | Increased fatty infiltration; Increased lipid peak |
Abbreviations: ADC, apparent diffusion coefficient; FA, fractional anisotropy; MD, mean diffusivity.
SEMIQUANTITATIVE MR IMAGING TECHNIQUES
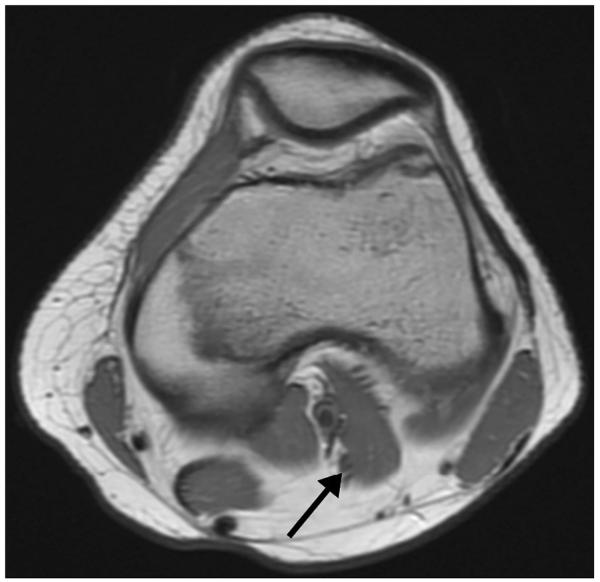
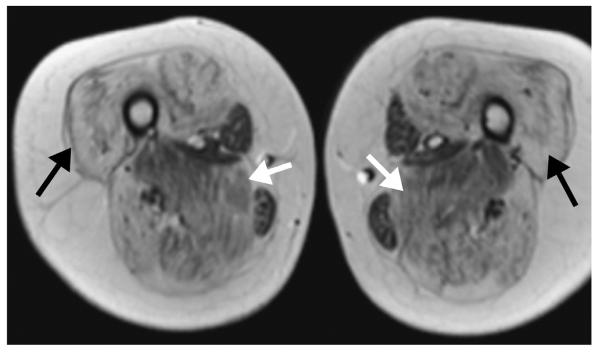
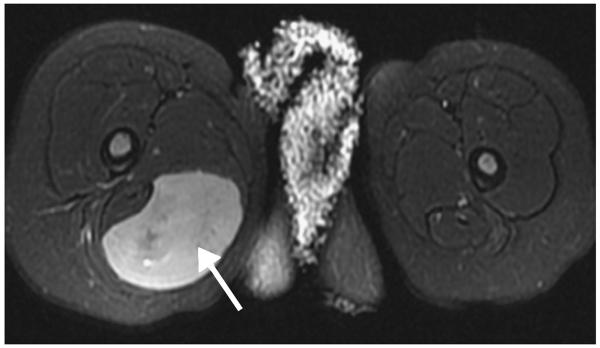
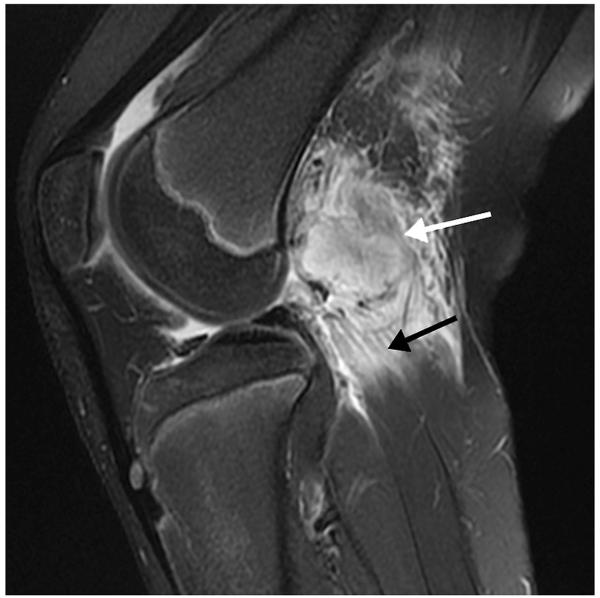
T1WI is a basic MR imaging sequence that can detect the hyperintense signal characteristic of fat. STIR sequences and T2WI sequences with fat suppression primarily are used to detect muscle disorders that result in hyperintense signal associated with increased water content. These qualitative or semiquantitative MR imaging sequences have been applied to identify anatomic abnormalities such as absent, aberrant, or accessory muscles (Fig. 1),13 changes in tissue composition such as fatty infiltration (Fig. 2)14 or increased water content (Fig. 3),2 and masses (Fig. 4) or mass-like lesions (Fig. 5).15
Figure 1.
A 15-year-old girl with knee pain. Axial intermediate-weighted MR image demonstrates accessory band (third head) (arrow) of the lateral head of the gastrocnemius muscle. Although this is seen in asymptomatic patients, it can cause mass effect on popliteal vessels in patients with popliteal entrapment syndrome.
Figure 2.
An 11-year-old boy with Duchenne muscular dystrophy (DMD). Axial T1-weighted MR image shows extensive fatty infiltration of the majority of the thigh muscles bilaterally. Note that while the degree of involvement varies by muscle, individual muscle severity is relatively symmetric between the thighs (adductor magnus, white arrows; vastus lateralis, black arrows).
Figure 3.
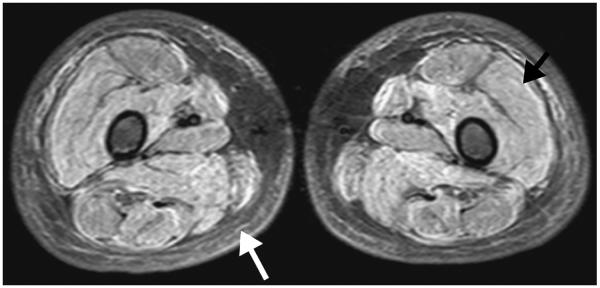
A 7-year-old boy with juvenile dermatomyositis. Axial short-tau inversion recovery MR image shows a symmetric pattern of diffusely increased fluid signal intensity throughout all visualized thigh muscles (black arrow) consistent with muscle edema. Edema of the subcutaneous fat (white arrow) is also seen bilaterally, which is associated with a worse prognosis.
Figure 4.
A 22-month-old girl with thigh mass. Axial fat-saturated (FS) T2-weighted MR image shows a wellcircumscribed mass (arrow) in the posteromedial musculature of the proximal right thigh with nearly homogeneous high T2 signal intensity (though not as bright as fluid). No surrounding muscle or soft-tissue edema is seen. Surgical pathology confirmed the diagnosis of rhabdomyosarcoma.
Figure 5.
A 12-year-old girl with knee pain after dancing. Sagittal FS T2-weighted MR image shows a round heterogeneous mass (white arrow) in the proximal muscle fibers of the gastrocnemius lateral head, with intense surrounding muscle edema (black arrow) and less pronounced surrounding fat edema. Given the intramuscular location, intense surrounding edema, and lower T2 signal intensity rim, myositis ossificans was suggested. Subsequent radiographs confirmed the typical peripheral to central calcification pattern seen with this entity.
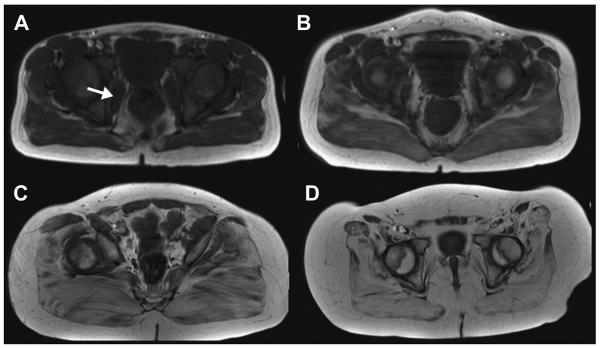
Semiquantitative MR techniques have been used to subjectively grade compositional changes in muscle.14 For example, the degree of fatty infiltration on T1WI has been graded from 0 to 4 as follows: grade 0, homogeneous low T1 signal of the muscle; grade 1, minimal fatty infiltration; grade 2, mild fatty infiltration with patchy areas of fatty infiltration affecting less than 30% of the muscle mass; grade 3, moderate fatty infiltration with 30% to 60% of muscle mass involved and preservation of the demarcation between muscle and subcutaneous fat; and grade 4, severe fatty infiltration with more than 60% of muscle mass involved and loss of the muscle–subcutaneous fat interface (Fig. 6).14,16,17
Figure 6.
Grading of fatty infiltration of the pelvic muscles on T1WI. (A) Grade 0, homogeneous low T1 signal of the iliacus muscle (arrow); grade 1, minimal fatty infiltration of the gluteus maximus muscles bilaterally. (B) Grade 2, mild fatty infiltration with patchy areas of fatty infiltration (affecting <30% of the muscle mass) of the gluteus maximus muscle. (C) Grade 3, moderate fatty infiltration (30%–60% of muscle mass involvement with preserved demarcation between muscle and subcutaneous fat) of the gluteus maximus muscle. (D) Grade 4, severe fatty infiltration with (>60% of muscle mass involvement with loss of the muscle-subcutaneous fat interface).
The degree of water signal intensity in muscle, often reflecting edema or inflammation, has been graded on STIR or T2WI with fat suppression from 0 to 3 as follows: grade 0, homogeneous low T2 signal; grade 1, minimal interfascicular edema; grade 2, minimal interfascicular and/or intrafascicular edema; and grade 3, moderate interfascicular and/or intrafascicular edema.16,17
QUANTITATIVE MR IMAGING TECHNIQUES
T2 Relaxation Time Mapping
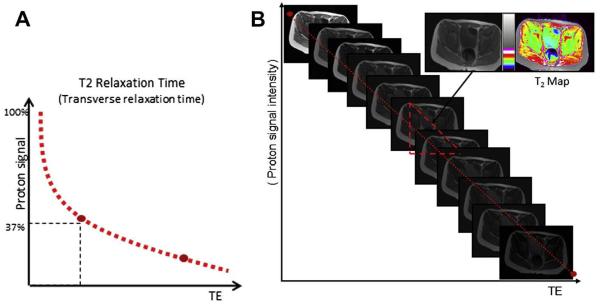
T2 relaxation time mapping (T2 mapping) is an MR imaging measurement of the time constant of decay of the nuclear MR signal, and has been used widely in the evaluation of articular cartilage.16,18 In the magnetic field the hydrogen nuclei are excited, causing them to oscillate and generate a detectable magnetic signal. Immediately after excitation, the nuclei start to diphase while there is concurrent signal decay. Decay of the magnetic resonance signal is called T2 relaxation or transverse relaxation.19 T2 relaxation time is defined as the time for the signal to reach 37% (1/e) of its initial signal after generation by tipping the longitudinal magnetization toward the transverse magnetic plane (Fig. 7A).20 T2 relaxation time can be affected by a variety of factors.21 Physiologic or pathologic macromolecular environmental changes of skeletal muscle can affect T2 relaxation times by alterations of water binding to neighboring molecules.2,14,22 The main disease processes of the skeletal muscles, namely inflammation/edema and fatty infiltration, both affect T2 relaxation times. In addition, T2 relaxation times are longer when measured with lower field strengths than when measured with higher field strengths.23,24
Figure 7.
Definition of T2 relaxation time and generation of T2 map. (A) T2 relaxation time is the time required for the signal to reach 37% (1/e) of its initial signal after generation by tipping the longitudinal magnetization toward the transverse magnetic plane. (B) Generation of T2 map. T2 map is generated by sampling multiple echo times by using multiecho sequences and plotting the echo time (TE) versus the natural log of the signal intensity. T2 relaxation time is calculated by using a least-square curve fitting algorithm. Gray-scale map is converted to color-coded map, and each color represents a different range of T2 relaxation time. (Modified from BJ Dardzinski, PhD, Philadelphia, PA.)
A T2 map is generated by sampling multiple echo times (TE) and plotting the TE against the natural log of the signal intensity (see Fig. 7B). T2 relaxation time is calculated by using a least square curve fitting algorithm.25 The spatial compartmentalization of water in the intracellular and extracellular spaces of muscle contributes different components to the T2 relaxation time. Intracellular water, which comprises 80% of the water signal of muscle, contributes a fast component on the order of 20 to 40 milliseconds.21 Extracellular water, which comprises 10% of the water signal of muscle, contributes a slow component with a T2 relaxation time between 150 and 400 milliseconds.21 A small remainder of the T2 signal from muscle (less than 10%) is determined by the hydrogen shell of macromolecules, which contributes a very fast component, less than 5 milliseconds.26 Owing to this multiexponential decay, the use of a sequence that includes multiple echo acquisitions at very short echo spacing, on the order of less than 1 millisecond, is ideal for more accurate analysis of skeletal muscles.27 However, in light of technical limitations of current clinical MR scanning systems, monoexponential decay of the muscles is generally observed.2,16,22,27
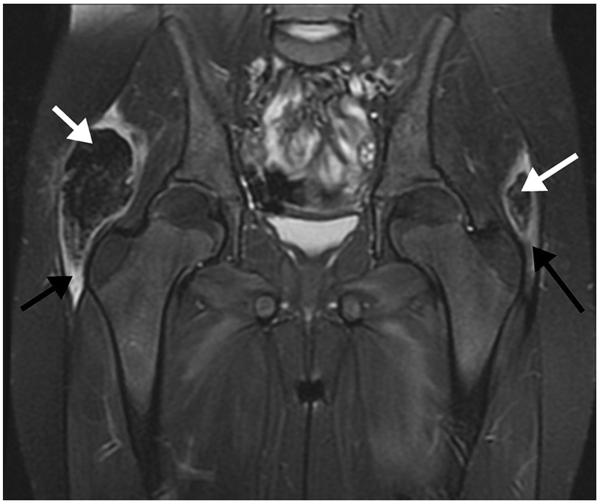
T2 relaxation time mapping can be used to quantify muscle edema and inflammation in a variety of skeletal muscle disorders that affect children. The most commonly encountered pediatric myopathies are related to hereditary muscular dystrophies and nonhereditary autoimmune diseases, both of which typically affect numerous muscle groups symmetrically. Juvenile dermatomyositis (JDM), the most common idiopathic myositis, typically presents with proximal, symmetric muscle weakness and a characteristic violaceous rash. The disease can be self-limited or chronic with systemic morbidity. MR imaging shows characteristic symmetric muscle edema (see Fig. 3). Concurrent fascial and subcutaneous involvement frequently is seen, with the latter conferring a worse and more chronic prognosis.28 Dystrophic calcifications ultimately may develop within the affected muscles (Fig. 8).28,29 Maillard and colleagues2 described significantly increased T2 relaxation times of muscle in children with active disease in a comparison with healthy controls and patients with inactive disease.
Figure 8.
An 8-year-old girl with juvenile dermatomyositis with dystrophic calcification. Coronal FS T2-weighted MR image shows low signal intensity masses (white arrows) in the lateral aspects of the gluteus maximus muscles bilaterally, with surrounding muscle edema (black arrows). The masses correspond to dystrophic calcifications.
T2 relaxation time mapping can also be used to quantitate fatty infiltration in children with a variety of muscular dystrophies. Duchenne muscular dystrophy (DMD), an X-linked disorder found in boys, is the most common progressive muscular dystrophy of children. DMD is caused by mutations in the gene that encodes dystrophin, a protein essential to normal muscle function. Muscle fiber damage results from a destabilized sarcolemma, with subsequent muscle necrosis and eventual fatty replacement (see Fig. 2). This disease typically is diagnosed around 5 years of age as symmetric and progressive muscle weakness, classically involving the thighs. Death usually occurs by the third to fourth decades. MR imaging can show muscle edema secondary to inflammation, but the hallmark of MR imaging in DMD is the gradual and symmetric fatty replacement of select muscle groups.14
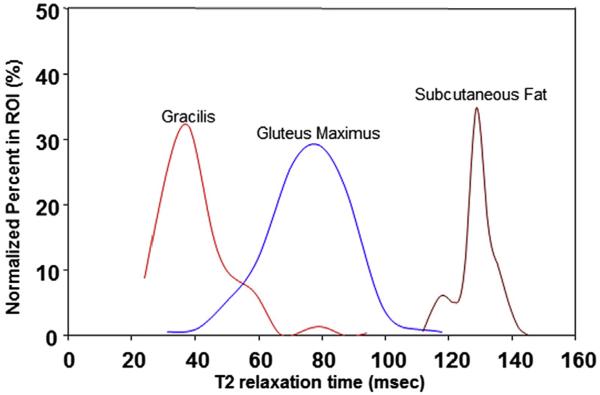
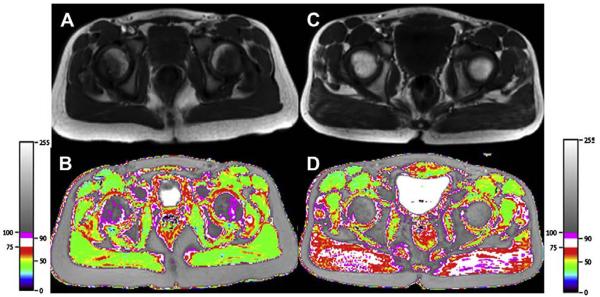
Prior studies have described T2 mapping in children with DMD, showing increased T2 relaxation times consequent to this fatty infiltration (Figs. 9 and 10).14,22 T2 relaxation times have good correlation with fatty infiltration grading assessed qualitatively on T1WI and with clinical functional motor scores in DMD patients.14 T2 mapping also can be used to quantify the small amount of physiologic fat in normal skeletal muscles of healthy children and enable the complete segregation of boys with DMD from healthy boys, even when the difference in fatty infiltration is not easily appreciated on T1WI (see Fig. 10).5,30,31 Acquiring T2 mapping data without and with fat-suppression techniques allows for the separation of concurrent fatty infiltration from edema and/or inflammation in boys with DMD.6 Application of this quantitative and objective MR imaging method can be extended to a longitudinal study to determine the treatment response in diseases of skeletal muscle.14
Figure 9.
Histogram obtained from pelvic muscles of an 8-year-old boy with DMD. Placement of region of interest (ROI) produces the distribution of the T2 relaxation times of the ROI. As each muscle has a different volume, pixel volumes are normalized and a histogram is made for each ROI. This histogram demonstrates distribution of T2 relaxation times of the subcutaneous fat (right, longest), gluteus maximus muscle (middle), and gracilis muscle (left, shortest).
Figure 10.
T2 mapping in a 7-year-old healthy boy (left) and a boy with DMD (right). T1-weighted MR image demonstrates minimal degree of fatty infiltration of gluteus maximus muscles in the healthy boy (A) and the boy with DMD (C). Both boys were graded as grade 1 fatty infiltration on T1-weighted MR images. T2 relaxation time mapping, however, demonstrates a significant difference between the two boys. T2 map demonstrates increased T2 relaxation times within the gluteus maximus muscles in the boy with DMD (D) in comparison with those of the healthy boy (B).
T2 relaxation times may be affected by muscle activity. Muscle contraction requires energy consumption and produces by-product osmolites such as sodium, phosphate, and lactate. Increased osmolality causes water influx into the muscles, which in turn results in increased intracellular water. This increase in water content increases T2 relaxation times.32 Therefore, it is important when using T2 mapping to evaluate skeletal muscle that subjects should be asked to refrain from excessive ambulation and exercise for at least 12 hours before MR imaging.19
T2 mapping has great potential to demonstrate nonuniform involvement of muscles in a variety of normal and pathologic states,19 such as localized nerve injury. Improvements in spatial resolution in T2 mapping techniques are still needed, to enable mapping of territories as small as individual motor units.
Dixon Imaging
Dixon imaging is an MR imaging technique used to measure fat fractions and obtain homogeneous fat-suppressed images when other conventional techniques fail because of inhomogeneities of the magnetic field.33–35 In Dixon imaging, first proposed and developed by Thomas Dixon, modified dual spin-echo sequences are used such that the first echo image is acquired when water and fat protons are in phase with each other, and the next echo image is acquired when water and fat are in opposed phases. Both echoes are acquired in a single repetition time. The in-phase and opposed-phase TE are based on the chemical shift between the precessing water and lipid protons and, hence, are field-strength dependent (Fig. 11).36 On a typical 3-T MR scanner the first echo is acquired at approximately 1.2 milliseconds, which is the TE for an opposed-phase image, and the second in-phase echo is acquired at a TE of 2.4 milliseconds, in contrast to a 1.5-T scanner where the opposed-phase TE is approximately 2.3 milliseconds and the in-phase TE 4.6 milliseconds.
Figure 11.
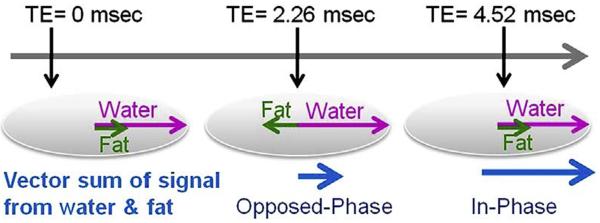
Dixon imaging with in-phase and opposed-phase. The in-phase and opposed-phase acquisition times or echo times (TE) are based on chemical shift time between the precessing water and lipid protons. At 1.5 T, the opposed-phase TE is approximately 2.26 milliseconds and the in-phase TE is 4.52 milliseconds.
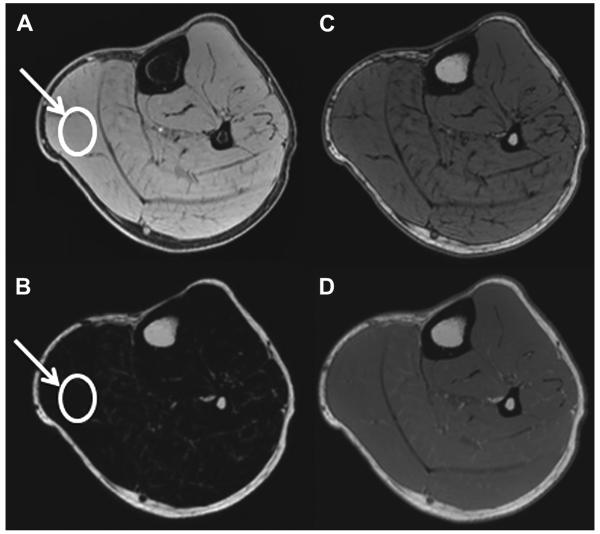
With the Dixon technique, the net signal from a voxel is determined by the water and fat composition of the tissue; if the voxel contains only water or fat, its net signal for the 2 acquisitions will be the same, because the signal from one component will be zero. By contrast, a voxel containing both water and fat will have different signals from the two acquisitions (Fig. 12). Using this information, the in-phase and opposed phase images are then added or subtracted to generate a water-only or a fat-only image (see Fig. 12).37,38
Figure 12.
An example of (A) water, (B) fat, (C) opposed-phase, and (D) in-phase images of the calf in a healthy subject. The benefit of Dixon imaging is that multiple image contrasts can be acquired in single scan: water, fat, in-phase, and opposed-phase images. In addition, muscle fat fraction can be calculated by drawing an ROI (arrow) on the water and fat images (fat fraction 5 signal intensity on fat image/signal intensity on fat image 1 signal intensity on water image). The fat fraction for this subject was calculated to be 5%.
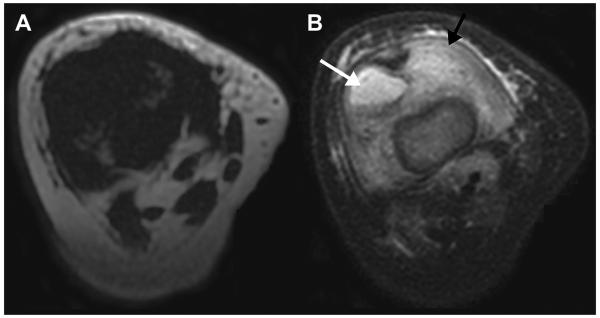
In the presence of magnetic-field inhomogeneity (eg, adjacent to surgical hardware or locations such as the neck, breast, or ankle where there are convoluted soft tissue–air interfaces), the fat resonance frequency typically varies over the entire image volume. Such circumstances result in poor fat suppression with conventional frequency-selective fat-suppression techniques. The water-only image obtained through the Dixon technique can be used in such scenarios when fat suppression is desired for clinical indications (Fig. 13).33,38,39 Dixon imaging is also a successful technique with which to obtain uniform fat-saturation images at higher field strengths.40,41
Figure 13.
Dixon technique with improved fat suppression: iterative decomposition of water and fat with echo asymmetry and least-squares estimation (IDEAL). (A) Axial T2-weighted MR image of the right knee with conventional fat suppression and (B) Dixon applied water imaging in a patient with septic arthritis and osteomyelitis. (A) Fat suppression is nonuniform owing to an inhomogeneous magnetic field created by a large field of view covering both lower extremities from hip to ankle), as well as flexion of the knee, yielding images with minimal water signal. (B) The initially obscured but highly significant findings of joint fluid (white arrow) and muscle edema (black arrow) (representing septic arthritis and myositis in this case, respectively) are clearly visualized with the Dixon technique.
A quantitative fat-fraction value can also be calculated from the generated water-only and fat-only images by taking a ratio of fat signal intensity versus the sum of the water and fat signal intensities.3 The fat-fraction value can be plotted as a map on a pixel-by-pixel basis or by drawing a region of interest (ROI). The fat fraction is equal to the ratio of the signal intensity from the fat only image to the sum of the signal intensity on the fat-only image and the signal intensity of the water-only image (see Fig. 12).
The muscle fat-fraction measurement by Dixon imaging is noninvasive, objective, and highly reproducible. Gaeta and colleagues7 report that the muscle fat-fraction value acquired using MR imaging correlates well with histopathology results in patients with neuromuscular disorders. Other reports show that the fat-fraction value obtained with the Dixon technique is accurate in the assessment of disease severity in patients with DMD42 and correlates with muscle histology.43 Therefore, the quantitative fat-fraction measurement obtained with MR imaging may be a useful biomarker in quantifying fatty infiltration as a predictor of disease progression and therapeutic response.
Diffusion-Weighted Imaging
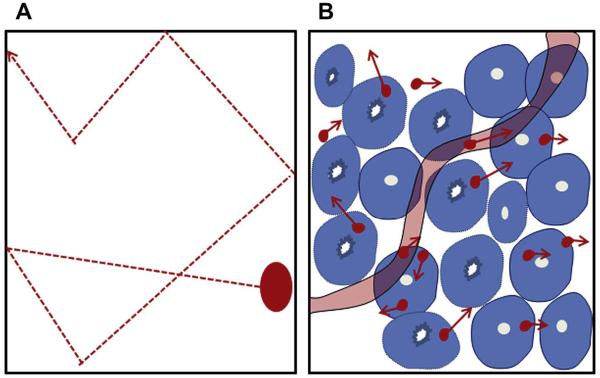
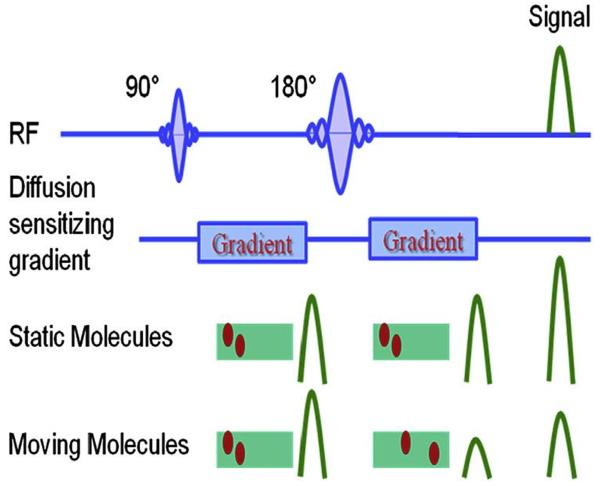
DW imaging is sensitive to the effects of water diffusion on MR signal intensity.44 The cellular membrane integrity affects the transcellular, intracellular, and extracellular motion of water molecules (Fig. 14). In an unrestricted environment, water moves freely (free Brownian motion) (see Fig. 14A). In biological tissue, however, cellular membranes restrict the motion of water molecules. Thus the apparent diffusion coefficient (ADC) of tissue water reflects cellular membrane integrity and microcirculation (perfusion) (see Fig. 14B). In DW imaging, there is a dephasing of spins and subsequent rephasing by gradients placed generally on either side of a refocusing pulse. While stationary molecules are rephrased at the end of the sequence, molecules in motion are incompletely rephased, which results in loss of signal (signal attenuation) (Fig. 15).45 DW sequences can be generated using spin-echo DW imaging, 46 echo planar imaging,47 and steadystate free precession sequences.48 The ADC of water is calculated by plotting the signal intensity of the tissue against the applied diffusion gradient strength (b-value). Diffusion attenuation depends on the b-value for contrast, with higher b-values leading to greater sensitivity to diffusion and greater attenuation of the signal. A higher ADC means a longer mean free path length of the water molecules, a steeper slope of the plot, and less cellularity (Fig. 16).
Figure 14.
(A) In the uninhibited condition, water molecules have free and random motion. (B) In biological tissue, the motion of water molecules is limited by interaction with cellular components; cellular membrane integrity and cellularity. ([B] Adapted from Koh DM, Collins DJ. Diffusion-weighted MRI in the body: applications and challenges in oncology. AJR Am J Roentgenol 2007;188(6):1622-23; with permission.)
Figure 15.
Diffusion-weighted (DW) imaging sequences. Initially, diffusion sequences cause dephasing of spins and subsequent rephasing by an opposite gradient. While static molecules are rephased at the end of the sequences, molecules in motion are less uniformly rephrased than more static molecules, resulting in and loss of signal (signal attenuation) and being out of plane. (Adapted from Koh DM, Collins DJ. Diffusionweighted MRI in the body: applications and challenges in oncology. AJR Am J Roentgenol 2007;188(6):1623; with permission.)
Figure 16.
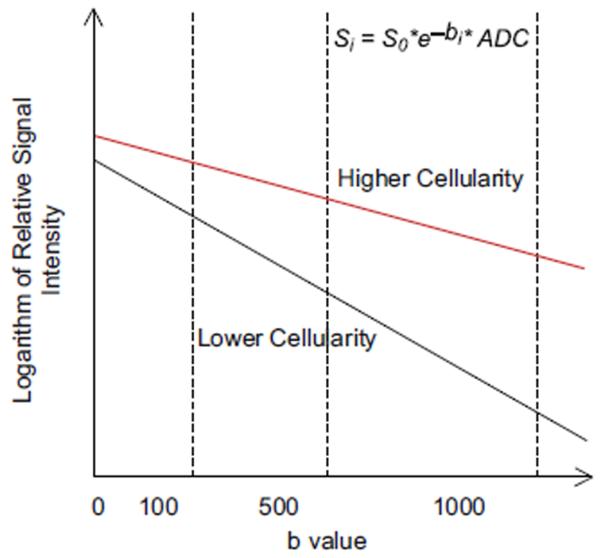
The apparent diffusion coefficient (ADC) value is calculated by using a plot of log of signal intensity versus the diffusion strength (b-value) of the tissue; higher ADC means greater mean free path length of the water molecules, steeper slope of a plot, and less cellularity.
ADC values have been used as markers of tissue cellularity in oncologic imaging,49 with ADC values less than 1.5 × 10⁻³ mm2/s reflecting high cellularity (>150 cells per high-power field).50 However, Humphries and colleagues50 showed that ADC values are not able to differentiate benign from malignant neoplasms. DW imaging can also be used to evaluate the cellularity of skeletal muscle neoplasms in children (Fig. 17).
Figure 17.

An 18-year-old boy with spindle-cell sarcoma of the right thigh. (A) ADC map demonstrates high ADC values (>1.5× 10⁻³ mm2/s): mean value of entire tumor, 2.13 × 10⁻³ mm2/s (ROI 3); central necrosis (ROI 1), 2.94 × 10⁻³ mm2/s; relatively high cellular area, 1.64 × 10⁻³ mm2/s (ROI 2). Corresponding high cellular area (ROI 2) demonstrates solid component on (B) T2-weighted MR image with fat suppression, and more contrast enhancement than area of necrosis (ROI 1) on (C) precontrast and (D) postcontrast T1-weighted MR images.
Normal skeletal muscle has a biexponential attenuation pattern. ADC estimates obtained with b-values from 0 to 50 s/mm2 reflect a combination of diffusion and perfusion, whereas ADC estimates using b-values of 50 to 750 s/mm2 reflect true diffusion. Therefore, the ADC of skeletal muscles should be obtained using b-values of at least 100 s/mm2.
The application of DW imaging to evaluate systemic skeletal muscle disorders has been used only in scientific studies.4 ADC values of normal skeletal muscle are significantly higher than those of subcutaneous fat (Fig. 18).4 Muscle edema from radiation therapy and muscle inflammation associated with adjacent osteomyelitis both lead to an increase in extracellular water content. In cytotoxic edema from radiation or inflammation, there is an increase in free mean path length of the water molecules, which results in an increase in ADC value45; this situation is similar to cytotoxic edema of the brain, which also increases the ADC.
Figure 18.
DW image obtained using 5 different B values (B 5 0, 10, 100, 500, and 1000). ADC map demonstrates very low ADC value of the bone (arrow) and subcutaneous fat (circle). Black color on the scale corresponds to the lowest ADC value. The skeletal muscles show higher ADC values than for bone and subcutaneous fat.
Diffusion Tensor Imaging
DT imaging measures the anisotropy of water diffusion, and is used widely in brain imaging to show the orientation and integrity of white matter tracts.51,52 The underlying principle of DT imaging is that the water diffusion will be greater along the orientation of the fibers than in another direction. Estimates of the diffusion anisotropy can be generated from DW imaging data and the corresponding calculated maps.
To minimize magnetic field inhomogeneity, reduce noise, and optimize the coil-filling factor, DT imaging is preferentially performed using the smallest-volume coils.53 DT imaging data sets are generated by adding at least 6 diffusion gradient directions to a typical DW imaging sequence and by using 2 b-values (Fig. 19), usually b = 0 and b = 500 to 1000 s/mm2.54. A DT value is calculated from the DW imaging data for each voxel in the dataset. The fractional anisotropy (FA), a measure of how “directional” the water diffusion is, and the mean diffusivity, or average length of diffusion along the selected directions, are calculated from the tensor images. The mathematical calculations for the tensor values are described in detail by Le Bihan and colleagues.54–56 FA is the most widely used tensor value and represents the anisotropy index of water molecules. For easy visualization, the FA maps are color-coded in red, green, and blue. A color code is assigned to each of the x, y, and z orientations (Fig. 20). A numerical FA value can be obtained from the FA map on a pixel-by-pixel basis, or an ROI can be drawn on the map to compute a cumulative number. The FA values in a normal and an abnormal population can be compared. Fiber tracking is a method that shows simplified directional tensor information by connecting similarly oriented neighboring vectors to follow a trajectory.57–59 This technique can help identify location, size, and shape of specific fiber tracks of interest.
Figure 19.
Diffusion tensor (DT) imaging sequences. DT images using a single-shot spin-echo planar imaging pulse sequence (9 directions; b-value: 500 s/mm2). (A) 1, image along z-axis; 2–9, images with different gradient directions. (B) High-resolution T2-weighted MR image with fat suppression. Baseline image used for contour overlay. (C) Fractional anisotropy map.
Figure 20.
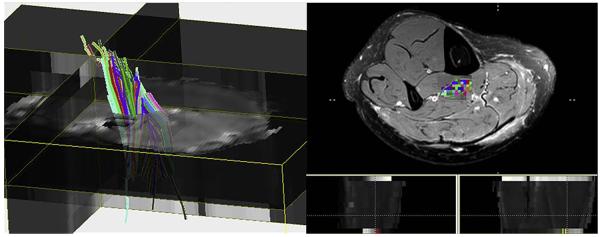
Human calf muscle tractography: Fiber tracts were calculated using DTI Studio (Johns Hopkins Medical Institute, Baltimore, MD). An ROI was placed on the tibialis posterior muscle to generate fiber tracking. The different colors represent different directions of the fibers.
DT imaging can be applied to skeletal muscle imaging to probe muscle architecture and define structural details, such as in the evaluation of skeletal muscle injury.8,9,60–63 Muscle injury from trauma or neuropathy will affect the integrity of muscle microstructure and, hence, change the DT imaging parameters. These microstructural changes are reflected by changes in FA and often precede gross morphologic or anatomic changes of the muscles, thus enabling early detection of skeletal muscle disease.64 The quantitative nature of DT imaging can play a very important role as a noninvasive surrogate marker in monitoring the therapeutic response in muscle injuries. For skeletal muscle applications, b-values of 0 and 500 are typically used with 7 or more directions.
MR Elastography
Imaging MR elastography is a phase-contrast MR imaging– based elasticity imaging technique that can calculate the shear stiffness of soft tissues by imaging the propagation of externally induced shear waves. MR elastography currently is used clinically in the evaluation of hepatic fibrosis.65 The technique essentially involves 3 steps:
Generation of shear waves. External mechanical driver systems controlled by the MR pulse sequence generate continuous harmonic shear waves in the frequency range of 50 to 300 Hz.66
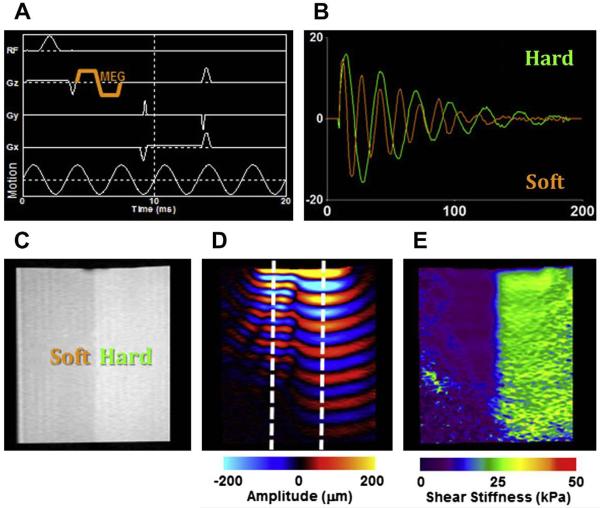
Imaging the propagation of shear waves. This critical step defines MR elastography, and is accomplished by the inclusion of motion-encoding gradients (MEG) in conventional pulse sequences, which encode the propagating shear wave information into the phase of the MR images.67 The phase of harmonically vibrating tissue is directly proportional to its displacement. The schematic of a typical gradient-recalled echo MR elastography pulse sequence with a bipolar MEG pair (of duration 3.33 milliseconds corresponding to 300 Hz motion) in the slice-selection gradient, along with the schematic of 300 Hz motion, is shown in Fig. 21A. Motion occurring in any direction and on the order of hundreds of nanometers can be successfully visualized with this technique by manipulating the position and the amplitude of the MEG. An MR image thus obtained contains both the background phase and the propagating wave information, which is typically separated by collecting 2 images with opposite MEG polarities and calculating a phase-difference image. This phase-difference image has only the motion information and is referred to as a wave image (Fig. 21B,D). The 2 regions, hard and soft, are indicated in the magnitude image, and the longer shear wavelength in the harder region is easily visible (see Fig. 21B–D).
- Calculation of shear stiffness maps. Mathematical inversion algorithms68 are used to produce quantitative maps of shear stiffness from the wave. The operating equation is
(where μ is shear stiffness, ρ physical density, and Vs wave speed). The wave speed within the phantom is calculated as the product of the motion frequency and the spatial shear wavelength (Vs = fλ) measured manually from the wave profile (see Fig. 21B). Two line profiles extracted from the wave data (indicated in Fig. 21D) in a direction perpendicular to the wave propagation are presented, and the change in shear wavelength is easily visible. From these profiles, the shear wavelengths were calculated to be 0.93 cm and 1.68 cm, resulting in shear stiffness values of 7.91 kPa and 21.62 kPa for the soft and hard layers, respectively. Fig. 21E shows the shear stiffness map of this isotropic phantom obtained with local standard frequency estimation technique.
Figure 21.
MR elastography on a 2-layer phantom. (A) MR elastography pulse sequence; motion-encoding gradient (MEG) is indicated. (B) Line-profile analysis of the shear wave data shown in (D). (C) Magnitude image, (D) wave, and (E) stiffness image of a 2-layer phantom. The longer shear wavelength in the harder region is visible both in (B) and (D). (Courtesy of Jennifer L. Kugel, BS, Mayo Clinic, Rochester, MN.)
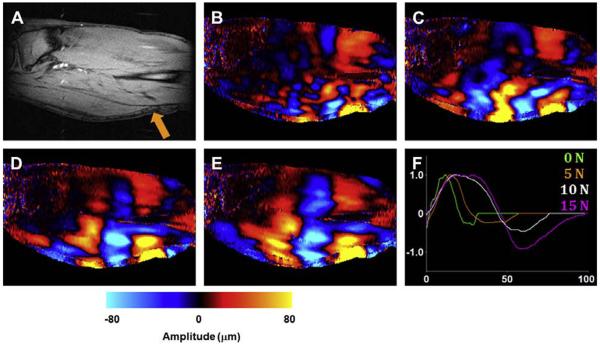
It is well known that the Young modulus of muscle is almost directly proportional to its tension, and earlier MR elastography applications focused on observing the muscle tension.69,70 Representative data from an in vivo MR elastography experiment performed at a frequency of 100 Hz on a calf muscle is shown in Fig. 22. On a sagittal magnitude image of the slice of interest, the position of the electromechanical driver used to induce shear waves is shown (indicated by the arrow in Fig. 22A). Wave data were obtained from MR elastography experiments performed with the muscle at its relaxed state and when exerting a force of 5, 10, and 15 N on a custom-built leg press (Fig. 22B–E). From these data and the wave profiles, the gradual increase in the shear wavelength and, hence, the shear stiffness (7.9, 25.6, 49.4, and 81 kPa, respectively) with the increasing force is visible (Fig. 22F).
Figure 22.
MR elastography on a calf muscle. (A) Magnitude image. Shear wave data with the muscle exhibiting (B) 0, (C) 5, (D) 10, and (E) 15 N force. (F) A line profile of a single shear wave obtained from these 4 data; the gradual increase in shear wavelength is easily visible. (Courtesy of Thomas C. Hulshizer, BS, Mayo Clinic, Rochester, MN.)
Because of the power, flexibility, and clinical potential of MR elastography, this is an active area of research where many groups have successfully implemented and assessed the shear stiffness of various healthy and pathologic muscles. Skeletal muscles undergo significant changes in their mechanical properties during both normal physiologic functioning and pathologic disease processes. Noninvasive in vivo quantification of these properties can thus potentially have a substantial impact on the diagnosis, monitoring, and management of many muscular disorders. For instance, it has been found that there is a difference in the stiffness of muscles with and without neuromuscular disease.10 The MR elastography–derived stiffness of gastrocnemius, soleus, and tibialis anterior muscles have been reported to be significantly higher in patients with poliomyelitis, flaccid paraplegia, and spastic paraplegia.10 Similarly, the shear stiffness of the trapezius muscle was higher in patients with myofascial pain compared with healthy volunteers and even the unaffected contralateral trapezius.71 It has also been reported that the stiffness of the vastus medialis increases at a faster rate after treatment in hyperthyroid patients with Graves disease in comparison with healthy volunteers. The results from a study investigating the soleus muscle of patients with hypogonadism indicate that the stiffness values were different before and after therapy, indicating the potential of MR elastography as a therapy-monitoring tool.72 The results from another study indicate that MR elastography can be directly extended to pediatric subjects and that the muscle stiffness is correlated with age.73 The same group has also reported that the differences in muscle architecture between the pediatric muscle and adult muscle can be assessed through the measurement of MR elastography shear wave propagation angle.74
In addition to the calculation of shear stiffness, MR elastography can also measure other useful mechanical properties. For example, shear wave attenuation coefficients of the vastus medialis for patients with hyperthyroid myopathy and myositis were found to be larger than those of their normal healthy counterparts.75 It has also been reported that MR elastography displacement information could be used to examine the connectivity of adjacent tissues,76 the slipperiness of tissue interfaces,77 and the functional analysis of flexor muscle compartments.78 One of the main limitations of MR elastography of the muscle is that the stiffness is still assessed with a manual technique, which could show subjective variation, but ongoing work in this domain may address this issue in the near future.79
Thus the assessment of stiffness of both adult and pediatric muscles by MR elastography, although not yet in clinical use, has the potential to improve the diagnosis and prognosis of many skeletal muscle disorders.
MR Spectroscopy
MR spectroscopy provides information about the chemical composition of tissue rather than its anatomic structure. The most commonly studied nucleus for muscle MR spectroscopy is phosphorus-31 (31P). In addition to 31P, carbon- 13 (13C) and proton (1H) studies have been done, each of which provides unique information about muscle composition and metabolism. Although multinuclear systems are increasingly available, most are still proton-only. 13C studies require additional resources.80
Before beginning the MR spectroscopy study, it is essential to choose the proper coil. Surface coils have high sensitivity, but their B1 fields are inhomogeneous. Surface coils have the advantage that they can be positioned nearly anywhere. Volume coils have better B1 homogeneity, but their use may restrict the anatomy studied or limit how well the subject is positioned in the scanner. For example, if the vastus lateralis muscle is under investigation, a volume coil could be used, but getting both the coil and the thigh centered in the magnet would be difficult. A surface coil would be a better choice for this muscle, whereas a volume coil would suffice for any muscle in the lower leg. The choice of coils is a greater concern for proton studies; for 31P, most investigators are limited to a vendor-supplied surface coil.
When setting up the study, the patient should be positioned such that the area of interest is as close to the center of the bore as possible. Voxels should be as large as possible, but placed and sized such that no subcutaneous fat is included. The muscle fascia should be avoided.81 For localized spectroscopy using the PRESS (Point- RESolved Spectroscopy) sequence, echo time needs to be optimized. In general, a short TE is better for measuring lipids because they tend to have relatively short transverse relaxation times. The repetition time should be relatively long (2000–3000 milliseconds) to minimize saturation effects. Although TE is not relevant for a simple pulse-and-acquire sequence, such as is commonly used for dynamic 31P MR spectroscopy, the repetition time should still be long. The number of excitations or averages depends on the parameter of interest and the type of acquisition, static or dynamic. Static MR spectroscopy provides a snapshot of the metabolite levels at a particular time. Dynamic MR spectroscopy measures metabolite signal intensities following some kind of intervention, such as during an exercise challenge (for 31P MR spectroscopy), and is of use when the rates of change for various metabolites are of interest. In general, for static measurements of most metabolite peaks, 64 to 128 averages should suffice. For dynamic studies, the number of averages should be the minimum that provides a signal-to-noise ratio of at least 2. For unlocalized 31P MR spectroscopy of muscle, 4 to 8 averages should be adequate, particularly for dynamic scans whereby temporal resolution is important. Unlike conventional MR imaging, the information in an MR spectroscopy experiment is contained in the peaks of the spectrum, each of which occurs at a specific, generally invariant, position. For example, the water peak occurs at 4.7 ppm, whereas the lipid peak occurs at 1.3 ppm. The term “ppm” refers to the shift of the resonant frequency of the peak with respect to the absolute frequency of some reference compound.82 The areas under the peaks are related to the concentrations of the compounds generating the peaks, which is generally the parameter of interest.
Several software packages are available for analysis of the spectral data. The software used to identify and analyze these peaks should minimally allow for measurement of peak height and area. Most vendors supply rudimentary spectral analysis software with the scanner that will provide this information. If more quantitative information is required, software packages such as LCModel83 or jMRUI84 may be used to extract estimates of metabolite concentration.
Proton MR spectroscopy
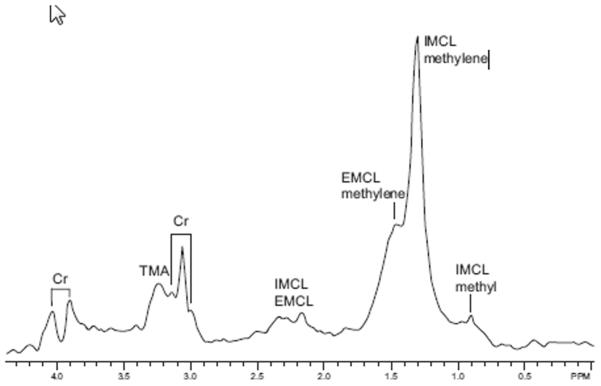
Proton MR spectroscopy studies of muscle show resonances from fat, water, creatine (Cr), and trimethylammonium-containing compounds (TMA). Significant interest in proton MR spectroscopy of muscle began with the work of Boesch and colleagues,81,85,86 who realized that proton MR spectra from muscle depended on the orientation of the muscle fibers with respect to the main magnetic field. When the muscle fibers are parallel with the main magnetic field, the major lipid resonance, around 1.3 to 1.5 ppm, splits into two distinct peaks. The peak at 1.28 ppm is assigned to intramyocellular lipids (IMCL) and the other is assigned to extramyocellular lipids (EMCL).85 The IMCL signal originates from droplets in the muscle cells, whereas the EMCL signal originates from “bulk” fat. The IMCL signal is insensitive to the orientation of the muscle with the field, whereas the EMCL signal, which arises from lipid stored parallel to the muscle fibers, is extremely sensitive to muscle orientation. A representative water-suppressed spectrum showing Cr, TMA, IMCL, and EMCL is shown in Fig. 23. To assess the intramyocellular and extramyocellular lipids (IMCL or EMCL), the fibers of the muscle of interest should be as close to parallel with the bore as possible. Thus, muscles such as vastus lateralis, semitendinosus, tibialis anterior, and gastrocnemius, in which the fibers tend to run the length of the leg, are well suited for IMCL/EMCL measurements.
Figure 23.
Water-suppressed spectrum from the thigh of a normal subject showing the main resonances. Cr, creatine; EMCL, extramyocellular lipid; IMCL, intramyocellular lipid; TMA, trimethylammonium-containing compounds.
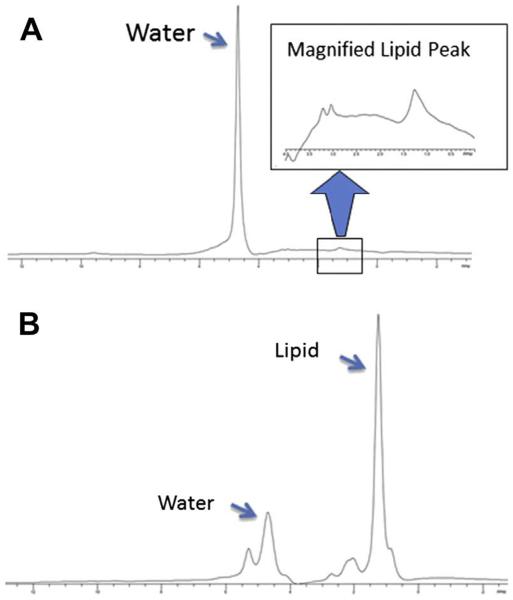
Studies of proton MR spectroscopy applied to inherited metabolic muscle disease are rare. Bongers and colleagues87 published an early case report comparing healthy volunteers with 3 patients with muscle disease myopathy, myositis, and muscle injury from radiation, and found alterations in lipid and TMA signals with disease. A comparison study of patients with DMD and spinal muscular atrophy and normal volunteers found that both patient groups had lower TMA/water and TMA/Cr ratios than the controls, but Cr/water ratios were normal.11 In a follow-up study, of 8 DMD patients compared with 8 healthy controls, DMD patients had lower TMA/water, Cr/water, and TMA/Cr than controls, and muscle function negatively correlated with the TMA/Cr ratio.12 Studies of IMCL/EMCL have been restricted to diabetes, insulin resistance, and lipid metabolism, mostly performed in adult populations. Spectra from a DMD patient and normal volunteer (Fig. 24) clearly show the increased lipid content in the DMD patient, which reflects the fatty infiltration of the muscle.
Figure 24.
(A) Spectrum from a normal subject showing primarily the water peak. Inset shows lipid region at increased scale; the Cr and TMA peaks are barely visible. (B) Non–water-suppressed spectrum from a DMD patient showing elevated lipid signal.
Phosphorus MR Spectroscopy
In contrast to proton MR spectroscopy, phosphorus MR spectroscopy has long been used to study muscle metabolism because 31P MR spectroscopy can detect signals from phosphocreatine (PCr), adenosine triphosphate (ATP), and inorganic phosphate (Pi), all of which are involved in energy metabolism via the creatine kinase reaction: PCr + ADP →ATP + Pi where ADP is adenosine diphosphate.
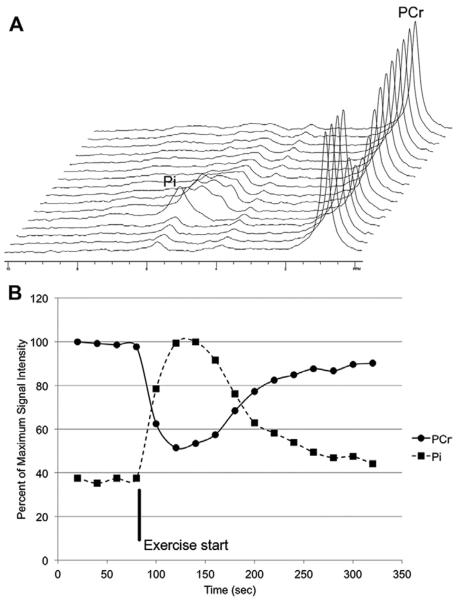
Other visible peaks include those from phosphomonoesters and phosphodiesters. In addition, estimates of tissue pH can be derived from the phosphorus MR spectroscopy measurement.88 Because unlocalized 31P MR spectroscopy data can be acquired quickly, the method is well suited to dynamic exercise studies from which the depletion and recovery rates of PCr can be calculated to provide additional information about mitochondrial function or health.89 An example of such a dynamic scan from a healthy volunteer is shown in Fig. 25.
Figure 25.
(A) Series of spectra acquired from the tibialis anterior before, during, and after plantar flexion of the foot. Time increases along the axis running toward the back. The increase in inorganic phosphate (Pi) and decrease in phosphocreatine (PCr) are clearly visible. (B) Signal intensities over time for Pi and PCr extracted from the spectra in (A).
In a study of sarcoglycan-deficient limb-girdle muscular dystrophy, the disease group had normal levels of the phosphorus metabolites and normal muscle oxidative metabolism in the calf, but elevated tissue pH.90 Fat infiltration correlated inversely with pH and directly with PCr/ATP.90 Another study comparing patients with Becker muscular dystrophy (BMD) or Friedreich ataxia (FRDA) with normal subjects found that patients with FRDA depleted PCr levels to a lesser extent than either BMD patients or normal controls.91 Despite not depleting their PCr reserves, FRDA patients recovered PCr more slowly than controls.91 BMD patients also recovered more slowly than controls, similar to FRDA patients, suggesting mitochondrial dysfunction in both groups.91 The investigators did not report whether the groups differed in baseline PCr or Pi levels. Park and colleagues92 reported lower levels of ATP and PCr in the muscles of patients with juvenile dermatomyositis than in controls. Pi/PCr ratios and ADP levels were elevated, suggesting defective oxidative phosphorylation in the mitochondria of these patients.92
DMD is probably the disease most widely studied with 31P MR spectroscopy.93–95 One of the first reports using 31P MR spectroscopy in DMD patients found decreased PCr/ATP and PCr/Pi ratios in subjects with DMD in comparison with normal controls.93 Spectra from DMD patients consistently showed a phosphodiester peak not seen in control spectra.93 DMD patients also had significantly higher tissue pH.93 Younkin and colleagues94 later confirmed these results and also found significant age-related changes in the phosphorus metabolites. The decreased PCr/ATP and PCr/Pi ratios have been confirmed in multiple studies.95–97 A combined 1H and 31P MR spectroscopy study found that whereas the 1H MR spectroscopy studies provided measures correlated to functional score (primarily fat content), the 31P MR spectroscopy, despite showing abnormalities between subjects and controls, did not correlate with functional score.97 However, this study had a relatively small sample size and did not examine the effects of exercise on PCr, which might be expected to be a better representation of functional ability than static measurements.97
SUMMARY
Recent advances in MR imaging techniques, particularly quantitative measurements, are just beginning to be used in the assessment of normal muscle and various muscle abnormalities. To date, most investigations have been performed in adults. However, the spectrum of muscle disorders in children might be a fertile area for future application. This article reviews a variety of advanced MR imaging techniques that go beyond the most commonly used conventional, subjective, semiquantitative methods. Further investigation of these quantitative MR imaging techniques may aid in understanding the pathophysiology of various muscle disorders in children, and offer new opportunities for establishing diagnoses and directing therapies.
KEY POINTS
-
_
Recent advances in magnetic resonance (MR) imaging techniques, particularly quantitative measurements, are just beginning to be utilized in the assessment of normal muscle and various muscle abnormalities.
-
_
Most investigations are performed in adults. However, the spectrum of muscle disorders in children might be a fertile area for future application.
-
_
Further investigation of these quantitative MR imaging techniques may aid in understanding the pathophysiology of various muscle disorders in children, and offer new opportunities for establishing diagnoses and directing therapies.
Acknowledgments
Disclosures: Grant Support: RSNA Research Scholar Grant (H.K. Kim); None (D.M. Lindquist, S.D. Serai, L.L. Wang, T. Laor); Grant Support: NIH EB07593, NIH EB 001981 (Y.K. Mariappan, K.P. McGee, R.L. Ehman); Author and content manager for Amirsys, Inc (A.C. Merrow).
REFERENCES
- 1.May DA, Disler DG, Jones EA, et al. Abnormal signal intensity in skeletal muscle at MR imaging: patterns, pearls, and pitfalls. Radiographics. 2000;20(Spec No):S295–315. doi: 10.1148/radiographics.20.suppl_1.g00oc18s295. [DOI] [PubMed] [Google Scholar]
- 2.Maillard SM, Jones R, Owens C, et al. Quantitative assessment of MRI T2 relaxation time of thigh muscles in juvenile dermatomyositis. Rheumatology (Oxford) 2004;43(5):603–8. doi: 10.1093/rheumatology/keh130. [DOI] [PubMed] [Google Scholar]
- 3.Liu P, Hwang JT. Quick calculation for sample size while controlling false discovery rate with application to microarray analysis. Bioinformatics. 2007;23(6):739–46. doi: 10.1093/bioinformatics/btl664. [DOI] [PubMed] [Google Scholar]
- 4.Baur A, Reiser MF. Diffusion-weighted imaging of the musculoskeletal system in humans. Skeletal Radiol. 2000;29(10):555–62. doi: 10.1007/s002560000243. [DOI] [PubMed] [Google Scholar]
- 5.Kim HK, Wang LL, Merrow AC, et al. Compounding factors affecting fat and water content of skeletal muscles in healthy children; objective measures using T2 relaxation time mapping (T2 Map) Radiological Society of North America; Chicago: 2011. [Google Scholar]
- 6.Arpan I, Forbes SC, Lott DJ, et al. T(2) mapping provides multiple approaches for the characterization of muscle involvement in neuromuscular diseases: a cross-sectional study of lower leg muscles in 5-15-year-old boys with Duchenne muscular dystrophy. NMR Biomed. 2012;26(3):320–8. doi: 10.1002/nbm.2851. [DOI] [PMC free article] [PubMed] [Google Scholar]
- 7.Gaeta M, Mileto A, Mazzeo A, et al. MRI findings, patterns of disease distribution, and muscle fat fraction calculation in five patients with Charcot- Marie-Tooth type 2 F disease. Skeletal Radiol. 2012;41(5):515–24. doi: 10.1007/s00256-011-1199-y. [DOI] [PubMed] [Google Scholar]
- 8.Zaraiskaya T, Kumbhare D, Noseworthy MD. Diffusion tensor imaging in evaluation of human skeletal muscle injury. J Magn Reson Imaging. 2006;24(2):402–8. doi: 10.1002/jmri.20651. [DOI] [PubMed] [Google Scholar]
- 9.Sinha S, Sinha U, Edgerton VR. In vivo diffusion tensor imaging of the human calf muscle. J Magn Reson Imaging. 2006;24(1):182–90. doi: 10.1002/jmri.20593. [DOI] [PubMed] [Google Scholar]
- 10.Basford JR, Jenkyn TR, An KN, et al. Evaluation of healthy and diseased muscle with magnetic resonance elastography. Arch Phys Med Rehabil. 2002;83(11):1530–6. doi: 10.1053/apmr.2002.35472. [DOI] [PubMed] [Google Scholar]
- 11.Hsieh TJ, Wang CK, Chuang HY, et al. In vivo proton magnetic resonance spectroscopy assessment for muscle metabolism in neuromuscular diseases. J Pediatr. 2007;151(3):319–21. doi: 10.1016/j.jpeds.2007.05.026. [DOI] [PubMed] [Google Scholar]
- 12.Hsieh TJ, Jaw TS, Chuang HY, et al. Muscle metabolism in Duchenne muscular dystrophy assessed by in vivo proton magnetic resonance spectroscopy. J Comput Assist Tomogr. 2009;33(1):150–4. doi: 10.1097/RCT.0b013e318168f735. [DOI] [PubMed] [Google Scholar]
- 13.Kim HK, Laor T, Racadio JM. MR imaging assessment of the lateral head of the gastrocnemius muscle: prevalence of segmental anomalous origins in children and young adults. Pediatr Radiol. 2008;38(12):1300–5. doi: 10.1007/s00247-008-1018-3. [DOI] [PubMed] [Google Scholar]
- 14.Kim HK, Laor T, Horn PS, et al. T2 mapping in Duchenne muscular dystrophy: distribution of disease activity and correlation with clinical assessments. Radiology. 2010;255(3):899–908. doi: 10.1148/radiol.10091547. [DOI] [PubMed] [Google Scholar]
- 15.Bordalo-Rodrigues M, Rosenberg ZS. MR imaging of the proximal rectus femoris musculotendinous unit. Magn Reson Imaging Clin N Am. 2005;13(4):717–25. doi: 10.1016/j.mric.2005.08.005. [DOI] [PubMed] [Google Scholar]
- 16.Kim HK, Laor T, Graham TB, et al. T2 relaxation time changes in distal femoral articular cartilage in children with juvenile idiopathic arthritis: a 3-year longitudinal study. AJR Am J Roentgenol. 2010;195(4):1021–5. doi: 10.2214/AJR.09.4019. [DOI] [PubMed] [Google Scholar]
- 17.Mercuri E, Pichiecchio A, Allsop J, et al. Muscle MRI in inherited neuromuscular disorders: past, present, and future. J Magn Reson Imaging. 2007;25(2):433–40. doi: 10.1002/jmri.20804. [DOI] [PubMed] [Google Scholar]
- 18.Dardzinski BJ, Laor T, Schmithorst VJ, et al. Mapping T2 relaxation time in the pediatric knee: feasibility with a clinical 1.5-T MR imaging system. Radiology. 2002;225(1):233–9. doi: 10.1148/radiol.2251011461. [DOI] [PubMed] [Google Scholar]
- 19.Patten C, Meyer RA, Fleckenstein JL. T2 mapping of muscle. Semin Musculoskelet Radiol. 2003;7(4):297–305. doi: 10.1055/s-2004-815677. [DOI] [PubMed] [Google Scholar]
- 20.Mugler JP., III . Basic principles. In: Edelman RR, Hesselink JR, Zlatkin MB, et al., editors. Clinical magnetic resonance imaging. 3rd edition Saunders Elsevier; Philadelphia: 2006. pp. 23–57. [Google Scholar]
- 21.Gambarota G, Cairns BE, Berde CB, et al. Osmotic effects on the T2 relaxation decay of in vivo muscle. Magn Reson Med. 2001;46(3):592–9. doi: 10.1002/mrm.1232. [DOI] [PubMed] [Google Scholar]
- 22.Huang Y, Majumdar S, Genant HK, et al. Quantitative MR relaxometry study of muscle composition and function in Duchenne muscular dystrophy. J Magn Reson Imaging. 1994;4(1):59–64. doi: 10.1002/jmri.1880040113. [DOI] [PubMed] [Google Scholar]
- 23.Gold GE, Han E, Stainsby J, et al. Musculoskeletal MRI at 3.0 T: relaxation times and image contrast. AJR Am J Roentgenol. 2004;183(2):343–51. doi: 10.2214/ajr.183.2.1830343. [DOI] [PubMed] [Google Scholar]
- 24.Jordan CD, Saranathan M, Bangerter NK, et al. Musculoskeletal MRI at 3.0T and 7.0T: a comparison of relaxation times and image contrast. Eur J Radiol. 2013;82(5):734–9. doi: 10.1016/j.ejrad.2011.09.021. [DOI] [PMC free article] [PubMed] [Google Scholar]
- 25.Stanisz GJ, Odrobina EE, Pun J, et al. T1, T2 relaxation and magnetization transfer in tissue at 3T. Magn Reson Med. 2005;54(3):507–12. doi: 10.1002/mrm.20605. [DOI] [PubMed] [Google Scholar]
- 26.Hazlewood CF, Chang DC, Nichols BL, et al. Nuclear magnetic resonance transverse relaxation times of water protons in skeletal muscle. Biophys J. 1974;14(8):583–606. doi: 10.1016/S0006-3495(74)85937-0. [DOI] [PMC free article] [PubMed] [Google Scholar]
- 27.Saab G, Thompson RT, Marsh GD. Multicomponent T2 relaxation of in vivo skeletal muscle. Magn Reson Med. 1999;42(1):150–7. doi: 10.1002/(sici)1522-2594(199907)42:1<150::aid-mrm20>3.0.co;2-5. [DOI] [PubMed] [Google Scholar]
- 28.Ladd PE, Emery KH, Salisbury SR, et al. Juvenile dermatomyositis: correlation of MRI at presentation with clinical outcome. AJR Am J Roentgenol. 2011;197(1):W153–8. doi: 10.2214/AJR.10.5337. [DOI] [PubMed] [Google Scholar]
- 29.Johnson K, Davis PJ, Foster JK, et al. Imaging of muscle disorders in children. Pediatr Radiol. 2006;36(10):1005–18. doi: 10.1007/s00247-006-0166-6. [DOI] [PubMed] [Google Scholar]
- 30.Wang LL, Kim HK, Merrow AC, et al. MR imaging of the skeletal muscles in boys with Duchenne muscular dystrophy (DMD): part 1. Can fatty infiltration and inflammation of the gluteus maximus muscle be used as indicators of clinical assessment in boys with DMD? Society for Pediatric Radiology Meeting; San Francisco (CA): 2012. [DOI] [PubMed] [Google Scholar]
- 31.Johnston JH, Kim HK, Merrow AC, et al. MR imaging of the skeletal muscles in boys with Duchenne muscular dystrophy (DMD): part 2. T2 Relaxation time mapping (T2 map) as a noninvasive biomarker to determine pathologic fatty infiltration: comparison between boys with Duchenne muscular dystrophy (DMD) and healthy boys. Society for Pediatric Radiology Meeting; San Francisco (CA): 2012. [Google Scholar]
- 32.Fleckenstein JL, Canby RC, Parkey RW, et al. Acute effects of exercise on MR imaging of skeletal muscle in normal volunteers. AJR Am J Roentgenol. 1988;151(2):231–7. doi: 10.2214/ajr.151.2.231. [DOI] [PubMed] [Google Scholar]
- 33.Barger AV, DeLone DR, Bernstein MA, et al. Fat signal suppression in head and neck imaging using fast spin-echo-IDEAL technique. AJNR Am J Neuroradiol. 2006;27(6):1292–4. [PMC free article] [PubMed] [Google Scholar]
- 34.Mito S, Ishizaka K, Nakanishi M, et al. Comparison of fat suppression techniques of bilateral breast dynamic sequence at 3.0 T: utility of three-point DIXON technique. Nihon Hoshasen Gijutsu Gakkai Zasshi. 2011;67(6):654–60. doi: 10.6009/jjrt.67.654. in Japanese. [DOI] [PubMed] [Google Scholar]
- 35.Sijens PE, Edens MA, Bakker SJ, et al. MRIdetermined fat content of human liver, pancreas and kidney. World J Gastroenterol. 2010;16(16):1993–8. doi: 10.3748/wjg.v16.i16.1993. [DOI] [PMC free article] [PubMed] [Google Scholar]
- 36.Pykett IL, Rosen BR. Nuclear magnetic resonance: in vivo proton chemical shift imaging. Work in progress. Radiology. 1983;149(1):197–201. doi: 10.1148/radiology.149.1.6310682. [DOI] [PubMed] [Google Scholar]
- 37.Ahmad M, Liu Y, Slavens ZW, et al. A method for automatic identification of water and fat images from a symmetrically sampled dual-echo Dixon technique. Magn Reson Imaging. 2010;28(3):427–33. doi: 10.1016/j.mri.2009.11.005. [DOI] [PMC free article] [PubMed] [Google Scholar]
- 38.Ma J. Dixon techniques for water and fat imaging. J Magn Reson Imaging. 2008;28(3):543–58. doi: 10.1002/jmri.21492. [DOI] [PubMed] [Google Scholar]
- 39.Le-Petross H, Kundra V, Szklaruk J, et al. Fast three-dimensional dual echo Dixon technique improves fat suppression in breast MRI. J Magn Reson Imaging. 2010;31(4):889–94. doi: 10.1002/jmri.22067. [DOI] [PubMed] [Google Scholar]
- 40.Cornfeld DM, Israel G, McCarthy SM, et al. Pelvic imaging using a T1W fat-suppressed 3-dimensional dual echo Dixon technique at 3T. J Magn Reson Imaging. 2008;28(1):121–7. doi: 10.1002/jmri.21402. [DOI] [PubMed] [Google Scholar]
- 41.Gold GE, Reeder SB, Yu H, et al. Articular cartilage of the knee: rapid three-dimensional MR imaging at 3.0 T with IDEAL balanced steady-state free precession– initial experience. Radiology. 2006;240(2):546–51. doi: 10.1148/radiol.2402050288. [DOI] [PubMed] [Google Scholar]
- 42.Wren TA, Bluml S, Tseng-Ong L, et al. Three-point technique of fat quantification of muscle tissue as a marker of disease progression in Duchenne muscular dystrophy: preliminary study. AJR Am J Roentgenol. 2008;190(1):W8–12. doi: 10.2214/AJR.07.2732. [DOI] [PubMed] [Google Scholar]
- 43.Kinali M, Arechavala-Gomeza V, Cirak S, et al. Muscle histology vs MRI in Duchenne muscular dystrophy. Neurology. 2011;76(4):346–53. doi: 10.1212/WNL.0b013e318208811f. [DOI] [PMC free article] [PubMed] [Google Scholar]
- 44.Hajnal JV, Doran M, Hall AS, et al. MR imaging of anisotropically restricted diffusion of water in the nervous system: technical, anatomic, and pathologic considerations. J Comput Assist Tomogr. 1991;15(1):1–18. doi: 10.1097/00004728-199101000-00001. [DOI] [PubMed] [Google Scholar]
- 45.Schaefer PW, Grant PE, Gonzalez RG. Diffusionweighted MR imaging of the brain. Radiology. 2000;217(2):331–45. doi: 10.1148/radiology.217.2.r00nv24331. [DOI] [PubMed] [Google Scholar]
- 46.Le Bihan D, Breton E, Lallemand D, et al. MR imaging of intravoxel incoherent motions: application to diffusion and perfusion in neurologic disorders. Radiology. 1986;161(2):401–7. doi: 10.1148/radiology.161.2.3763909. [DOI] [PubMed] [Google Scholar]
- 47.Turner R, Le Bihan D, Maier J, et al. Echo-planar imaging of intravoxel incoherent motion. Radiology. 1990;177(2):407–14. doi: 10.1148/radiology.177.2.2217777. [DOI] [PubMed] [Google Scholar]
- 48.Buxton RB. The diffusion sensitivity of fast steadystate free precession imaging. Magn Reson Med. 1993;29(2):235–43. doi: 10.1002/mrm.1910290212. [DOI] [PubMed] [Google Scholar]
- 49.Cui Y, Zhang XP, Sun YS, et al. Apparent diffusion coefficient: potential imaging biomarker for prediction and early detection of response to chemotherapy in hepatic metastases. Radiology. 2008;248(3):894–900. doi: 10.1148/radiol.2483071407. [DOI] [PubMed] [Google Scholar]
- 50.Humphries PD, Sebire NJ, Siegel MJ, et al. Tumors in pediatric patients at diffusion-weighted MR imaging: apparent diffusion coefficient and tumor cellularity. Radiology. 2007;245(3):848–54. doi: 10.1148/radiol.2452061535. [DOI] [PubMed] [Google Scholar]
- 51.Stieltjes B, Kaufmann WE, van Zijl PC, et al. Diffusion tensor imaging and axonal tracking in the human brainstem. Neuroimage. 2001;14(3):723–35. doi: 10.1006/nimg.2001.0861. [DOI] [PubMed] [Google Scholar]
- 52.Hoon AH, Jr, Lawrie WT, Jr, Melhem ER, et al. Diffusion tensor imaging of periventricular leukomalacia shows affected sensory cortex white matter pathways. Neurology. 2002;59(5):752–6. doi: 10.1212/wnl.59.5.752. [DOI] [PubMed] [Google Scholar]
- 53.Gilbert G, Simard D, Beaudoin G. Impact of an improved combination of signals from array coils in diffusion tensor imaging. IEEE Trans Med Imaging. 2007;26(11):1428–36. doi: 10.1109/TMI.2007.907699. [DOI] [PubMed] [Google Scholar]
- 54.Le Bihan D, Mangin JF, Poupon C, et al. Diffusion tensor imaging: concepts and applications. J Magn Reson Imaging. 2001;13(4):534–46. doi: 10.1002/jmri.1076. [DOI] [PubMed] [Google Scholar]
- 55.Le Bihan D, van Zijl P. From the diffusion coefficient to the diffusion tensor. NMR Biomed. 2002;15(7–8):431–4. doi: 10.1002/nbm.798. [DOI] [PubMed] [Google Scholar]
- 56.Clark CA, Le Bihan D. Water diffusion compartmentation and anisotropy at high b values in the human brain. Magn Reson Med. 2000;44(6):852–9. doi: 10.1002/1522-2594(200012)44:6<852::aid-mrm5>3.0.co;2-a. [DOI] [PubMed] [Google Scholar]
- 57.Mori S, Crain BJ, Chacko VP, et al. Three-dimensional tracking of axonal projections in the brain by magnetic resonance imaging. Ann Neurol. 1999;45(2):265–9. doi: 10.1002/1531-8249(199902)45:2<265::aid-ana21>3.0.co;2-3. [DOI] [PubMed] [Google Scholar]
- 58.Mori S, van Zijl PC. Fiber tracking: principles and strategies—a technical review. NMR Biomed. 2002;15(7–8):468–80. doi: 10.1002/nbm.781. [DOI] [PubMed] [Google Scholar]
- 59.Basser PJ, Pajevic S, Pierpaoli C, et al. In vivo fiber tractography using DT-MRI data. Magn Reson Med. 2000;44(4):625–32. doi: 10.1002/1522-2594(200010)44:4<625::aid-mrm17>3.0.co;2-o. [DOI] [PubMed] [Google Scholar]
- 60.Noseworthy MD, Davis AD, Elzibak AH. Advanced MR imaging techniques for skeletal muscle evaluation. Semin Musculoskelet Radiol. 2010;14(2):257–68. doi: 10.1055/s-0030-1253166. [DOI] [PubMed] [Google Scholar]
- 61.Sinha U, Yao L. In vivo diffusion tensor imaging of human calf muscle. J Magn Reson Imaging. 2002;15(1):87–95. doi: 10.1002/jmri.10035. [DOI] [PubMed] [Google Scholar]
- 62.Toussaint N, Sermesant M, Stoeck CT, et al. In vivo human 3D cardiac fibre architecture: reconstruction using curvilinear interpolation of diffusion tensor images. Med Image Comput Comput Assist Interv. 2010;13(Pt 1):418–25. doi: 10.1007/978-3-642-15705-9_51. [DOI] [PubMed] [Google Scholar]
- 63.Gullberg GT, Defrise M, Panin VY, et al. Efficient cardiac diffusion tensor MRI by three-dimensional reconstruction of solenoidal tensor fields. Magn Reson Imaging. 2001;19(2):233–56. doi: 10.1016/s0730-725x(01)00232-6. [DOI] [PubMed] [Google Scholar]
- 64.Zhang J, Zhang G, Morrison B, et al. Magnetic resonance imaging of mouse skeletal muscle to measure denervation atrophy. Exp Neurol. 2008;212(2):448–57. doi: 10.1016/j.expneurol.2008.04.033. [DOI] [PMC free article] [PubMed] [Google Scholar]
- 65.Serai SD, Towbin AJ, Podberesky DJ. Pediatric liver MR elastography. Dig Dis Sci. 2012;57(10):2713–9. doi: 10.1007/s10620-012-2196-2. [DOI] [PubMed] [Google Scholar]
- 66.Tse ZT, Janssen H, Hamed A, et al. Magnetic resonance elastography hardware design: a survey. Proc Inst Mech Eng H. 2009;223(4):497–514. doi: 10.1243/09544119JEIM529. [DOI] [PubMed] [Google Scholar]
- 67.Muthupillai R, Lomas DJ, Rossman PJ, et al. Magnetic resonance elastography by direct visualization of propagating acoustic strain waves. Science. 1995;269(5232):1854–7. doi: 10.1126/science.7569924. [DOI] [PubMed] [Google Scholar]
- 68.Manduca A, Oliphant TE, Dresner MA, et al. Magnetic resonance elastography: non-invasive mapping of tissue elasticity. Med Image Anal. 2001;5(4):237–54. doi: 10.1016/s1361-8415(00)00039-6. [DOI] [PubMed] [Google Scholar]
- 69.Dresner MA, Rose GH, Rossman PJ, et al. Magnetic resonance elastography of skeletal muscle. J Magn Reson Imaging. 2001;13(2):269–76. doi: 10.1002/1522-2586(200102)13:2<269::aid-jmri1039>3.0.co;2-1. [DOI] [PubMed] [Google Scholar]
- 70.Mason P. Dynamic stiffness and crossbridge action in muscle. Biophys Struct Mech. 1977;4(1):15–25. doi: 10.1007/BF00538837. [DOI] [PubMed] [Google Scholar]
- 71.Chen Q, Basford J, An KN. Ability of magnetic resonance elastography to assess taut bands. Clin Biomech. 2008;23(5):623–9. doi: 10.1016/j.clinbiomech.2007.12.002. [DOI] [PMC free article] [PubMed] [Google Scholar]
- 72.Brauck K, Galban CJ, Maderwald S, et al. Changes in calf muscle elasticity in hypogonadal males before and after testosterone substitution as monitored by magnetic resonance elastography. Eur J Endocrinol. 2007;156(6):673–8. doi: 10.1530/EJE-06-0694. [DOI] [PubMed] [Google Scholar]
- 73.Debernard L, Robert L, Charleux F, et al. Analysis of thigh muscle stiffness from childhood to adulthood using magnetic resonance elastography (MRE) technique. Clin Biomech. 2011;26(8):836–40. doi: 10.1016/j.clinbiomech.2011.04.004. [DOI] [PubMed] [Google Scholar]
- 74.Debernard L, Robert L, Charleux F, et al. Characterization of muscle architecture in children and adults using magnetic resonance elastography and ultrasound techniques. J Biomech. 2011;44(3):397–401. doi: 10.1016/j.jbiomech.2010.10.025. [DOI] [PubMed] [Google Scholar]
- 75.Domire ZJ, McCullough MB, Chen Q, et al. Wave attenuation as a measure of muscle quality as measured by magnetic resonance elastography: initial results. J Biomech. 2009;42(4):537–40. doi: 10.1016/j.jbiomech.2008.11.034. [DOI] [PMC free article] [PubMed] [Google Scholar]
- 76.Papazoglou S, Hamhaber U, Braun J, et al. Horizontal shear wave scattering from a nonwelded interface observed by magnetic resonance elastography. Phys Med Biol. 2007;52(3):675–84. doi: 10.1088/0031-9155/52/3/010. [DOI] [PubMed] [Google Scholar]
- 77.Mariappan YK, Glaser KJ, Manduca A, et al. Cyclic motion encoding for enhanced MR visualization of slip interfaces. J Magn Reson Imaging. 2009;30(4):855–63. doi: 10.1002/jmri.21914. [DOI] [PMC free article] [PubMed] [Google Scholar]
- 78.Mariappan YK, Glaser KJ, Manduca A, et al. Vibration imaging for functional analysis of flexor muscle compartments. J Magn Reson Imaging. 2009;31:1395–401. doi: 10.1002/jmri.22183. [DOI] [PMC free article] [PubMed] [Google Scholar]
- 79.Song J, Kwon OI, Seo JK. Anisotropic elastic moduli reconstruction in transversely isotropic model using MRE. Inverse Probl. 2012;28(11):115003. [Google Scholar]
- 80.Boesch C. Musculoskeletal spectroscopy. J Magn Reson Imaging. 2007;25(2):321–38. doi: 10.1002/jmri.20806. [DOI] [PubMed] [Google Scholar]
- 81.Boesch C, Machann J, Vermathen P, et al. Role of proton MR for the study of muscle lipid metabolism. NMR Biomed. 2006;19(7):968–88. doi: 10.1002/nbm.1096. [DOI] [PubMed] [Google Scholar]
- 82.Keeler J. Understanding NMR spectroscopy. John Wiley & Sons; Chichester (West Sussex): 2005. [Google Scholar]
- 83.Provencher SW. Estimation of metabolite concentrations from localized in vivo proton NMR spectra. Magn Reson Med. 1993;30(6):672–9. doi: 10.1002/mrm.1910300604. [DOI] [PubMed] [Google Scholar]
- 84.Naressi A, Couturier C, Devos JM, et al. Javabased graphical user interface for the MRUI quantitation package. MAGMA. 2001;12(2–3):141–52. doi: 10.1007/BF02668096. [DOI] [PubMed] [Google Scholar]
- 85.Boesch C, Slotboom J, Hoppeler H, et al. In vivo determination of intra-myocellular lipids in human muscle by means of localized 1H-MR-spectroscopy. Magn Reson Med. 1997;37(4):484–93. doi: 10.1002/mrm.1910370403. [DOI] [PubMed] [Google Scholar]
- 86.Kreis R, Koster M, Kamber M, et al. Peak assignment in localized 1H MR spectra of human muscle based on oral creatine supplementation. Magn Reson Med. 1997;37(2):159–63. doi: 10.1002/mrm.1910370202. [DOI] [PubMed] [Google Scholar]
- 87.Bongers H, Schick F, Skalej M, et al. Localized in vivo 1H spectroscopy of human skeletal muscle: normal and pathologic findings. Magn Reson Imaging. 1992;10(6):957–64. doi: 10.1016/0730-725x(92)90450-e. [DOI] [PubMed] [Google Scholar]
- 88.de Graaf RA. In vivo NMR spectroscopy: principles and techniques. 2nd edition John Wiley & Sons; Chichester (West Sussex): 2007. [Google Scholar]
- 89.Prompers JJ, Jeneson JA, Drost MR, et al. Dynamic MRS and MRI of skeletal muscle function and biomechanics. NMR Biomed. 2006;19(7):927–53. doi: 10.1002/nbm.1095. [DOI] [PubMed] [Google Scholar]
- 90.Lodi R, Muntoni F, Taylor J, et al. Correlative MR imaging and 31P-MR spectroscopy study in sarcoglycan deficient limb girdle muscular dystrophy. Neuromuscul Disord. 1997;7(8):505–11. doi: 10.1016/s0960-8966(97)00108-9. [DOI] [PubMed] [Google Scholar]
- 91.Vorgerd M, Schols L, Hardt C, et al. Mitochondrial impairment of human muscle in Friedreich ataxia in vivo. Neuromuscul Disord. 2000;10(6):430–5. doi: 10.1016/s0960-8966(00)00108-5. [DOI] [PubMed] [Google Scholar]
- 92.Park JH, Niermann KJ, Ryder NM, et al. Muscle abnormalities in juvenile dermatomyositis patients: P-31 magnetic resonance spectroscopy studies. Arthritis Rheum. 2000;43(10):2359–67. doi: 10.1002/1529-0131(200010)43:10<2359::AID-ANR25>3.0.CO;2-D. [DOI] [PubMed] [Google Scholar]
- 93.Newman RJ, Bore PJ, Chan L, et al. Nuclear magnetic resonance studies of forearm muscle in Duchenne dystrophy. Br Med J (Clin Res Ed) 1982;284(6322):1072–4. doi: 10.1136/bmj.284.6322.1072. [DOI] [PMC free article] [PubMed] [Google Scholar]
- 94.Younkin DP, Berman P, Sladky J, et al. 31P NMR studies in Duchenne muscular dystrophy: agerelated metabolic changes. Neurology. 1987;37(1):165–9. doi: 10.1212/wnl.37.1.165. [DOI] [PubMed] [Google Scholar]
- 95.Kemp GJ, Taylor DJ, Dunn JF, et al. Cellular energetics of dystrophic muscle. J Neurol Sci. 1993;116(2):201–6. doi: 10.1016/0022-510x(93)90326-t. [DOI] [PubMed] [Google Scholar]
- 96.Barbiroli B, Funicello R, Iotti S, et al. 31P-NMR spectroscopy of skeletal muscle in Becker dystrophy and DMD/BMD carriers. Altered rate of phosphate transport. J Neurol Sci. 1992;109(2):188–95. doi: 10.1016/0022-510x(92)90167-j. [DOI] [PubMed] [Google Scholar]
- 97.Torriani M, Townsend E, Thomas BJ, et al. Lower leg muscle involvement in Duchenne muscular dystrophy: an MR imaging and spectroscopy study. Skeletal Radiol. 2012;41(4):437–45. doi: 10.1007/s00256-011-1240-1. [DOI] [PMC free article] [PubMed] [Google Scholar]


