Abstract
Boron neutron capture therapy (BNCT) can be utilized to selectively kill cancer cells using a boron compound that accumulates only in cancer cells and not in normal cells. Tumor-bearing animals treated by BNCT are routinely used to evaluate long-term antitumor effects of new boron compounds. Alpha-autoradiography is one of the methods employed in the evaluation of antitumor effects. However, a standard alpha-autoradiography cannot detect the microdistribution of 10B because of the difficulty associated with the superposition of a tissue sample image and etched pits on a track detector with the etching process. In order to observe the microdistribution of 10B, some special methods of alpha-autoradiography have been developed that make use of a special track detector, or the atomic force microscope combined with X-ray and UV light irradiation. In contrast, we propose, herein, a simple and rapid method of precisely identifying the position of 10B using the imaging process and the shape of etched pits, such as their circularity, without the need to use special track detectors or a microscope. A brief description of this method and its verification test are presented in this article. We have established a method of detecting the microdistribution of 10B with submicron deviation between the position of etched pits and the position of reaction in a tissue sample, for a given circularity of etched pits.
Keywords: boron neutron capture therapy, boron compound, alpha-autoradiography, microdistribution
INTRODUCTION
Boron neutron capture therapy (BNCT) is a radiation therapy that makes use of the 10B(n, α)7Li reaction to selectively kill tumor cells. The ranges of lithium nuclei and alpha particles that are emitted following the 10B(n, α)7Li reaction are 5 µm and 8 µm, respectively, corresponding to the diameter of a representative tumor cell [1, 2]. Thus, if a boron compound accumulates in the tumor, the tumor can be selectively destroyed by the above-mentioned reaction. However, due to the extremely short particle ranges, it is necessary for the 10B to be located in the proximity of the cell nucleus, in order to enhance the cell-killing effect. Even for high concentrations of 10B in the tissue, no strong cell-killing effect is expected if 10B is not localized in the cells.
Although Borono-PhenylAlanine (BPA) [3] and sodium borocaptate (BSH) [4] boron compounds are presently used in clinical studies, each of these compounds has its own shortcomings. BSH is a very hydrophilic chemical and only weakly permeates the cellular membrane. Most BSH molecules exist in the extracellular space, and their cell-killing efficiency in combination with neutron irradiation is relatively small. In contrast, BPA is actively accumulated, especially in rapidly proliferating cells. Therefore, the microdistribution of this compound in tumor tissue is heterogeneous, and this characteristic of BPA acts to reduce the final tumor control effects. For the reasons described above, there is a need to develop new compounds that have large effects and are able to selectively accumulate in tumor cells.
In order to evaluate the final antitumor effect and its selectivity between tumor and normal tissues, it is necessary to perform long-term monitoring, extending over several months, of tumor-bearing animals treated by BNCT using the new compound.
It may be possible to estimate the antitumor effect and normal tissue response based on the microdistribution and concentration of 10B compound in tissues, because the effect of each particle is limited to the reaction site. To confirm this possibility, many samples should be treated for screening of the potency of the boron compound. Thus, it is desirable that a rapid and simple method for estimating the boron compound effect be established, and that preparation of the sample section is also quick and straightforward.
The effect of the boron compound is dependent on the microdistribution of 10B in the cell nucleus. Therefore, it is important to identify the labeled cell nucleus and the position of the 10B atom at the submicron scale.
Much effort has been devoted to visualizing the 10B microdistribution, one of the methods employed being an alpha-autoradiography technique [5–8]. However, the range of BNCT particles is too great to allow precise localization of 10B atoms in cells and tissues. An alpha particle with the range of 8 μm in cell is isotropically emitted by the 10B(n,α)7 Li reaction. The maximum deviation from the reaction point to detection point is around 8 µm using the general alpha autoradiography method, which is too large to identity the 10B distribution in cell. Several proposals have been made on how to resolve this defect. Amemiya et al. irradiated the cells on the CR-39 solid state track detector with soft X-rays, and used atomic force microscopy (AFM) to observe the cell images and an extremely tiny pit of the alpha particle track made by soft X-rays and by the 10B(n, α)7Li reaction, respectively [9]. The role of soft X-rays is to distinguish changes in the bulk etch rate and in the sensitivity of CR-39. A high-resolution atomic force microscope was required to observe the very faint cell image induced by soft X-rays that could not be resolved by an optical microscope.
Amemiya et al. and Konishi et al. also published special techniques using UV light to record cellular images directly on to the surface of CR-39. Amemiya et al. established a superior method for high-resolution neutron-induced alpha autoradiography using CR-39 and an AFM [10]. This technique can also detect the 3D image of an etched pit in order to measure the incident angle of the charged particle. However, in order to prepare the section with a thickness of 1 µm, the tissue is fixed by glutaraldehyde and osmium tetroxide, dehydrated and then embedded in epoxy resin. Many processes and much time are needed for the preparation of the sample. Furthermore, there is a significant amount of activation of samples by the irradiation of thermal neutrons while the irradiated samples are being taken from the thermal neutron irradiation facility to the AFM facility. It is difficult to rapidly and simply treat many samples of tissue containing 10B atoms using this technique, because of the need for complicated preparation of the tissue section and special devices such as an AFM. However, if very precise information on the distribution of 10B in tissue is needed, this technique should be applied.
Konishi et al. extended the method developed by Amemiya et al. for estimation of the incident position of the charged particle [11]. Furthermore, Konishi et al. also showed the superimposed image of etched pits and cellular images directly onto the surface of CR-39 exposed by the UV light using the conventional optical microscope. However, they mentioned that the contours of the cell nuclei were difficult to identify because of the similar UV absorption of the nuclei and the cytoplasm. Furthermore, they mentioned that there are hardly visible etched pits on the cell relieves because of uneven enhancement of the etching velocity due to UV exposure during the cell image-transferring procedure.
In another study, Solares et al. developed a unit of silica glass/tissue sample/Ixan/Lexan, and implemented a technique that does not create a relative gap between the tissue and the pit on the track detector generated by the 10B(n, α)7Li reaction. In that study, a general microscope was suitable as an observation instrument [12]. However, a technique for preparation of a special track detector was needed before the examination could be performed.
It is desirable that a clear image of the cellular nucleus and etched pits is obtained for evaluation of the effect of the boron compound used in BNCT at the submicron scale. It is also necessary to obtain a superimposed image of the fluorescently stained cell nucleus image and the etched pits. The purpose of this manuscript is the development of the alpha-autoradiography with position resolution at submicron level.
In the present work, we report on an improved method that allows simple and precise estimation of 10B microdistribution using commercially available tools, such as a CR-39 solid-state track detector, an optical microscope, or a fluorescence microscope. The CR-39 is widely used as a neutron solid-state track detector for a personal dosimeter. In order to improve the position resolution of 10B distribution, we devised a novel method using the circularity of the shape of the etched pits, and we performed a verification test as proof of principle for our improved method. Moreover, in order to acquire an image without a relative gap in the etched pit on a CR-39 and tissue image, we propose an improved superposition method that uses the mark on a CR-39 as a standard that is not eliminated by the etching process. As a reliability test for this technique, we present an image of the intracellular microdistribution of 10B using a tissue sample from the brain of a mouse injected with 500 mg/kg of BPA.
MATERIALS AND METHODS
High-resolution analysis of etched pits using their circularity
CR-39 plastic track detectors of BARYOTRAK (Nagase Landauer, Ltd, Japan) were used. In alpha-autoradiography, a several micron thick tissue sample containing the 10B atoms is installed on a CR-39, and damaged polymer chains are formed in the CR-39 by alpha particles and lithium nuclei that are emitted following the 10B(n, α)7Li reaction triggered by thermal neutron irradiation. Etched pits corresponding to the position of the incident charged particles are formed by using chemical etching of the CR-39 to microscopically expose the damage tracks.
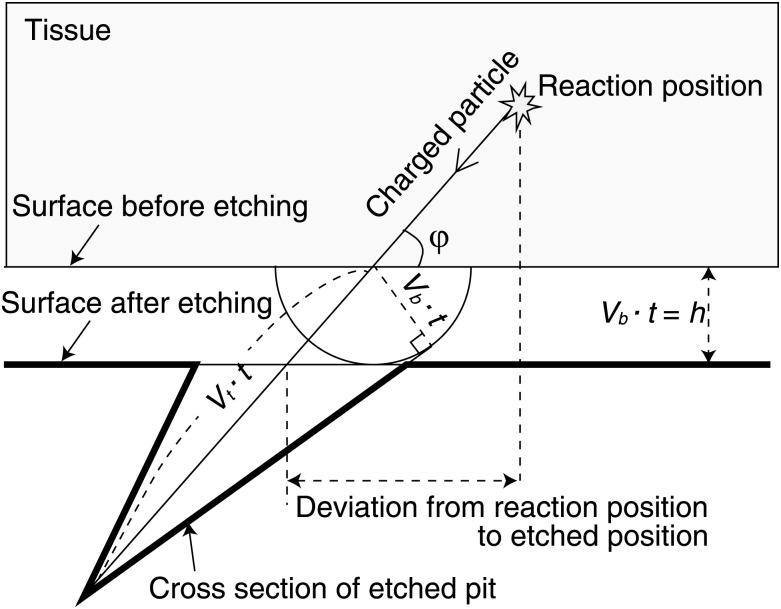
Figure 1 schematically shows the layout that describes etched pit quantities of track formation at a constant etched rate. The direction at which the charged particle enters can be determined by observing the shape of an etched pit. Because the tissue sample has a non-negligible thickness, the emission point of the particles that enter aslant differs from the position of the etched pit on the CR-39. Moreover, the shape of the etched pit becomes ellipse-like. On the other hand, if the charged particle enters the CR-39 perpendicularly, the etched pit will be a true circle and the deviation will be zero (Fig. 1).
Fig. 1.
Schematic presentation to describe the etched pit quantities of track formation at a constant etch rate.
Therefore, an etched pit with needs to have the shape of a true circle on the CR-39 in order to correctly identify the location of the 10B(n, α)7Li reaction. However, the absolute number of pits will be lower if only true circle pits are counted. Instead, a small deviation should be permitted in the actual analysis. The circularity of the etched pits is derived from a digitized image giving the area and the boundary length of each etched pit. Circularity is defined by the following formula:
 |
(1) |
In Equation (1), S and L are the area and the boundary length of an etched pit, respectively. A true circle is assumed when circularity approaches the value of 1.
To estimate the relationship between the circularity and the minor-to-major axis ratio, the area S and the boundary length L are given by the following equations:
 |
(2) |
In the above equations, E(k) is an elliptic integral of the second kind. The quantities a and b are the major axis and the minor axis, respectively. The circularity C is then given by:
 |
(3) |
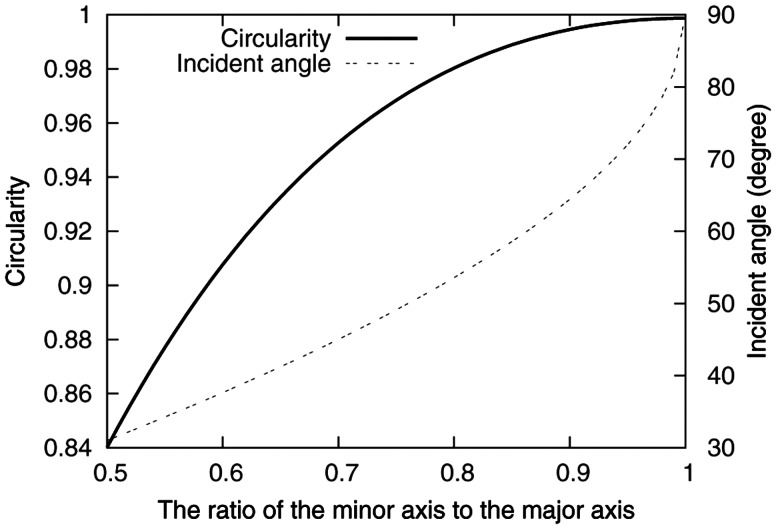
Figure 2 shows the relationship between the circularity and the minor-to-major axis ratio of an etched pit.
Fig. 2.
The relationship between the circularity and the minor-to-major axis ratio of an etched pit.
On the other hand, the major and the minor axis of an etched pit are given by the following equations [13]:
 |
(4) |
where h, V, and φ are the surface removal, the track to bulk etch rate ratio (Vt/Vb), and the angle at which the particles are incident on the surface of CR-39. To estimate the deviation from the reaction point to the etched position, the relationship between φ and the minor-to-major axis ratio is given, using Equation (4), by the following equation:
 |
(5) |
Figure 2 also shows the relationship between the angle φ and the minor-to-major axis ratio. In [14], the value of V and h were 7 and 1.2 µm, respectively, for alpha particles incident under the etching conditions of 6N NaOH at a temperature of 70°C for 1 h.
The minor-to-major axis ratio is estimated to be 0.95 for an etched pit with a circularity of 0.995. If the selected value of circularity ranges between 0.995 and 1, the maximal deviation of the etched pit position on CR-39 from the location of 10B(n, α)7Li reaction in the tissue sample is within 1.7 µm.
In order to confirm that the value of the circularity of the etched pit induced by the perpendicularly incident charged particle approaches 1, we irradiated the samples with thermal neutrons for 1 and 5 min. The irradiated samples had a predefined concentration of BPA mounted on quartz glass, and a 1–3 µm thick thin mylar foil (provided by Goodfellow Cambridge Ltd, Japan) was sandwiched between the samples and the CR-39. Furthermore, a sample without mylar foil was also prepared. In all, four types of samples were prepared. The irradiation was performed using the pneumatic tube of the thermal column at the Kyoto University Research Reactor Institute (KUR) [15]. KUR is a light-water moderated tank-type reactor operated at a thermal power of 1 MW or 5 MW. Thermal neutron flux is 8 × 10¹⁰ (n/cm2s) while operating at 1 MW.
Following irradiation, the tracks on CR-39 were chemically etched using 6N NaOH at a temperature of 70°C for 1 h. The etched CR-39 was examined using an optical microscope, and images of the etched pits were acquired. The acquired images of the etched pits were digitized, and for every etched pit the circularity was derived from the area and boundary length.
Method of superposition of the cell image and the etched pits
In alpha-autoradiography, the chemical etching process does not allow a tissue sample to remain in the image of an etched pit. Therefore, reference points are necessary in order to superimpose a tissue sample and etched pit images. The reference points must be observable both on the tissue sample and on the etched pit images; thus, we devised a method of making a scratch of two cross-lines on the CR-39, each line being several microns wide. Making cross-lines was necessary in order to determine the position in two dimensions.
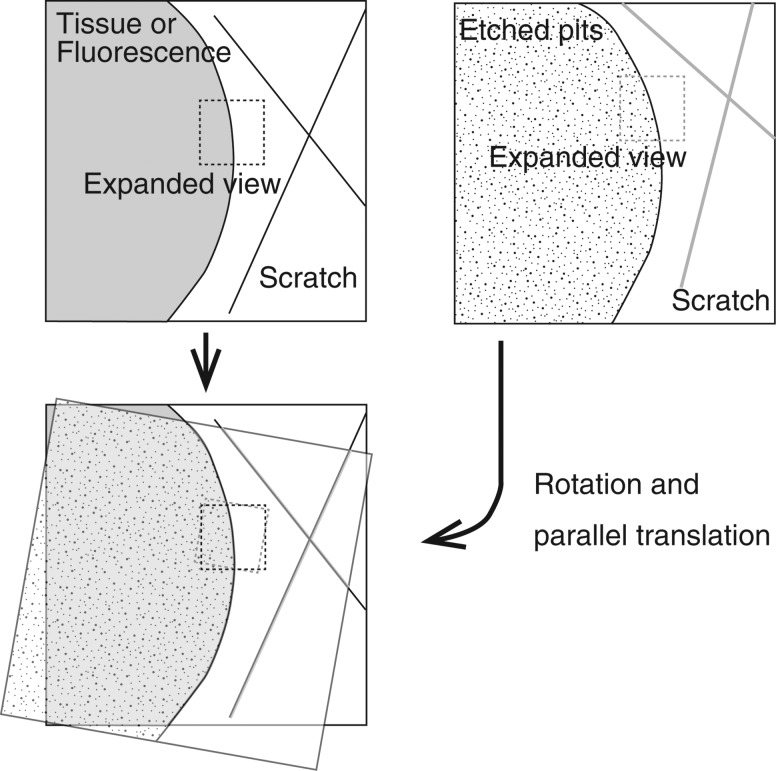
Figure 3 shows the schematic layout of the superposition technique. The tissue sample is first stained with a Hoechst in order to obtain an image of the cell nucleus; images of the tissue sample with scratched cross-like reference points are acquired in both the bright and fluorescence fields at low and high magnifications. Low magnification is × 40–200, selected according to the scratched position, and high magnification is × 200–400. The resolution for magnification of × 200 corresponds to 0.5 µm/pixel. The image was obtained using the commercially available optical microscope, BZ-9000 (Keyence, Japan). This microscope can join the high magnification images into one image of a wide range by scanning the microstage.
Fig. 3.
Schematic of the layout for the method of superposition of the fluorescence and/or the bright-field image of the tissue with the CR-39 etched-pit image.
The high-to-low magnification image relation of the area of interest is then recorded based on the two images. After carrying out the chemical etching, the process of monitoring and recording images of the etched pits is repeated. In the next step, images of a tissue sample and of an etched pit are superimposed by parallel translation and rotation, so that the center of the after- and before- etching line are in agreement with both low magnification images. The amount of parallel translation and the angle in this superposition are recorded. The center of the after-etching line will be the superimposed on the before-etching line because the scratch is uniformly etched. Furthermore, the image of the cross-like scratch can be matched to within microns because the pixel size is 0.5 µm. However, if a higher resolution image were to be obtained, we should apply the superposition method developed by Amemiya et al. and Konishi et al. using UV light to record cellular images directly on to the surface of the CR-39.
In order to superimpose the images at high magnification, first, two low-magnification images of the bright and fluorescence fields and etched pits are matched in the area of interest. Then, two high-magnification images are also matched, using the amount of parallel translation and the angle of rotation that were recorded above.
To confirm the validity of the superposition technique, a sample tissue image was acquired from a frozen 4-μm thick section from the brain of a mouse that had been injected with 500 mg/kg of BPA. The tissue sample was frozen with liquid nitrogen, and the frozen section was made by microtome. The frozen section thickness 4 µm was mounted on the CR-39. C3H/He male mice of 10 weeks old were used for experiments. The portion of brain used was the left brain. The frozen section was installed on the CR-39 with scratched reference points, and neutron irradiation was performed for 5 min using the thermal column of the KUR.
After irradiation, fluorescence staining of the nucleus was carried out using Hoechst, and both low and high magnification images were acquired. Chemical etching and image observation was carried out following the same process as the one that was described above.
RESULTS
Image processing of the etched pit using circularity
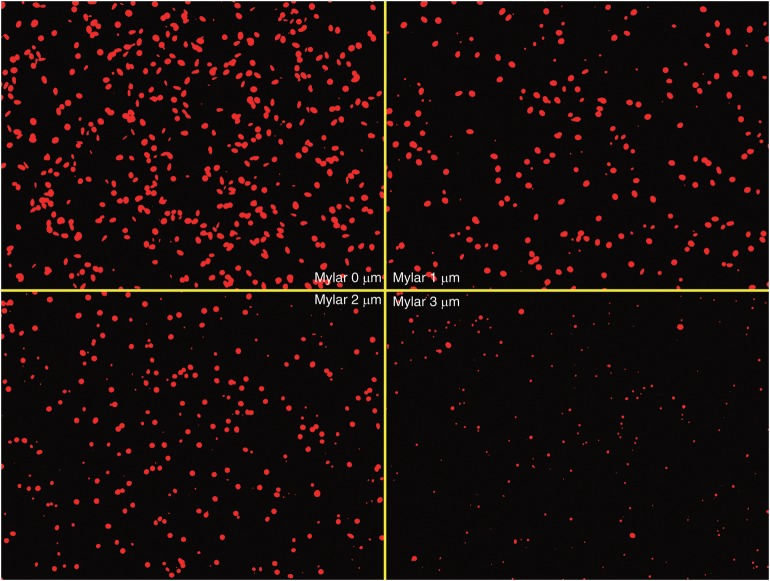
The images of etched pits are shown in Fig. 4 for different mylar thicknesses, ranging from 0 to 3 µm in steps of 1 µm. To prevent the overlap of etched pits, the irradiation time with thermal neutrons was set to 1 or 5 min, corresponding to fluencies of 4.8 × 10¹² and 2.4 × 10¹³ (cm−2) for mylar thicknesses of 0, 1, 2 and 3 µm, respectively, under a 10B concentration of 2.5 ppm.
Fig. 4.
Images (×400) of etched pits on the CR-39 obtained for mylar thickness values ranging from 0 to 3 µm.
Because an incident particle that enters aslant is stopped within the mylar, it was found that the relative frequency of incident particles that enter perpendicularly increases with increasing mylar thickness.
Moreover, because the energy deposit of the lithium nuclei and alpha rays emitted by the 10B(n, α)7Li reaction decreased with increasing thickness of the mylar, it was observed that the size of the etched pit became smaller.
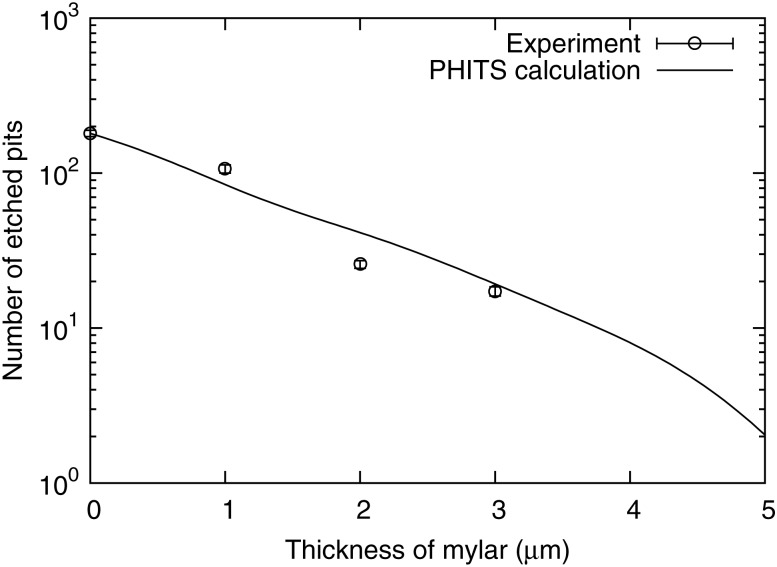
Figure 5 presents the relationship between the thickness of the mylar and the number of etched pits that were induced in the visual field of 1.1 × 104 μm2 in 1 min of neutron irradiation, corresponding to 4.8 × 10⁴ n/ μm2, at 1 ppm of 10B. The number of measured etched pits in the area of 1.1 × 104 μm2 without the mylar was 180 pits/ppm/min, corresponding to a detection efficiency of 3.4 × 10⁻⁷ pits/ppm/neutron.
Fig. 5.
Relationship between mylar thickness and the number of etched pits per 1 ppm, for a 1 min long irradiation. The solid line shows the results of calculations obtained using the PHITS code. The maximum error for the experimental data was 6.8%.
Further, we performed simulations of the experimental layout using the heavy particle transportation code of PHITS [16]. The results of these simulations using PHITS were in good agreement with the experimental results. According to the simulation results, the ratios of alpha particle events to total events were 78, 90 and 99% for mylar thicknesses of 1, 2 and 3 µm, respectively, because the range of alpha particles was larger than that of 7Li nuclei.
Image processing was carried out to quantify the characteristics of the etched pits. The relationship between the average area (or the circularity of an etched pit) and the mylar thickness is shown in Fig. 6. It was found that the area of a pit becomes small and the average circularity approaches 1 with increasing mylar thickness. It was also found that, for perpendicularly incident particles, the relative number of etched pits increases with increasing mylar thickness.
Fig. 6.
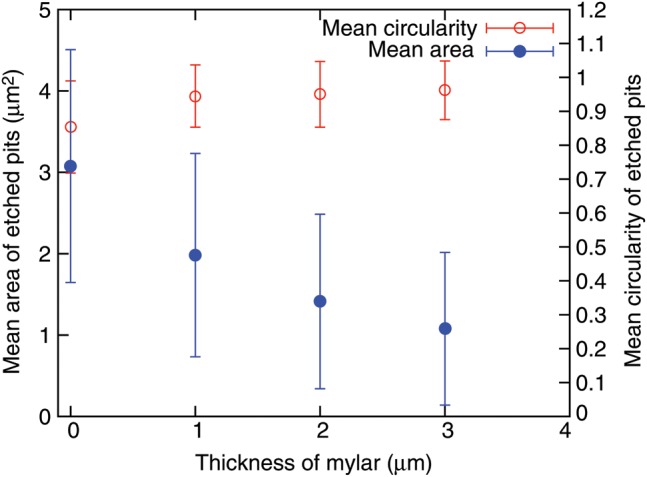
Relationship between the average area or the circularity of an etched pit and mylar thickness. The error for the area is large because the area size is dependent on the incident energy and the angle of incidence of the charged particles.
Superposition of a tissue sample and an etched-pit image
Figure 7 shows a bright-field and a fluorochromic image for a tissue sample, as well as a low-magnification etched-pit image. No misalignment exists between the bright and a fluorescence images, because the bright and a fluorescence images were obtained by only changing the lens of the microscope. Next, an area of interest was selected in the low-magnification image that was also recorded in the high magnification image.
Fig. 7.
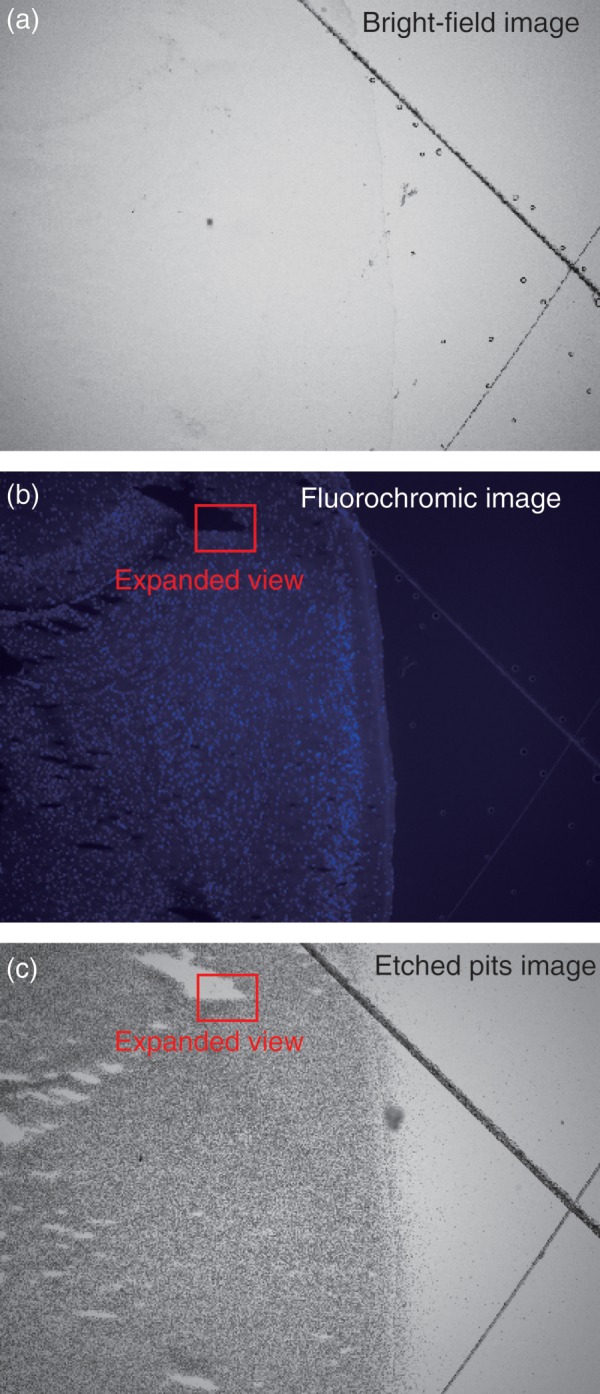
(a) An optical bright-field microscope image of a tissue sample, (b) a fluorescence image of the same tissue sample, and (c) a low magnification image (×100) of the etched CR-39 showing a multitude of pits.
Only etched pits with circularity ranging between 0.995 and 1 were selected to obtain the ‘perpendicularly incident’ particles. Moreover, in order to superimpose an image of an etched pit on a fluorescence image, the image was moved based on the information on the amount of parallel translation and the angle of rotation. The superimposed image is shown in Fig. 8. Red dots show the etched pits chosen, i.e. circularity from 0.995 to 1. The locations of the red dots correspond to the locations of 10B(n, α)7Li reactions.
Fig. 8.
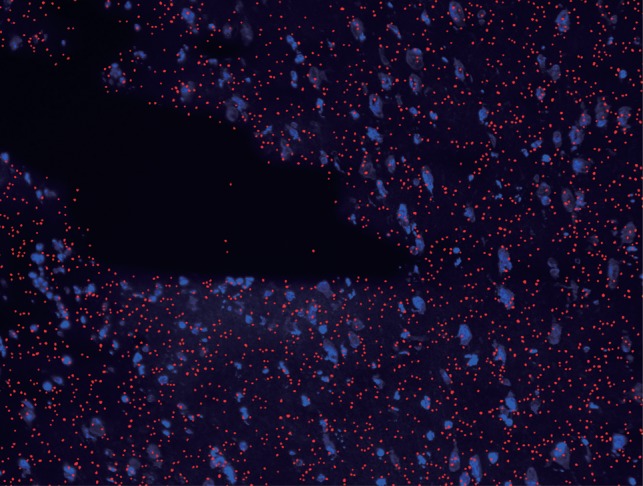
Zoomed-in section of images in Fig. 7 (b–c), superimposed to show the pit position (red) and the mouse brain showing the left hemisphere cell nuclei injected with 500 mg/kg of BPA (blue). BPA is an amino-acid analog and localized in the cell because of the enhancement of transport of an amino acid.
Because cell nuclei were clearly identified in the fluorescence image, the relationship of the sites of 10B to cell nuclei, i.e. the microdistribution of 10B in cells or tissue, was precisely determined by the superimposed fluorescence and etched pit images of high magnification. Our new method is expected to become useful for predicting the BNCT effects of new 10B compounds.
DISCUSSION
In this research, we developed a new method that allows simple and precise determination of the intracellular microdistribution of 10B using commercially available devices such as a CR-39 solid state track detector, a commercially available optical microscope, or a fluorescence microscope. Aiming at improving the position resolution of 10B microdistribution, the principle of this technique was confirmed using information on the circularity of etched pits, and a proof-of-principle test was performed. In this article, the range of circularity was selected to be from 0.995 to 1, corresponding to a maximal deviation of 1.7 µm, allowing us to obtain a sufficient number of events. If the CR-39 can detect lithium nuclei, whose range is shorter than that of alpha particles, the maximal deviation will be < 1 µm. Because alpha particles and lithium nuclei are emitted in opposite directions, half of the events in the 10B(n, α)7Li reaction are caused by the incidence of lithium nuclei. Furthermore, the deviation becomes smaller if the reaction occurs in the proximity of the CR-39.
Using the proposed method, we observed superposition pictures of 10B microdistribution not obtainable by normal alpha-autoradiography. For example, the superposition picture of a brain surface is shown in Fig. 9. Many etched pits were observed at places where cells were not present. This can be explained as follows. When a frozen section is created, blood that adheres to the brain surface may penetrate into the crevice of brain surfaces. When blood is observed outside the tissue, its etched-pit images may serve as a standard for an estimation of the 10B concentration within the tissue or cells if the 10B concentration in the blood is known [17, 18]. It is important to consider the saturation point of etched pits for our technique. Gaillard et al. described the occurrence of saturation as a function of incident particle fluence and etched pit size. They showed that the fluence of 1 × 10⁸ (pits/cm2) can be counted without saturation for a pit diameter of ∼ 1 µm. According to our results, described in Image processing of the etched pit using circularity, the number of measured etched pits in an area of 1.1 × 10⁴ (μm2 ) was 180 (pits/ppm/min), corresponding to 1.6 × 10⁶ (pits/ppm/min/cm2). If the irradiation time is 1 min, for a boron concentration of up to 61 ppm the sample is not saturated.
Fig. 9.
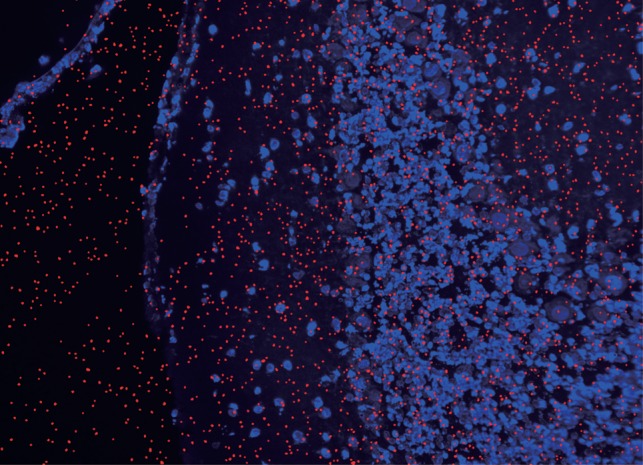
Superimposed images (×200) of a mouse brain injected with 500 mg/kg of BPA and etched CR-39, showing pits outside of cells.
A performance test was also performed, and a superposition image was successfully obtained without a significant gap. However, to obtain higher resolution images with submicron deviation, the frozen section of tissue sample should be thinner with selected pit circularity approaching 1 and a shorter etching time to reduce the surface removal.
In future work, our newly developed method will be applied in evaluation tests for new borated compounds of BNCT.
FUNDING
This work was supported by the Japan Society for the Promotion of Science KAKENHI Grant-in-Aid for Scientific Research (A: 22240091).
REFERENCES
- 1.Barth RF, Coderre JA, Vicente MG, et al. Boron neutron capture therapy of cancer: current status and future prospects. Clin Cancer Res. 2005;11:3987–4002. doi: 10.1158/1078-0432.CCR-05-0035. [DOI] [PubMed] [Google Scholar]
- 2.Coderre JA, Turcotte JC, Riley KJ. Boron neutron capture therapy: cellular targeting of high linear energy transfer radiation. Technol Cancer Res Treat. 2003;2:355–75. doi: 10.1177/153303460300200502. [DOI] [PubMed] [Google Scholar]
- 3.Mishima Y, Honda C, Ichihashi M, et al. Treatment of malignant melanoma by single thermal neutron capture therapy with melanoma-seeking 10B-compound. Lancet. 1989;2:388–9. doi: 10.1016/s0140-6736(89)90567-9. [DOI] [PubMed] [Google Scholar]
- 4.Haselsberger K, Radner H, Pendl G. Boron neutron capture therapy: boron biodistribution and pharmacokinetics of Na2B12H11SH in patients with glioblastoma. Cancer Res. 1994;54:6318–20. [PubMed] [Google Scholar]
- 5.Altieri S, Bortolussi S, Bruschi P, et al. Neutron autoradiography imaging of selective boron uptake in human metastatic tumours. Appl Radiat Isot. 2008;66:1850–5. doi: 10.1016/j.apradiso.2008.05.007. [DOI] [PubMed] [Google Scholar]
- 6.Andrea W, Jean M, Raymond M, et al. Boron analysis and boron imaging in biological materials for Boron Neutron Capture Therapy (BNCT) Crit Rev Oncol Hematol. 2008;68:66–90. doi: 10.1016/j.critrevonc.2008.03.004. [DOI] [PubMed] [Google Scholar]
- 7.Ogura K, Yamazaki A, Yanagie H, et al. Neutron capture autoradiography for a study on boron neutron capture therapy. Radiat Meas. 2001;34:555–8. [Google Scholar]
- 8.Ceberg CP, Salford LG, Brun A. Neutron capture imaging of 10B in tissue specimens Radiother Oncol. 1993;26:139–46. doi: 10.1016/0167-8140(93)90095-p. [DOI] [PubMed] [Google Scholar]
- 9.Amemiya K, Takahashi H, Nakazawa M, et al. Soft X-ray imaging using CR-39 plastics with AFM readout. Nucl Instrum Meth Phys Res B. 2002;187:361–6. [Google Scholar]
- 10.Amemiya K, Takahashi H, Kajimoto Y, et al. High-resolution nuclear track mapping in detailed cellular histology using CR-39 with the contact microscopy technique. Radiat Meas. 2005;40:283–8. [Google Scholar]
- 11.Konishi T, Amemiya K, Natsume T, et al. A new method for the simultaneous detection of mammalian cells and ion tracks on a surface of CR-39. J Radiat Res. 2007;48:255–61. doi: 10.1269/jrr.06078. [DOI] [PubMed] [Google Scholar]
- 12.Solares GR, Zamenhof RG. A novel approach to the microdosimetry of neutron capture therapy. Part I. High-resolution quantitative autoradiography applied to microdosimetry in neutron capture therapy. Radiat Res. 1995;144:50–8. [PubMed] [Google Scholar]
- 13.Somogyi G. Development of etched nuclear tracks. Nuclear Instrum Meth Phys Res. 1980;173:21–42. [Google Scholar]
- 14.Green P, Ramli S, Najjar F, et al. A study of bulk-etch rates and track-etch rates in CR39. Nucl Instrum Meth Phys Res. 1982;203:551–9. [Google Scholar]
- 15.Kyoto University Research Reactor Institute. http://www.rri.kyoto-u.ac.jp/en/facilities/kur. (9 August 2013, date last accessed) [Google Scholar]
- 16.Niita K, Sato T, Iwase H, et al. PHITS – a particle and heavy ion transport code system. Radiat Meas. 2006;41:1080–90. [Google Scholar]
- 17.Woollard JE, Blue TE, Curran JF. An alpha autoradiografic technique for determination of 10B concentrations in blood and tissue. Nucl Instrum Meth Phys Res A. 1990;299:600–5. [Google Scholar]
- 18.Gadan MA, Bortolussi S, Postuma I, et al. Set-up and calibration of a method to measure 10B concentration in biological samples by neutron autoradiography. Nucl Instrum Meth Phys Res B. 2012;274:51–6. [Google Scholar]


