Abstract
Weekly serial 4DCT scans were acquired under free breathing conditions to assess water-equivalent path length (WEL) variations due to both intrafractional and interfractional changes in tissue thickness and density and to calculate proton dose distributions resulting from anatomical variations observed in serial 4DCT. A template of region of interests (ROIs) was defined on the anterior–posterior (AP) beam's eye view, and WEL measurements were made over these ROIs to quantify chest wall thickness variations. Interfractional proton dose distributions were calculated to assess changes in the expected dose distributions caused by range variations. Mean intrafractional chest wall WEL changes during respiration varied by: −4.1 mm (<−10.2 mm), −3.6 mm (<−7.1 mm), −3.2 mm (<−5.6 mm) and −2.5 mm (<−5.1 mm) during respiration in the ITV, upper, middle and lower lung regions, respectively. The mean interfractional chest wall WEL variation at Week 6 decreased by −4.0 mm (<−8.6 mm), −9.1 mm (<−17.9 mm), −9.4 mm (<−25.3 mm) and −4.5 mm (<−15.6 mm) in the ITV, upper, middle and lower lung regions, respectively. The variations were decomposed into anterior and posterior chest wall thickness changes. Dose overshoot beyond the target was observed when the initial boli was applied throughout the treatment course. This overshoot is due to chest wall thickness variations and target positional variations. The radiological path length can vary significantly during respiration as well as over the course of several weeks of charged particle therapy. Intrafractional/interfractional chest wall thickness changes can be a significant source of range variation in treatment of lung tumors with charged particle beams, resulting in dose distribution perturbations from the initial plan. Consideration of these range variations should be made in choosing the therapeutic charged particle beam range.
Keywords: charged particle radiotherapy, intrafractional range variation, interfractional range variation, dose distribution perturbation
INTRODUCTION
In planning charged particle beam radiotherapy, a CT simulation is performed, the target volume is drawn, beam directions are chosen and compensating boli are designed. In principle, the therapeutic beam range is chosen to adequately irradiate the target volume, yet spare distal organs at risk. Historically, specific strategies have been developed to deal with range uncertainties. For example, bolus smearing is performed to account for misalignment of the compensator and target. An additional 3% in range is added for CT numbers/stopping power conversion uncertainty. The volume to be irradiated is typically enlarged by a margin to ensure that the gross tumor volume (GTV) and clinical target volume (CTV) are enclosed by the internal target volume (ITV)/planning target volume (PTV) (both intrafractionally and interfractionally). There is an assumption that tissue thicknesses are constant over the respiratory cycle, or interfractionally. Even if there is not this assumption, there is a paucity of data on the variability of, e.g. chest wall thickness, which could be referenced in determining an appropriate margin for range changes due to tissue thickness variations.
The radiological path length along each beamlet to the distal target is one of the primary physical parameters that determine the isodose distribution. In the case of lung irradiation, the total water-equivalent path length (WEL) to the distal target is the sum of WEL contributions from the chest wall, lung tissue transited and target thickness. Knowledge of the magnitude and sources of WEL variability is important in delivering effective particle radiotherapy. The temporal variation (both intrafractionally and interfractionally) of the radiological path length to different regions of interest can be studied by analysis of serial 4DCT. This is the rationale for our analysis.
Tumor diameter shrinkage was highly variable and patient specific. We therefore present a WEL analysis of the chest wall thickness, as well as an analysis of dose coverage from variations in WEL.
Numerous publications have reported that intrafractional motion and interfractional changes can affect treatment accuracy [1–8]. In charged particle beam therapy, the primary concern is to include the moving target within the geometric coverage of the beam portal as well as in depth. Radiological path length changes in patient anatomy can occur at time-scales ranging from seconds (due to respiration and cardiac motion) to several weeks (due to tumor regression or shrinkage and weight loss, etc.). Interfractional changes such as variations in tumor size, shape, and tissue thickness and density can affect dose conformation around the target. If these changes are not considered during treatment, therapeutic goals may not be achieved, especially, when irradiating with charged particle beams due to the characteristics of Bragg peak. In this study, we have quantified WEL variations of the chest wall due to both intrafractional and interfractional motion and anatomical variations by analyzing weekly serial 4DCT data for lung cancer patients. Chest wall thickness (CWT) (as well as other) variations impact dose distributions, and we have also assessed perturbations to planned dose distributions.
MATERIALS AND METHODS
Patient characteristics
Serial CT scans of seven thoracic tumor patients (six with non-small-cell lung cancer and one with esophageal cancer) were analyzed in this study (Table 1). Both radiation and chemotherapy were administered concurrently to these patients. Informed consent was obtained in order for patients to participate in a weekly repeat 4DCT imaging study, which was approved by the Institutional Review Board (IRB).
Table 1.
Patient list
| Elapsed days after simulation (Week 0) |
Beam angle |
||||||||||||
|---|---|---|---|---|---|---|---|---|---|---|---|---|---|
| Patient no. | Age (y) | Sex | T stage | Location | Pathology | 1 | 2 | 3 | 4 | 5 | 6 | (deg) | |
| 1 | 59 | M | T2 N2 | right upper lobe | NSCLC | 7 | 12 | 19 | 26 | 33 | 40 | 0 | 210 |
| 2 | 88 | M | T2 N0 | right lower lobe | adenocarcinoma | 13 | 20 | 27 | 34 | 41 | 0 | 120 | |
| 3 | 63 | M | T3 N1 | distal esophageal | esophageal adenocarcinoma | 6 | 13 | 20 | 30 | 34 | 0 | 120 | |
| 4 | 69 | M | T4 | right upper lobe | NSCLC | 8 | 14 | 21 | 28 | 35 | 45 | 0 | 260 |
| 5 | 58 | F | T2 N3 M1 | right lower lobe | NSCLC | 13 | 22 | 29 | 36 | 43 | 60 | 180 | |
| 6 | 66 | M | Stage IIIB | right upper lobe | NSCLC | 12 | 19 | 26 | 33 | 40 | 180 | 300 | |
| 7 | 75 | M | T2 N3 | left lower lobe | NSCLC | 15 | 22 | 29 | 0 | 120 | |||
NSCLC = non-small cell lung cancer, M = male, F = female.
Data acquisition
A wing board was used during both CT scans and treatment, with arms over the head. In addition, a small vac-lock bag was used to maintain arm posture. The lower body was immobilized with a knee and foot molding (Civico Orange City, Iowa). Weekly serial 4DCT scans were acquired under free-breathing conditions using one of two commercial multi-slice CT scanners (MSCTs) (Discovery ST, General Electric Healthcare, Waukesha, WI; MX8000-IDT, Philips Medical Systems, Cleveland, OH). An initial 4DCT (Week 0) was acquired for treatment planning purposes. After the initial planning scan, weekly serial 4DCT scans (repeat CTs: Weeks 1–6) were acquired according to an in-house protocol. Weekly scans were not always performed on the same weekday for a given patient. Elapsed time between simulation and weekly CT scans is presented in Table 1. Patient respiration was monitored by tracking a reflective block placed on the patient's abdomen (RPM, Varian Medical Systems, Palo Alto, CA). The two CT scanners utilize different techniques for acquisition of 4DCT; the GE 4DCT employs a step and shoot acquisition technique [9], while the Philips 4DCT scan is acquired in helical mode [10]. The GE scanner software sorts reconstructed CT images into specific respiratory phases, while the Philips scanner sorts the temporal scans in sinogram space before reconstruction using the respiratory signal. The breathing cycle was equally subdivided into 10 phases (T0 (peak inhalation) to T90) providing 10 distinct volumetric CT scans evenly spaced over the nominal breathing period.
Data analysis
Contouring
The lungs were segmented automatically by threshold edge detection; a HU threshold of − 650 was used, and thus the pleural boundary was also included. The GTV was manually contoured on each of the serial CT scans at one phase, and propagated to all other phases of 4D data by deformable registration. The CTV/ITV was expanded by a uniform 10-mm margin, and propagated to all relevant respiratory phases on all serial scans in a similar manner. These contours are used in the analysis and dose calculations described below.
Chest wall thickness variation
One approach to measuring the WEL in serial CT is by a line profile analysis. In this method, the WEL is quantified in each CT scan along a specific rayline, one pixel wide. A practical difficulty in using a single rayline is that repositioning of the ray is inherently difficult in serial CT sets, since line position and position of pulmonary vessels can introduce noisy range instabilities. We therefore chose an region of interest (ROI) evaluation approach to minimize uncertainty from local variations and uncertainties in individual rayline placement. In the ROI approach, we report the average WEL over the ROI. Six circular ROIs, each 1.5 cm in diameter were defined by a template laid over the lung outline (ROIs positioned in the upper, mid and lower regions of each lung, as seen in Figs 1 and 2), with an additional ROI over the ITV.
Fig. 1.
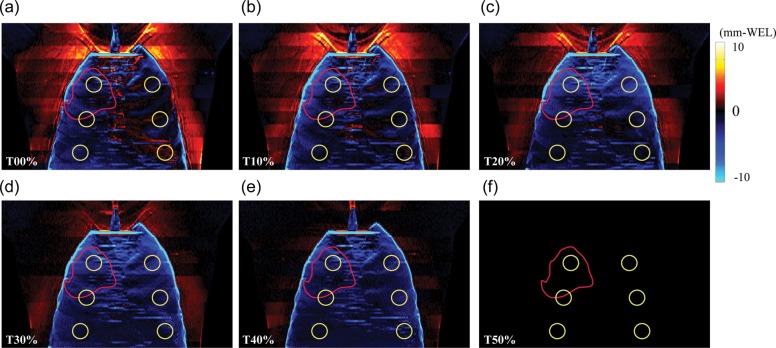
Total chest wall thickness difference maps (mm-water) (= ΔWELintra: Tn minus T50) as a function of respiratory phase in anterior–posterior (AP) view at initial CT (Week 0) (Patient No. 4).
Fig. 2.

Intrafractional mean ΔWELintra values for (a) anterior side, (b) posterior side and (c) total thickness. Yellow and red circles show lung region of interest (ROI) and ITV ROI, respectively (Patient No. 4).
WELs were calculated by converting the geometric path length between the skin and the proximal lung contour [11]. Since the source–axis distance of charged particle beams was typically >2.5 m, we ignored divergence effects. The serial CT analysis utilizes rigid registration of the CT scans into a common coordinate system (chosen to be the initial CT: Week 0) and a common respiratory phase (T50).
For an individual patient, the only chest wall thickness variations of relevance were those intercepted by the treatment portals. However, in our analysis, we also analyzed CWT in other regions (upper, mid, lower; left and right lungs). This additional analysis provides a more global understanding of where CWTs might vary, maximizing the utilization of rich serial 4DCT scans.
The WEL measurements of the chest wall thickness are made over the lung ROIs from an AP Beam's eye view. The rationale for choosing this measurement is as follows. Limiting the analysis to a single AP direction standardizes variations in chest wall thickness. While an individual beam portal at an oblique angle to the chest wall results in a different CWT, consideration of each potential beam angle would make the analysis cumbersome and complex.
Chest wall measurements are separated into anterior and posterior chest wall WELs at various positions in the left and right lung (upper, middle, lower). Serial measurements provide a general measure of reproducibility and stability of the radiological path length over time. Those of the chest wall WEL at various regions of the lung provide insight into its variability, which is important, since lung plans may employ an anterior portal.
Dose calculations
Serial proton dose distributions were calculated as follows. A bolus is designed to cover a moving target in the respiratory-gated phase interval (T40–T60) using 4DCT scan data. The bolus-smearing radius applied was 4 mm. This bolus was then applied to subsequent serial 4DCT data to calculate the dose each week. The prescribed dose was 63 GyE in 1.8 GyE/fraction. Two-field proton dose distributions for each respiratory phase were calculated using a pencil-beam algorithm [12]. The dose was calculated by using B-spline-based deformable image registration applied to each scan's weekly dose distribution.
This is not highly relevant to our discussion; it was seen as more important to focus on the specifics of our analysis.
RESULTS
All reported values of ΔWEL are in millimeters water-equivalent path length. The associated uncertainties are tabulated in Table 2.
Table 2.
The intrafractional and interfractional changes for chest wall thickness averaged over all patients
| Intrafractional change (T0 − T50) |
Interfractional change (Week 6 − Week 0) |
|||||||||
|---|---|---|---|---|---|---|---|---|---|---|
| Metrics | ROI position | Mean | SEM | SD | Range | Mean | SEM | SD | Range | |
| ΔTotal chest wall (mm-WEL) | ITV | −4.1 | −1.7 | 0.2 | (−10.2 – 1.8) | −4.0 | 0.7 | 2.8 | (−8.6 – 1.4) | |
| Upper | left | −3.6 | −1.7 | 1.9 | (−7.1 – 2.0) | −9.1 | 1.4 | 5.6 | (−17.9 – 4.1) | |
| right | −3.5 | 0.2 | 1.7 | (−7.1 – 1.4) | −8.6 | 1.2 | 5.0 | (−13.6 – 2.5) | ||
| Middle | left | −2.5 | 0.2 | 1.4 | (−4.9 – 1.0) | −9.4 | 2.3 | 9.4 | (−25.3 – 1.0) | |
| right | −3.2 | 0.2 | 1.6 | (−5.6 – 1.4) | −2.9 | 0.9 | 3.6 | (−7.4–2.7) | ||
| Lower | left | −2.5 | 0.2 | 1.2 | (−4.4 – 1.5) | −3.9 | 1.8 | 7.3 | (−15.6–4.2) | |
| right | −2.5 | 0.2 | 1.1 | (−5.1 – 1.6) | −4.5 | 1.2 | 4.8 | (−10.4–2.9) | ||
| ΔAnterior chest wall (mm-WEL) | ITV | −1.7 | 0.2 | 1.4 | (−4.3 – 0.4) | −2.3 | 0.2 | 0.8 | (−3.6 – 1.8) | |
| Upper | left | −2.3 | 0.2 | 1.2 | (−5.0 – 0.9) | −5.7 | 1.1 | 4.6 | (−13.2 – 0.7) | |
| right | −2.2 | 0.2 | 1.1 | (−4.3 – 0.8) | −4.7 | 0.7 | 2.6 | (−8.3 – 2.1) | ||
| Middle | left | −1.2 | 0.1 | 0.7 | (−2.9 – 0.5) | −5.9 | 1.2 | 4.8 | (−13.8 – 1.4) | |
| right | −2.0 | 0.2 | 1.2 | (−4.8 – 1.1) | −1.0 | 0.3 | 1.3 | (−2.6–0.9) | ||
| Lower | left | −1.5 | 0.1 | 0.8 | (−3.1 – 0.6) | −2.9 | 1.0 | 4.1 | (−9.2–1.9) | |
| right | −1.7 | 0.1 | 1.0 | (−4.2 – 0.9) | −1.4 | 0.8 | 3.1 | (−5.1–3.6) | ||
| ΔPosterior chest wall (mm-WEL) | ITV | −2.6 | 0.3 | 2.0 | (−6.0 – 0.9) | −1.7 | 0.5 | 2.1 | (−5.0–0.6) | |
| Upper | left | −1.3 | 0.1 | 0.9 | (−3.5 – 0.5) | −3.4 | 0.5 | 1.8 | (−5.2 – 0.5) | |
| right | −1.4 | 0.1 | 0.7 | (−3.0 – 0.8) | −3.9 | 0.7 | 2.7 | (−7.3 – 0.2) | ||
| Middle | left | −1.3 | 0.1 | 0.7 | (−3.1 – 0.9) | −3.6 | 1.2 | 4.7 | (−11.5–0.4) | |
| right | −1.2 | 0.1 | 0.9 | (−3.5 – 0.6) | −1.9 | 0.7 | 2.7 | (−5.7–1.9) | ||
| Lower | left | −1.3 | 0.1 | 0.8 | (−3.3 – 0.8) | −0.9 | 0.8 | 3.3 | (−6.4–2.3) | |
| right | −1.0 | 0.1 | 0.5 | (−2.5 – 0.7) | −3.1 | 0.4 | 1.7 | (−5.4 – 0.7) | ||
The results of the intrafractional and interfractional changes were used as the 4DCT datasets for the initial CT (Week 0) and peak exhalation (T50), respectively. SEM= standard error of the mean, SD = standard deviation.
Intrafractional chest wall thickness
The chest wall varies during respiration. The intrafractional total chest wall thickness difference (=ΔWELintra) maps (Tn minus T50) as a function of respiratory phase on the initial 4DCT (Week 0) are shown in Fig. 1 (Patient No. 4). In this example case, the tumor is located in the right upper lobe (ITV indicated by the red circle in Fig. 1). Furthermore, horizontal bands were observed where a slice at a given position might have anatomical inconsistencies (a few mm-WEL). The anterior and posterior chest wall thickness, as well as total ΔWELintra plots as a function of respiratory phase on the initial 4DCT scan, are shown in Fig. 2a–c. The mean ΔWELintra is seen to vary very little as a function of phase. The ΔWELintras at inhale are less than those at exhale (T50) for all ROIs. As the patient exhales, there is an increase in WEL (Table 2).
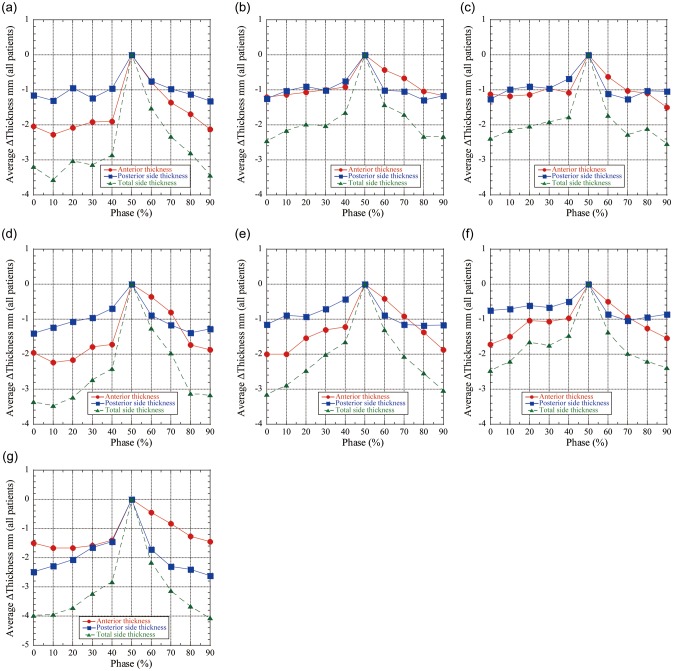
The mean values of the anterior and posterior chest wall WEL thicknesses (for all patients and all ROIs) decrease over the course of therapy (Fig. 2); the anterior chest wall thickness decreased by 1.7 mm (< − 4.3mm) over the ITV region, 2.3 mm (< − 5.0 mm) for upper lung, and 2.0 mm (< − 4.8 mm) for middle lung, and 1.7 mm (< − 4.2 mm) for lower lung. The posterior chest wall decreased by − 2.6 mm (< − 6.0 mm) over the ITV region, 1.4 mm (< − 3.5 mm) for upper lung, 1.3 mm (< − 3.5 mm) for middle lung, and 1.3 mm (< − 3.3 mm) for lower lung ROIs. The total chest wall thickness mean variations decreased by 4.1 mm (< − 10.2 mm) for the ITV region, 3.6 mm (< − 7.1 mm) for upper lung, 3.2 mm (< − 5.6 mm) for middle lung and 2.5 mm (< − 4.4 mm) for lower lung ROIs during respiration. Chest wall thicknesses at some respiratory phases show positive values. These results are summarized in Table 2.
Interfractional chest wall thickness
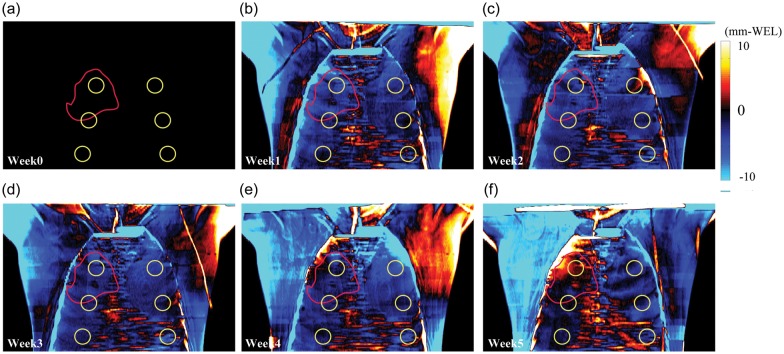
The chest wall thickness also varies over the course of therapy. Weekly total chest wall thickness difference (ΔWELinter) maps for Patient No. 4 at peak-exhalation are shown in Fig. 3. The ΔWELinter over the left and right flanks (arrow) shows positive WEL variations except for Week 1 and Week 5 due to misalignment of the arm position between the planning CT and subsequent weekly CTs.
Fig. 3.
Weekly chest wall thickness difference maps at peak-exhalation (T50) in AP view (ΔWELinter: repeat CT minus initial CT (Week 0)) (Patient No. 4). Yellow and red circles show lung region of interest (ROI) and ITV ROI, respectively.
The weekly ΔWELinters for each ROI for Patient No. 4 are shown in Fig. 4a–c. The mean ΔWELinter over the ITV decreased from − 2.0 mm, 0.6 mm and − 1.4 mm at Week 6 for anterior, posterior and total chest wall thickness, respectively. The ΔWELinter plots fluctuated in Week 5, and ΔWELsinter for right lower and ITV ROIs showed positive values.
Fig. 4.
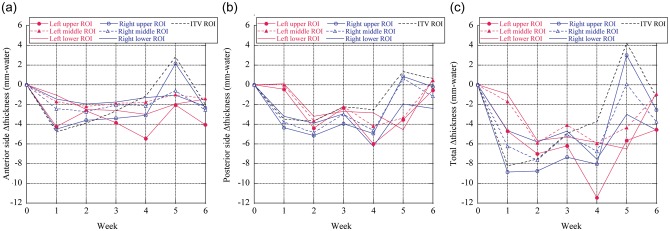
Interfractional mean ΔWELintra values for (a) anterior side, (b) posterior side, and (c) total thickness. Yellow and red circles show lung region of interest (ROI) and ITV ROI, respectively (Patient No. 4).
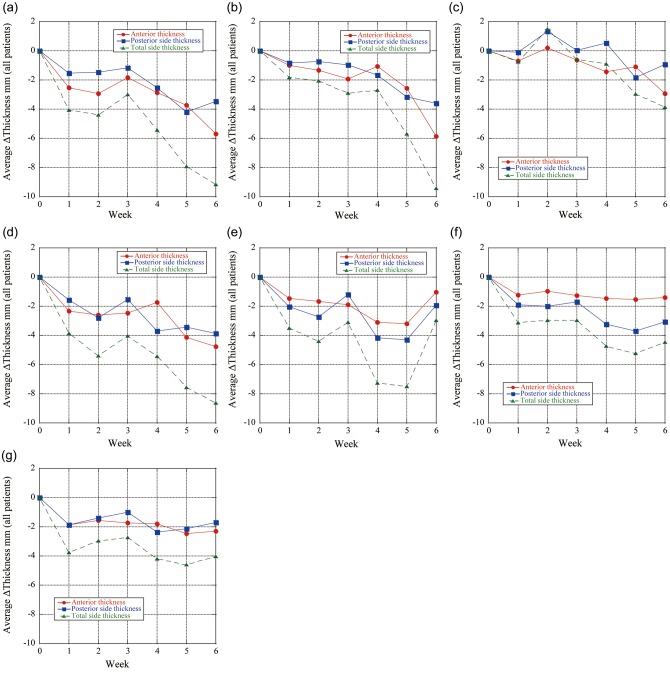
The average chest wall thickness variations over the ITV region for all patients decreased by 2.3 mm (< − 3.6 mm) and 1.7 mm (< − 5.0 mm) anteriorly and posteriorly compared with the initial planning CT scan, respectively (Fig. 5). The anterior chest wall thickness averaged for both lungs in Week 6 decreased by 5.2 mm for upper lung, 2.1 mm for middle lung and 1.6 mm for lower lung; the posterior chest wall thickness averaged over both lungs in Week 6 decreased by 3.7 mm for upper lung, 2.8 mm for middle lung, and 2.0 mm for lower lung. Therefore, anterior and posterior chest wall WEL thicknesses showed clinically relevant changes over the treatment course. Interfractional total chest wall thicknesses decreased during the treatment. Mean interfractional chest wall thickness changes show negative values except for the anterior side of the lower lung (Fig. 6c). Total chest wall thickness variations in Week 6 were − 4.0mm (< − 8.6 mm), − 9.1 mm (< − 17.9 mm), − 9.4 mm (< − 25.3 mm) and − 4.5 mm (< − 10.4 mm) for ITV region, upper, middle and lower lungs, respectively. The associated uncertainties are tabulated in Table 2.
Fig. 5.
Intrafractional chest wall thickness differences (ΔWELintra: Tn minus T50) averaged in all patients as a function of respiratory phases at initial CT (Week 0). ΔWELintra is expressed in mm-water dimension. (a) Left upper region of interest (= ROI). (b) Left middle ROI. (c) Left lower ROI. (d) Right upper ROI. (e) Right middle ROI. (f) Right lower ROI. (g) Internal target volume (= ITV) ROI.
Fig. 6.
Weekly chest wall thickness differences (ΔWELinter: repeat CT minus initial CT (Week 0)) at peak-exhalation (T50) averaged in all patients. ΔWELinter is expressed in mm-water dimension. (a) Left upper region of interest (= ROI). (b) Left middle ROI. (c) Left lower ROI. (d) Right upper ROI. (e) Right middle ROI. (f) Right lower ROI. (g) Internal target volume (= ITV) ROI.
Dose distributions
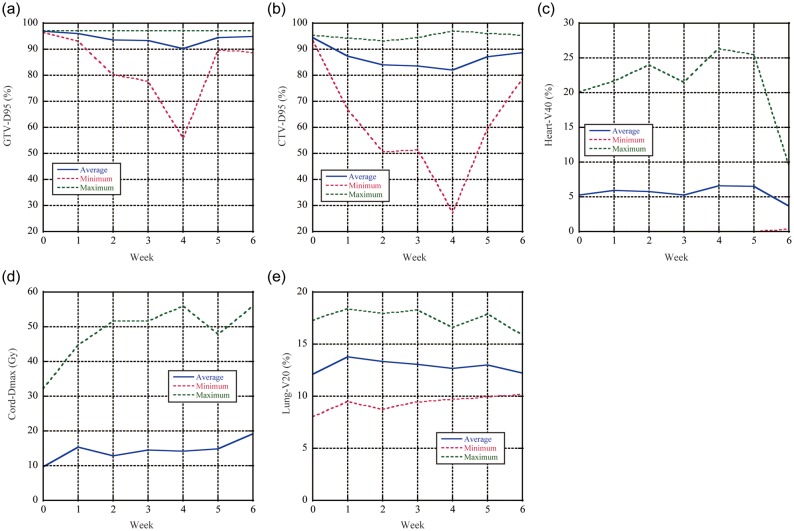
Weekly dose distributions and dose difference distributions (Week n minus Week 0) are shown in Fig. 7 (Patient No. 5). The initial two-field plan covers the CTV adequately on Week 0 as planned and as expected. However, positive dose differences are seen in the distal region, due to interfractional anatomical and patient positional changes (Fig. 7). Dose metrics averaged over all patients are summarized as a function of week (Fig. 8a–e). D95 values for GTV and CTV significantly increased after Week 4 because D95 values for GTV and CTV for Patient No. 7 showed 55.9 and 27.0%, respectively, at Week 4. CTV-D95 values after Week 0 were < 90% (Fig. 8b).
Fig. 7.
(a) Accumulated dose distributions and dose differences (Week n minus Week 0) from Week 0 to Week 5 (Patient No. 5). Yellow, red, green, light blue and blue lines show CTV, 95, 90, 70 and 50% dose lines. Dose assessment results averaged over all patients for (b) D95-GTV, (c) D95-CTV, (d) V40-heart, (e) Dmax-cord and (f) V20-lung.
Fig. 8.
Dose assessment results averaged over all patients for (a) D95-GTV, (b) D95-CTV, (c) V40-heart, (d) Dmax-cord, and (e) V20-lung (Patient No. 5).
DISCUSSION
We have quantified WEL variations due to intrafractional and interfractional geometric changes using weekly serial 4DCT scans in seven patients. The most clinically relevant finding is that chest wall thickness variations can cause changes in WEL of up to − 1.0 cm and − 2.5 cm due to intrafractional motion and interfractional changes, respectively. Although a limited number of patients were evaluated, our results indicate that using the initial treatment plan throughout a course of charged particle therapy may be problematic. Actually, our conclusion is that an uncertainty in CWT must be factored into uncertainties/planning.
Our study has mainly focused on chest wall thicknesses along the AP direction. While many beam angles are used in actual treatment, there are several reasons for ‘characterizing’ the CWT from the AP. When quantifying a WEL thickness such as a chest wall, it is straightforward to characterize changes in the AP direction. Reporting chest wall thickness from multiple beam angles would dilute the chest wall thickness WEL trends. The AP beam direction is also commonly used in irradiation of lung tumors. These arguments also apply to the transmission measurements. For a specific patient with beam portals in addition to the AP, our analysis does not provide insight into such range changes. Given the multiplicity of beam angles for the seven patients, however, we offer a standard beam angle, which provides some insight into range changes during and over the course of therapy. Clinical lung treatment planning typically employs two to three different beam orientations, and each beam covers the target to mitigate range uncertainties.
From our study, we found that intrafractional and interfractional anterior chest wall thickness changes averaged over all patients can result in < − 4.3 mm and − 3.6 mm WEL differences over the ITV for the AP beam angle. Another factor causing interfractional WEL variation is lack of reproducibility of the diaphragm position. As a result, structures in the lung and the diaphragm are shifted. The interfractional range changes, therefore, are a result of both interfractional changes and respiratory inconsistency. While our evaluation methodology, which is the calculated WEL along the respective rayline, is simple, therefore, it is small possibility to lead to the systematic gradual WEL decreases.
Managing interfractional chest wall thickness variations through the treatment course is challenging. WEL variations due to interfractional changes are dependent on treatment variations in setup. Although these patients were treated with radiation and chemotherapy, weight loss was not the primary reason for changes in chest wall thickness, because no significant weight loss in this patient cohort was observed. Chest wall thickness data showed variation every week, which was attributed to patient setup variations (in particular, maintaining a reproducible arm-up position, because the patient setup was registered by bony structures not soft tissues) [13]. Most patients are nervous during the first few treatment fractions, which might also affect the patient setup accuracy. In addition, there is a trend that chest wall thickness decreases gradually through the treatment course.
We calculated interfractional dose distributions including intrafractional motion (accumulated dose distribution) and evaluated dose metrics. Dose conformation was degraded, and increased dose to normal tissues was seen after Week 0. This can be a result of both interfractional chest wall thickness variation, and target positional reproducibility in every fraction [1]. The GTV/CTV-D95 metrics sharply decreased at Week 4 due to tumor positional changes for Patient No. 7 because we registered the base from the bony anatomical structures rather than tumor position.
To validate and increase treatment accuracy, several treatment centers acquire CT/4DCT to verify the dose distribution. If necessary, adapted treatment planning (= replanning) is performed [14]. However, if the initial treatment plan bolus were to be used throughout the treatment course, beam overshoot could result. Such changes could result in an underdose in the proximal target due to deeper penetration of the spread-out Bragg peak (SOBP). Therefore, one should consider interfractional range changes when planning treatment with charged particle therapy.
Over the course of therapy, we observed a trend of decreasing WEL in chest wall thickness. Increases in range to the target could result in beam underpenetration. This would result in a modest increase in dose to normal tissues proximal to the target but, more importantly, in an underdose to the target. Overpenetration due to decreased WEL variation results in tens of percent dose proximal to the SOBP. Underpenetration due to increased ΔWEL gives no charged particle dose to the distal edge of the target, therefore, increased WEL variation is more important than decreased ΔWEL variation. Several institutions have developed bolus design algorithms to include intrafractional motion to avoid underdosage to the target and minimize excessive dose to the normal tissues [15, 16]. Typically 4D charged particle treatment-planning analyses reported calculations based on the use of a single 4DCT planning scan [17, 18]. Adaptive 4D treatment planning, including deformable image registration, to calculate dose to elemental masses of tissue throughout the treatment course has yet to be fully developed and validated. Quantitative chest wall thickness variations using serial 4DCT datasets are useful for developing new techniques and establishing the criteria of replanning to improve dose conformity throughout the treatment course.
CONCLUSION
In this study, we performed a regional analysis of WEL variations for thoracic cancer patients throughout their course of treatment using serial 4DCT imaging. Chest wall thickness was identified as the largest common factor among all patients affecting range variations, potentially resulting in beam overshoot in charged particle therapy. Immobilization and better reproducibility of the arm position may be important to minimize the changes in chest wall thickness, especially in the upper chest region. Although our analysis has been applied to thoracic cancer patients, the methodology could be adapted for other anatomical sites. In light of the rapid progressing of imaging techniques, quantitative information in intrafractional motion and interfractional changes should be evaluated and incorporated into image-guided charged particle therapy.
FUNDING
This work is supported in part by NIH/NCI Grant No. CA19138.
REFERENCES
- 1.Britton KR, Starkschall G, Tucker SL, et al. Assessment of gross tumor volume regression and motion changes during radiotherapy for non-small-cell lung cancer as measured by four-dimensional computed tomography. Int J Radiat Oncol Biol Phys. 2007;68:1036–46. doi: 10.1016/j.ijrobp.2007.01.021. [DOI] [PubMed] [Google Scholar]
- 2.Chen QS, Weinhous MS, Deibel FC, et al. Fluoroscopic study of tumor motion due to breathing: facilitating precise radiation therapy for lung cancer patients. Med Phys. 2001;28:1850–6. doi: 10.1118/1.1398037. [DOI] [PubMed] [Google Scholar]
- 3.Erridge SC, Seppenwoolde Y, Muller SH, et al. Portal imaging to assess set-up errors, tumor motion and tumor shrinkage during conformal radiotherapy of non-small cell lung cancer. Radiother Oncol. 2003;66:75–85. doi: 10.1016/s0167-8140(02)00287-6. [DOI] [PubMed] [Google Scholar]
- 4.Hector CL, Evans PM, Webb S. The dosimetric consequences of inter-fractional patient movement on three classes of intensity-modulated delivery techniques in breast radiotherapy. Radiother Oncol. 2001;59:281–91. doi: 10.1016/s0167-8140(01)00309-7. [DOI] [PubMed] [Google Scholar]
- 5.Plathow C, Ley S, Fink C, et al. Analysis of intrathoracic tumor mobility during whole breathing cycle by dynamic MRI. Int J Radiat Oncol Biol Phys. 2004;59:952–9. doi: 10.1016/j.ijrobp.2003.12.035. [DOI] [PubMed] [Google Scholar]
- 6.Starkschall G, Balter P, Britton K, et al. Interfractional reproducibility of lung tumor location using various methods of respiratory motion mitigation. Int J Radiat Oncol Biol Phys. 2011;79:596–601. doi: 10.1016/j.ijrobp.2010.03.039. [DOI] [PubMed] [Google Scholar]
- 7.Michalski D, Sontag M, Li F, et al. Four-dimensional computed tomography-based interfractional reproducibility study of lung tumor intrafractional motion. Int J Radiat Oncol Biol Phys. 2008;71:714–24. doi: 10.1016/j.ijrobp.2007.10.038. [DOI] [PubMed] [Google Scholar]
- 8.Hui Z, Zhang X, Starkschall G, et al. Effects of interfractional motion and anatomic changes on proton therapy dose distribution in lung cancer. Int J Radiat Oncol Biol Phys. 2008;72:1385–95. doi: 10.1016/j.ijrobp.2008.03.007. [DOI] [PMC free article] [PubMed] [Google Scholar]
- 9.Pan T, Lee TY, Rietzel E, et al. 4D-CT imaging of a volume influenced by respiratory motion on multi-slice CT. Med Phys. 2004;31:333–40. doi: 10.1118/1.1639993. [DOI] [PubMed] [Google Scholar]
- 10.Keall PJ, Starkschall G, Shukla H, et al. Acquiring 4D thoracic CT scans using a multislice helical method. Phys Med Biol. 2004;49:2053–67. doi: 10.1088/0031-9155/49/10/015. [DOI] [PubMed] [Google Scholar]
- 11.Kanematsu N, Matsufuji N, Kohno R, et al. A CT calibration method based on the polybinary tissue model for radiotherapy treatment planning. Phys Med Biol. 2003;48:1053–64. doi: 10.1088/0031-9155/48/8/307. [DOI] [PubMed] [Google Scholar]
- 12.Petti PL. Differential-pencil-beam dose calculations for charged particles. Med Phys. 1992;19:137–49. doi: 10.1118/1.596887. [DOI] [PubMed] [Google Scholar]
- 13.Bert C, Metheany KG, Doppke K, et al. A phantom evaluation of a stereo-vision surface imaging system for radiotherapy patient setup. Med Phys. 2005;32:2753–62. doi: 10.1118/1.1984263. [DOI] [PubMed] [Google Scholar]
- 14.Kato S, Ohno T, Tsujii H, et al. Dose escalation study of carbon ion radiotherapy for locally advanced carcinoma of the uterine cervix. Int J Radiat Oncol Biol Phys. 2006;65:388–97. doi: 10.1016/j.ijrobp.2005.12.050. [DOI] [PubMed] [Google Scholar]
- 15.Mori S, Wu Z, Folkert MR, et al. Practical approaches to four-dimensional heavy-charged-particle lung therapy. Radiol Phys Technol. 2010;3:23–33. doi: 10.1007/s12194-009-0072-3. [DOI] [PubMed] [Google Scholar]
- 16.Kang Y, Zhang X, Chang JY, et al. 4D Proton treatment planning strategy for mobile lung tumors. Int J Radiat Oncol Biol Phys. 2007;67:906–14. doi: 10.1016/j.ijrobp.2006.10.045. [DOI] [PubMed] [Google Scholar]
- 17.Mori S, Yanagi T, Hara R, et al. Comparison of respiratory-gated and respiratory-ungated planning in scattered carbon ion beam treatment of the pancreas using four-dimensional computed tomography. Int J Radiat Oncol Biol Phys. 2010;76:303–12. doi: 10.1016/j.ijrobp.2009.05.026. [DOI] [PubMed] [Google Scholar]
- 18.Rietzel E, Liu AK, Doppke KP, et al. Design of 4D treatment planning target volumes. Int J Radiat Oncol Biol Phys. 2006;66:287–95. doi: 10.1016/j.ijrobp.2006.05.024. [DOI] [PubMed] [Google Scholar]


