Abstract
Oligosaccharides (OS) from bovine milk are a class of bioactive molecules that are receiving increasing commercial attention for their potential health benefits. In the present work we measured, comprehensively and systematically, free milk OS in the colostrum of 7 Holstein-Friesian cows during the first 3 d of lactation in 12-h intervals by HPLC-chip/time-of-flight mass spectrometry to determine the biological variation of free milk OS in early lactation. The high sensitivity and resolution of the analytical technique made it possible to monitor all OS species, thus providing a comprehensive and quantitative analysis of OS variations during colostrum production. This study confirmed that although sialyllactose is the major OS in bovine colostrum, several neutral OS species are present in significant abundance even at the third day of lactation. Furthermore, variation in terms of OS species and relative abundances of OS between cows suggest individual animal variation. These variations are likely due to genetic factors because environmental factors such as nutrition, lactation number, and accommodation were the same for all cows. This investigation revealed that colostrum milk from Holstein-Friesian cows is a rich source of neutral and acidic OS for the food and pharmaceutical industries.
Keywords: oligosaccharide, Holstein-Friesian colostrum, high performance liquid chromatography, time-of-flight mass spectrometry
INTRODUCTION
Milk, the only food for neonates of all mammals, contains mainly proteins, lipids, lactose, and oligosaccharides (OS). It is known that the composition of milk changes during the stages of lactation. The differences in composition are more evident between colostrum and milk, given that the biological role of colostrum is recognized to extend beyond its nutritional role. Evidence is accumulating that free OS are of importance because of their bioactive properties such as prebiotic activity and protection against microbial pathogens (Gopal and Gill, 2000; Coppa et al., 2004; Martinez-Ferez et al., 2006; Boehm and Stahl, 2007; LoCascio et al., 2007). The OS identified so far in bovine milk are from 2 main classes: acidic OS containing sialic acid (NeuAc) and neutral OS containing N-acetylhexosamine (HexNAc). It has been shown that OS act as receptor analogs for cell surface sites in the digestive tract epithelium, preventing the adhesion of bacteria such as Helicobacter pylori (Simon et al., 1997) and viruses (Pacitti and Gentsch, 1987; Rolsma et al., 1998). Sialic acid, a key component in both bovine and human milk OS, is estimated to be responsible for the long-term beneficial effects observed in breastfed infants such as long-term cognitive advantages (Wang et al., 2007; Rees and Sabia 2009). Based on their bioactive functions, OS may be of great interest for applications in the food and pharmaceutical industries (Gopal and Gill, 2000; Nakamura et al., 2003). Thus, it is important to investigate the structure of OS to understand the relationship between their structure and biological function.
The higher concentration of OS and the consequent ease of isolation, purification, and identification make bovine colostrum a preferred source of OS over mature bovine milk. Most of the published studies on bovine colostrum have focused on sialyloligosaccharides for which commercial standards exist (Martín-Sosa et al., 2003; Nakamura et al., 2003; McJarrow and van Amelsfort-Schoonbeek, 2004). Martín-Sosa et al. (2003) monitored 5 sialyloligosaccharides in the colostrum of 6 Spanish-Brown cows at d 2 of lactation. Nakamura et al. (2003) monitored 3 sialyloligosaccharides in the colostrum of 4 Holstein cows over a 168-h postpartum period. McJar-row and van Amelsfort-Schoonbeek (2004) monitored 3 sialyloligosaccharides in the colostrum of 2 Jersey and 2 Friesian cows over the first 5 milkings. Furthermore, these authors monitored 4 sialyloligosaccharides from the first milking postpartum of 15 Jersey and 18 Frie-sian cows, and from the first 2 d milking postpartum in pooled colostrum from Jersey and Friesian herds. All of these studies were limited by the need for and the lack of available commercial OS standards.
New analytical strategies using HPLC-chip/time-of-flight (TOF) MS allow for the discovery of new OS in human milk, thereby facilitating an understanding of their structure/function relationships (Ninonuevo et al., 2006; LoCascio et al., 2007). Additionally, Tao et al. (2008, 2009) reported the use of HPLC-chip/TOF MS to monitor changes in the composition and relative abundance of bovine milk OS during the early and mid lactation periods from pooled and individual bovine milk samples.
The aim of the present work was to evaluate the presence of acidic and neutral OS profiles of bovine colostrum from Holstein-Friesian cows during the first 3 d of lactation (60 h) using HPLC-chip/TOF MS to determine the optimal production of free OS. The high sensitivity and resolution of this analytical technique makes it possible to monitor not only all OS species (neutral and acidic) rapidly and completely, but also the different OS isomers, which include compositional, structural, and linkage isomers, thus providing a comprehensive analysis of OS variations during colostrum production. The cows selected were matched based on nutrition, lactation number, and accommodations to avoid variability in the sample set. The results from this investigation will provide not only the various OS compositions from both neutral and acidic OS in colostrum expressed over the first 60 h of lactation, but also the individual variations among the individual cows based on their OS profiles.
MATERIALS AND METHODS
Collection of Colostrum Samples
Colostrum samples were collected from 6 Holstein-Friesian cows from a herd housed in Moorepark Research Centre, Ireland (cows #2563, #2592, #2610, #2611, #4576, and #4579). To avoid variations in OS composition due to external variables, the cows were provided with the same nutrition, matched for lactation number (2), and calved within a compact period (1 mo); all were housed in the same dry accommodation. The colostrum samples were collected immediately after parturition and then every 12 h for a 60-h (3-d) postpartum period. Samples were frozen immediately at −20°C until analysis. One sample (cow #2611 at milking 5) was discarded during the study because of the presence of contaminants.
Isolation and Purification of OS
Colostrum samples (0.5 mL) were completely thawed, diluted with an equal volume of nanopure water, and centrifuged at 2,860 × g for 30 min at 4°C. The top fat layer was removed, 4 volumes of chloroform/methanol (2:1 vol/vol) were added, and the mixture was centrifuged at 2,860 × g for 30 min at 4°C. The upper layer was carefully transferred to a separate vial and 2 volumes of pure ethanol were added. After an overnight incubation at 4°C, the mixture was centrifuged at 2,860 × g for 30 min at 4°C to separate the denatured proteins. The OS-containing supernatant was removed and dried in vacuum (MiVac Quattro Concentrator, Genevac Ltd., Ipswich, UK). The dried OS were resuspended in 1 mL of 2 M sodium borohydride in nanopure water and incubated at 72°C for 1 h to convert the OS from the aldehyde form to the alditol form. After reduction, residual lipids and peptides were removed using conditioned C8 columns (DSC-C8 Discovery, 3-mL tube capacity, 500-mg bed weight, Supelco, Bellefonte, PA). The C8 sorbent was conditioned with 2 cartridge volumes of acetonitrile, followed by 2 cartridge volumes of nanopure water. The OS-containing solutions were slowly loaded onto the cartridges, and the OS were collected in the eluate. An additional 1 mL of nanopure water was applied to the cartridge to ensure the collection of residual OS. The OS-rich solutions were further purified by solid-phase extraction using conditioned graphitized carbon cartridges (150 mg carbon, 4-mL tube capacity, Alltech, Deerfield, IL) to remove salts and contaminants. Each cartridge was conditioned with nanopure water, 0.05% (vol/vol) trifluoroacetic acid in 80% acetonitrile in water (vol/vol), and nanopure water (3 cartridge volumes) before sample loading. The OS-containing solutions were applied to the cartridges, and the salts were removed by washing with 10 cartridge volumes of nanopure water at a flow rate of about 1 mL/min. The OS were eluted from the cartridges using 7 mL of 20% acetonitrile in nanopure water (vol/vol) and dried in vacuum before MS analysis.
HPLC-Chip/TOF MS
Oligosaccharide fractions collected after solid-phase extraction were analyzed using the 6200 Series HPLC-chip/TOF MS instrument (Agilent Technologies, Santa Clara, CA) according to the method reported by Tao et al. (2009). The Glycan Chip (G4240-62003, Agilent Technologies) used for the separation consisted of an enrichment column for sample concentration and an analytical separation column for separation and a nano-electrospray tip. Separation was performed by using binary gradient A: 3% acetonitrile in 0.1% formic acid solution and B: 90% acetonitrile in 0.1% formic acid solution. The column was initially equilibrated and eluted with the flow rate at 0.3 νL/min for the nanopump and 4 νL/min for the capillary pump. The 65-min gradient was as follows: 2.5–20.0 min, 0–16% B; 20.0–30.0 min, 16–44% B; 30.0–35.0 min, B increased to 100% and held at 100% B for 10 min, and finally, 0% B for 20 min to equilibrate the chip column before the next sample injection. Internal calibration was performed using m/z 1221.991 and 1521.9715 as the reference masses (ESI-TOF Tuning Mix G1969–85000, Agilent Technologies). The mass lists obtained from the HPLC-chip/TOF MS were deconvoluted using the Molecular Feature Extractor from Mass Hunter Qualitative Analysis Version B.03.01 (Agilent Technologies). The deconvoluted masses were matched to OS compositions using an in-house program, Glycan Finder, written in Igor Pro version 5.04B (WaveMetrics Inc., Portland, OR). The algorithm examines a list of experimentally measured masses and searches for all possible monosaccharide combinations matching the experimental mass within a specified tolerance level. Oligosaccharide compositions determined had mass errors ≤10 ppm. Quantitation of each OS was performed based on intensity (counts per second, cps) and, in some instances, by the area under the curve (AUC) of selected OS peaks.
RESULTS AND DISCUSSION
Currently only a few commercial standards are available for bovine OS; therefore, the highest number of oligosaccharides identified in both human and bovine milks to date has been obtained using the HPLC-chip/ TOF MS technique.
The present work builds upon previous knowledge about the unique retention times and accurate mass measurement of bovine colostrum and milk OS by HPLC-chip/TOF MS and by structural information derived from tandem MS (Tao et al., 2008, 2009). The use of porous graphitized carbon as a separating medium has proven effective in separating OS isomers (Ninonuevo et al., 2006; LoCascio et al., 2007). The present investigation avoided variations in OS composition from external variables by providing the cows the same nutrition, matching lactation number, calving within a defined period, and housing in the same dry accommodation. The same number of OS was identified as in previously published data for pooled d 1 colostrum from Holstein cows (Tao et al., 2009). Although the number of oligosaccharides identified in the 2 studies was the same, differences were observed in the OS composition. In the present investigation, 16 neutral and 24 acidic OS were detected, 2 of which contained the N-glycolylneuraminic acid form of sialic acid, whereas Tao et al. (2009) identified 11 neutral and 29 acidic OS, 7 of which contained N-glycolylneuraminic acid. The identified OS were not all present in each cow at each milking. As shown in Figure 1, the total number of OS in individual cows ranged between 14 (cow #2563) and 32 (cow #4576) at time 0 h and decreased by 60 h. This decrease was particularly evident in cow #4576, where the total number of OS decreased from 32 to 10 within 60 h. It is likely that variations observed in OS composition depend on the unique genetic variability analogous to that in humans (Ninonuevo et al., 2006).
Figure 1.
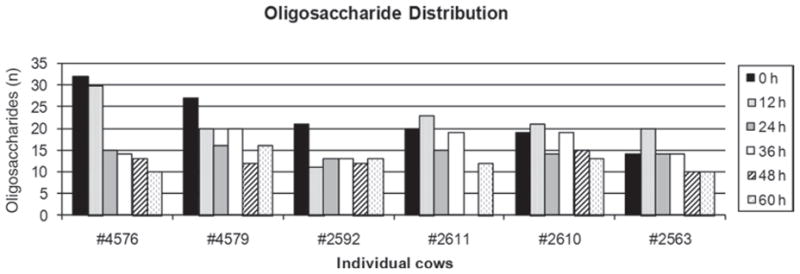
Distribution of oligosaccharides in colostrum samples collected during the first 60 h of colostrum production from 6 individual Holstein-Friesian cows.
The scientific literature on bovine colostrum oligosaccharides states that sialyllactose (SL; specifically the isomer 3′-sialyllactose, NeuAcα2→3Gal β1→4Glc) is the most abundant OS (Gopal and Gill, 2000; Martín-Sosa et al., 2003; Nakamura et al., 2003; McJarrow and van Amelsfort-Schoonbeek, 2004; Tao et al., 2009). However, there is no general agreement on the abundance of other OS following 3′-SL. This is probably because of differences such as breed or analytical method used. The present work also observed that the acidic 3′-SL is the most abundant OS in Holstein-Friesian colostrum, which is in agreement with the literature. However, in 2 out of 35 samples, sialyllactosamine [composition: 1 hexose (Hex), 1 HexNAc, 1 NeuAc] was the prevailing OS. Gopal and Gill (2000) reported that sialyllactosamine was the second most abundant OS after 3′-SL, which was subsequently corroborated in studies by other researchers (Martín-Sosa et al., 2003; Nakamura et al., 2003; McJarrow and van Amelsfort-Schoonbeek, 2004). In the present study, we found that in only 5.8% of the samples was sialyllactosamine the second most abundant OS, whereas in approximately 80%, 2 other OS were predominant following 3′-SL. Specifically, in 56% of the samples, the second most abundant was a neutral OS at m/z 871 with a composition of 4 Hex and 1 HexNAc, whereas in the remaining 23% of samples, a neutral OS at m/z 709 with a composition of 3 Hex and 1 HexNAc was the second most abundant.
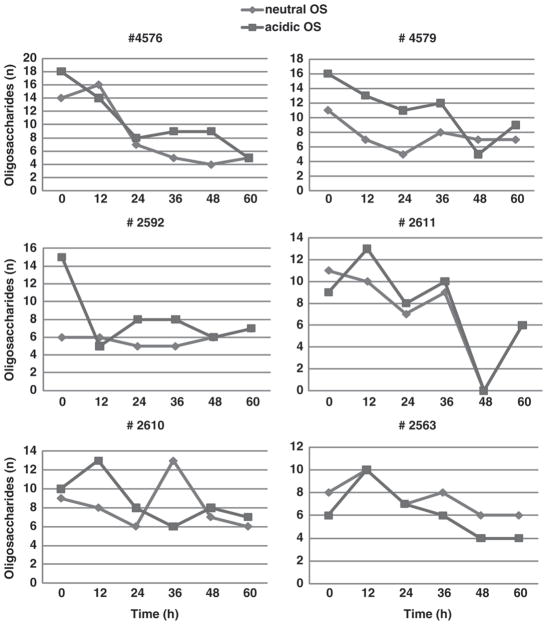
Unlike in previous studies, the combination of bio-analytical MS and controlled sample collection allowed for the discovery that the neutral OS were numerically almost as abundant as acidic OS on d 3 of colostrum production. Figure 2 reports the changes in acidic and neutral OS from each individual cow from 0 to 60 h.
Figure 2.
Distribution of acidic and neutral oligosaccharides (OS) in individual cows during the first 60 h of colostrum production.
Variation in Acidic OS Production
Among the 24 acidic OS observed, 10 had the same composition as those of human milk OS (Table 1, various isomers at m/z 635, 878, 1000, and 1365). We identified the same acidic OS reported by Tao et al. (2009), but differences in the isomers for some OS were observed, illustrating the disparity in the total amount of acidic OS between the 2 studies. For example, Tao et al. (2009) found 2 isomers for the OS at m/z 1162, whereas we identified 3 isomers. Other anionic OS such as sulfated OS (Gopal and Gill, 2000) were not found in this study.
Table 1.
Acidic oligosaccharides in Holstein-Friesian colostrum1
| m/z (expt) | m/z (cal) | m/z (delta) | Oligosaccharide2
|
Retention time (min) | |||
|---|---|---|---|---|---|---|---|
| Hex | HexNAc | NeuAc | NeuGc | ||||
| 635.232 | 635.227 | 0.005 | 2 | 1 | 8.69 | ||
| 635.229 | 635.227 | 0.0023 | 2 | 1 | 21.41 | ||
| 651.224 | 651.222 | 0.0021 | 2 | 1 | 18.20 | ||
| 676.254 | 676.254 | 0 | 1 | 1 | 1 | 23.52 | |
| 676.254 | 676.254 | 0.0008 | 1 | 1 | 1 | 16.80 | |
| 676.256 | 676.254 | 0.0028 | 1 | 1 | 1 | 14.34 | |
| 692.250 | 696.249 | 0.0015 | 1 | 1 | 1 | 14.00 | |
| 797.277 | 797.280 | −0.0029 | 3 | 1 | 1 | 19.45 | |
| 797.278 | 797.280 | −0.0018 | 3 | 1 | 1 | 21.29 | |
| 838.307 | 838.307 | 0.0004 | 2 | 1 | 1 | 14.75 | |
| 838.308 | 838.307 | 0.0019 | 2 | 1 | 1 | 12.27 | |
| 1000.354 | 1000.359 | −0.0049 | 3 | 1 | 1 | 19.53 | |
| 1000.355 | 1000.359 | −0.0047 | 3 | 1 | 1 | 26.40 | |
| 1000.356 | 1000.359 | −0.0032 | 3 | 1 | 1 | 18.56 | |
| 1000.357 | 1000.359 | −0.0028 | 3 | 1 | 1 | 22.11 | |
| 1041.390 | 1041.386 | 0.0041 | 2 | 2 | 1 | 21.60 | |
| 1162.416 | 1162.412 | 0.0038 | 4 | 1 | 1 | 22.75 | |
| 1162.416 | 1162.412 | 0.0039 | 4 | 1 | 1 | 26.97 | |
| 1162.417 | 1162.412 | 0.0044 | 4 | 1 | 1 | 26.16 | |
| 1203.442 | 1203.439 | 0.0033 | 3 | 2 | 1 | 26.24 | |
| 1203.442 | 1203.439 | 0.0036 | 3 | 2 | 1 | 20.78 | |
| 1203.443 | 1203.439 | 0.0041 | 3 | 2 | 1 | 24.47 | |
| 1365.487 | 1365.492 | −0.0047 | 4 | 2 | 1 | 24.59 | |
| 1365.488 | 1365.492 | −0.0031 | 4 | 2 | 1 | 25.10 | |
Expt = experimental; cal = calculated; delta = difference between expt and cal masses.
Hex = hexose; HexNAc = N-acetylhexosamine; NeuAc = N-acetylneuraminic acid or sialic acid; NeuGc = N-glycolylneuraminic acid.
This study confirmed that SL is the major OS in bovine colostrum, with the isomer 3′-SL being more abundant than 6-sialyllactose (6′-SL; Martín-Sosa et al., 2003; Nakamura et al., 2003; McJarrow and van Amelsfort-Schoonbeek, 2004; Tao et al., 2009). Figure 3 shows an example of the separation of the 2 SL isomers. 3′-Sialyllactose has been shown to play an important role in inhibiting the binding of pathogenic bacteria to epithelial cells, thereby preventing microbial infection. Not only has it been shown that 3′-SL actively inhibit adhesion of H. pylori (the etiologic agent of gastritis) to host epithelial surfaces from in vitro studies, but 3′-SL promotes detachment of H. pylori from epithelial monolayers (Simon et al., 1997), demonstrating a possible therapeutic benefit for 3′-SL.
Figure 3.
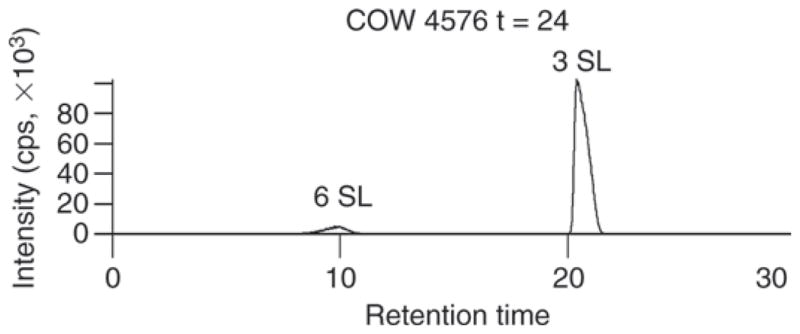
Extracted-ion chromatogram of ion m/z 636.23. Two sialyllactose (SL) isomers eluted at 8.0 min (α2–6 SL) and 21.0 min (α2–3 SL), respectively.
The highest individual cow variability in the amount of 3′-SL occurred at 0 h in the colostrum samples. Nakamura et al. (2003) also reported the highest variability in the amount of 3′-SL at 0 h, but in their study 3′-SL reached a steady level after 48 to 72 h. High variability in the amount of 3′-SL in the first milking was also reported by McJarrow and van Amelsfort-Schoonbeek (2004) for Friesian and Jersey cows. These differences may have been caused by individual cow variations. In the present work, we investigated SL variation by using the AUC method, which provides more accurate data than does peak intensity. In general, we observed a decrease in the production of 3′-SL in all cows over the 3 d of milking, the decrease being steeper in the first 12 to 24 h and remaining nearly constant thereafter (Figure 4).
Figure 4.
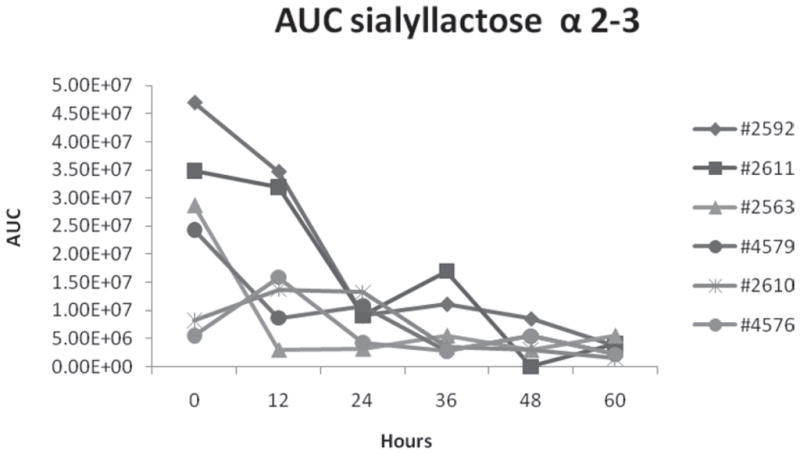
Area under the curve (AUC) distribution of 3′-sialyllactose (α2–3 SL) in individual cows during the first 60 h of colostrum production.
In contrast to the previously reported decrease during the first days of lactation (Nakamura et al., 2003; McJarrow and van Amelsfort-Schoonbeek, 2004), a new trend for 6′-SL was observed: 6′-SL was present at a low level at 0 h, then increased after 12 h, followed by a periodic oscillation every 24 h and lasting for 60 h (Figure 5). This behavior is highly unusual but was consistent for all the animals in the study. It has not been reported previously and its biological implications have yet to be established.
Figure 5.
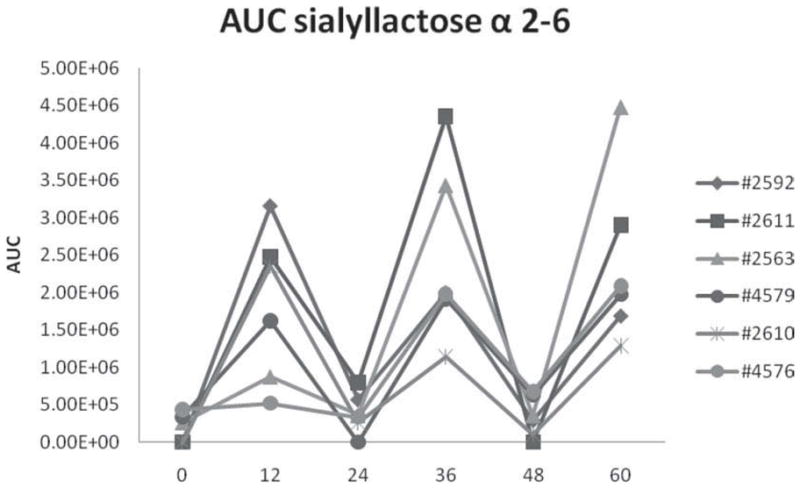
Area under the curve (AUC) distribution of 6′-sialyllactose (α2–6 SL) in individual cows during the first 60 h of colostrum production.
Variation in Neutral OS Production
It has been reported previously that neutral OS are present in trace amounts in bovine colostrums, whereas acidic OS (in particular SL) are the major components (Saito et al., 1984, 1987; Gopal and Gill, 2000; McJar-row and van Amelsfort-Schoonbeek, 2004). Our analysis of colostrum samples shows that many neutral OS and their isomers are present in relatively large amounts compared with SL.
Of the 16 neutral OS identified in the present work, 13 had the same compositions as human milk OS (various isomers of the OS with m/z 709, 750, 871, 912, and 1074; Table 2). Oligosaccharides with m/z 709, 871, and 1074 and their isomers were present in all samples at every milking. The remaining neutral OS at m/z 506 and m/z 547 and their isomers have not been detected in human milk, but they have been reported in other mammalian milks (Tao et al., 2008). As for the acidic OS, results in this work showed neutral OS with the same compositions as previously reported by Tao et al. (2009). However, major differences were observed in the isomers. For instance, Tao et al. (2009) detected a single isomer for the OS at m/z 709, whereas 4 isomers were observed in our study. Previously, one fucosylated OS was reported in bovine colostrum by Saito et al. (1987). However, no fucosylated free OS were found in the present study, or by Finke et al. (2000) and Tao et al. (2008, 2009) using more advanced methods.
Table 2.
Neutral oligosaccharides in Holstein-Friesian colostrum1
| m/z (expt) | m/z (cal) | m/z (delta) | Oligosaccharide2
|
Retention time (min) | |
|---|---|---|---|---|---|
| Hex | HexNAc | ||||
| 506.186 | 506.185 | 0.0012 | 3 | 12.99 | |
| 547.213 | 547.211 | 0.0015 | 2 | 1 | 13.75 |
| 547.213 | 547.211 | 0.0019 | 2 | 1 | 3.63 |
| 709.259 | 709.264 | −0.0049 | 3 | 1 | 25.10 |
| 709.261 | 709.264 | −0.0026 | 3 | 1 | 19.12 |
| 709.262 | 709.264 | −0.0021 | 3 | 1 | 15.51 |
| 709.265 | 709.264 | 0.0011 | 3 | 1 | 13.22 |
| 750.289 | 750.291 | −0.0018 | 2 | 2 | 12.64 |
| 750.289 | 750.291 | −0.0013 | 2 | 2 | 13.21 |
| 750.290 | 750.291 | −0.0003 | 2 | 2 | 11.66 |
| 871.314 | 871.317 | −0.003 | 4 | 1 | 18.39 |
| 871.316 | 871.317 | −0.0003 | 4 | 1 | 15.52 |
| 912.345 | 912.343 | 0.0013 | 3 | 2 | 15.31 |
| 912.3459 | 912.343 | 0.0025 | 3 | 2 | 14.18 |
| 1074.398 | 1074.396 | 0.0014 | 4 | 2 | 15.49 |
| 1074.401 | 1074.396 | 0.0045 | 4 | 2 | 19.06 |
Expt = experimental; cal = calculated; delta = difference between expt and cal masses.
Hex = hexose; HexNAc = N-acetylhexosamine.
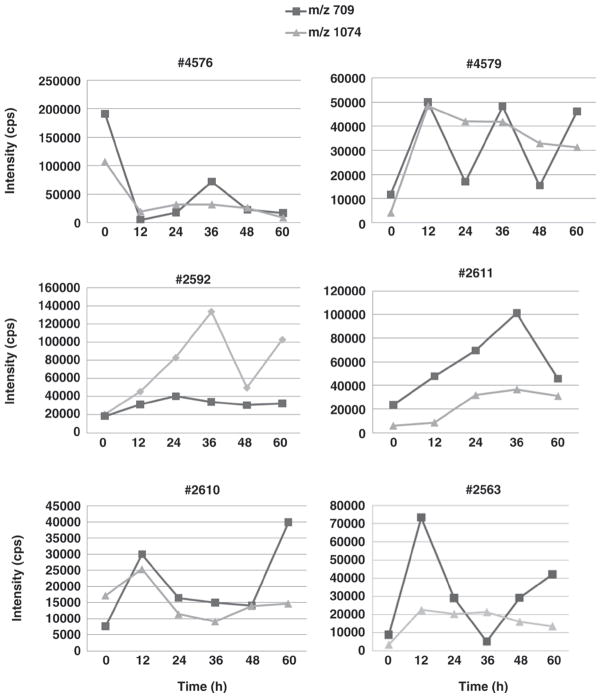
N-Acetylhexosamine is well known as a component of the so-called bifidus factor (Gyorgy et al., 1954, 1974). Of the colostrum samples analyzed in the present work, 85% contained HexNAc. Two abundant neutral OS, with composition 3 Hex and 1 HexNAc (m/z 709) and 4 Hex and 2 HexNAc (m/z 1074) are of particular interest. These 2 OS, with a degree of polymerization <7, are among the few OS that have been proven to be preferentially consumed by some Bifidobacterium strains exerting a specific in vitro prebiotic activity (LoCascio et al., 2007). Interestingly, these OS were present not only in the first milking, but also during the first 3 d of colostrum production. Of the colostrum samples analyzed, 23% had m/z 709 as the second most abundant OS after sialyllactose, whereas 26.5% of samples had m/z 1074 as the third most abundant OS. It was not possible to observe a clear trend of increase or decrease in these 2 OS because their relative abundances varied significantly between individual animals and milking times (Figure 6). Because these OS are present in significant amounts during the first 3 d of lactation and are present in transitional and mature milk (Tao et al., 2009), these milk components may have important biological functions.
Figure 6.
Distribution of 2 neutral N-acetylhexosamine (HexNAc)-containing oligosaccharides from individual cows during the first 60 h of colostrum production. The sample from cow #2611 at 48 h was excluded from the study because of the presence of contaminants.
The high sensitivity and resolution of the analytical technique employed in this work made it possible to monitor all OS species (neutral + acidic) comprehensively, providing a composite picture of OS profile during the first 3 d of lactation. A total of 40 OS were detected, of which 16 were neutral and 24 acidic. The study confirmed that 3′-SL is the most abundant OS in bovine colostrum. In contrast to previous studies that suggested a rapid decrease in neutral OS in colostrum, we were able to detect many neutral OS present in significant amounts, even on d 3 of lactation, such as those having m/z 871 (composition 3 Hex and 1 Hex-NAc) and m/z 709 (3 Hex and 2 HexNAc) that were, respectively, the second most abundant OS in several samples.
The study showed that colostrum might be an ideal source of OS for food applications and for studying the relationship between structure and biological function of milk OS. Furthermore, significant variation in terms of profile and relative abundance of OS among cows suggests the presence of individual animal variation. Such variation could be caused by genetic factors because external factors such as nutrition, lactation number, and accommodation were the same for all cows.
Data from this investigation revealed that colostrums from Holstein-Friesian cows are potentially an ideal and rich source of neutral and acidic OS. Addition of these compounds to foods and supplements would provide a cocktail of OS with health-promoting benefits such as prebiotic activity for the growth of beneficial bifidobacteria in the gastrointestinal tract and prevention of gut infections.
Acknowledgments
This project was supported by the University of California Discovery Program (05GEB01NHB), the National Institute of Environmental Health Sciences (P42ES004699), the California Dairy Research Foundation (09-001430), and the CHARGE study (P01 ES11269). The content is solely the responsibility of the authors and does not necessarily represent the official views of the National Institute of Environmental Health Sciences or the National Institutes of Health. The authors acknowledge editorial assistance from Cora J. Dillard.
Footnotes
Publisher's Disclaimer: This is a PDF file of an unedited manuscript that has been accepted for publication. As a service to our customers we are providing this early version of the manuscript. The manuscript will undergo copyediting, typesetting, and review of the resulting proof before it is published in its final citable form. Please note that during the production process errors may be discovered which could affect the content, and all legal disclaimers that apply to the journal pertain.
References
- Boehm G, Stahl B. Oligosaccharides from milk. J Nutr. 2007;137(Suppl 2):847S–849S. doi: 10.1093/jn/137.3.847S. [DOI] [PubMed] [Google Scholar]
- Coppa GV, Bruni S, Morelli L, Soldi S, Gabrielli O. The first prebiotics in humans: Human milk oligosaccharides. J Clin Gastroenterol. 2004;38:80S–83S. doi: 10.1097/01.mcg.0000128926.14285.25. [DOI] [PubMed] [Google Scholar]
- Finke B, Mank M, Daniel H, Stahl B. Offline coupling of low-pressure anion-exchange chromatography with MALDI-MS to determine the elution order of human milk oligosaccharides. Anal Biochem. 2000;284:256–265. doi: 10.1006/abio.2000.4680. [DOI] [PubMed] [Google Scholar]
- Gopal PK, Gill HS. Oligosaccharides and glycoconjugates in bovine milk and colostrum. Br J Nutr. 2000;84(Suppl 1):69S–74S. doi: 10.1017/s0007114500002270. [DOI] [PubMed] [Google Scholar]
- Gyorgy P, Jeanloz RW, von Nicolai H, Zilliken F. Undialyzable growth factors for Lactobacillus bifidus var. pennsylvanicus. Protective effect of sialic acid bound to glycoproteins and oligosaccharides against bacterial degradation. Eur J Biochem. 1974;43:29–33. doi: 10.1111/j.1432-1033.1974.tb03380.x. [DOI] [PubMed] [Google Scholar]
- Gyorgy P, Norris RF, Rose CS. Bifidus factor. I. A variant of Lactobacillus bifidus requiring a special growth factor. Arch Biochem Biophys. 1954;48:193–201. doi: 10.1016/0003-9861(54)90323-9. [DOI] [PubMed] [Google Scholar]
- LoCascio RG, Ninonuevo MR, Freeman SL, Sela DA, Grimm R, Lebrilla CB, Mills DA, German JB. Glycoprofiling of bifidobacterial consumption of human milk oligosaccharides demonstrates strain specific, preferential consumption of small chain glycans secreted in early human lactation. J Agric Food Chem. 2007;55:8914–8919. doi: 10.1021/jf0710480. [DOI] [PubMed] [Google Scholar]
- Martín-Sosa S, Martín MJ, García-Pardo LA, Hueso P. Sialyloligosaccharides in human and bovine milk and in infant formulas: Variations with the progression of lactation. J Dairy Sci. 2003;86:52–59. doi: 10.3168/jds.S0022-0302(03)73583-8. [DOI] [PubMed] [Google Scholar]
- Martinez-Ferez A, Rudloff S, Guadix A, Henkel CA, Pohletz G, Boza JJ, Guaddix EM, Kunz C. Goats’ milk as a natural source of lactose-derived oligosaccharides: Isolation by membrane technology. Int Dairy J. 2006;16:173–181. [Google Scholar]
- McJarrow P, van Amelsfort-Schoonbeek J. Bovine sialyl oligosaccharides: seasonal variations in their concentrations in milk, and a comparison of the colostrums of Jersey and Friesian cows. Int Dairy J. 2004;14:571–579. [Google Scholar]
- Nakamura T, Kawase H, Kimura K, Watanabe Y, Ohtani M, Arai I, Urashima T. Concentrations of sialyloligosaccharides in bovine colostrum and milk during the prepartum and early lactation. J Dairy Sci. 2003;86:1315–1320. doi: 10.3168/jds.S0022-0302(03)73715-1. [DOI] [PubMed] [Google Scholar]
- Ninonuevo MR, Park Y, Yin H, Zhang J, Ward RE, Clowers BH, German JB, Freeman SL, Killeen K, Grimm R, Lebrilla CB. A strategy for annotating the humane milk glycome. J Agric Food Chem. 2006;54:7471–7480. doi: 10.1021/jf0615810. [DOI] [PubMed] [Google Scholar]
- Pacitti AF, Gentsch JR. Inhibition of reovirus type 3 binding to host cells by sialylated glycoproteins is mediated through the viral attachment protein. J Virol. 1987;61:1407–1415. doi: 10.1128/jvi.61.5.1407-1415.1987. [DOI] [PMC free article] [PubMed] [Google Scholar]
- Rees DI, Sabia JJ. The effect of breast feeding on educational attainment: Evidence from sibling data. J Hum Capital. 2009;3:43–72. [Google Scholar]
- Rolsma MD, Kuhlenschmidt TB, Gelberg HB, Kuhlenschmidt MS. Structure and function of a ganglioside receptor for porcine rotavirus. J Virol. 1998;72:9079–9091. doi: 10.1128/jvi.72.11.9079-9091.1998. [DOI] [PMC free article] [PubMed] [Google Scholar]
- Saito T, Itoh T, Adachi S. Presence of two neutral disaccharides containing N- acetylhexosamine in bovine colostrum as free forms. Biochim Biophys Acta. 1984;801:147–150. doi: 10.1016/0304-4165(84)90223-x. [DOI] [PubMed] [Google Scholar]
- Saito T, Itoh T, Adachi S. Chemical structure of three neutral trisaccharides isolated in free form from bovine colostrum. Carbohydr Res. 1987;165:43–51. doi: 10.1016/0008-6215(87)80076-9. [DOI] [PubMed] [Google Scholar]
- Simon PM, Goode PL, Mobasseri A, Zopf D. Inhibition of Helicobacter pylori binding to gastrointestinal epithelial cells by sialic acid-containing oligosaccharides. Infect Immun. 1997;65:750–757. doi: 10.1128/iai.65.2.750-757.1997. [DOI] [PMC free article] [PubMed] [Google Scholar]
- Tao N, DePeters EJ, German JB, Grimm R, Lebrilla CB. Variations in bovine milk oligosaccharides during early and middle lactation stages analyzed by high-performance liquid chromatography-chip/mass spectrometry. J Dairy Sci. 2009;92:2991–3001. doi: 10.3168/jds.2008-1642. [DOI] [PubMed] [Google Scholar]
- Tao N, DePeters EJ, Freeman S, German JB, Grimm R, Lebrilla CB. Bovine milk glycome. J Dairy Sci. 2008;91:3768–3778. doi: 10.3168/jds.2008-1305. [DOI] [PubMed] [Google Scholar]
- Wang B, Yu B, Karim M, Hu H, Sun Y, McGreevy P, Petocz P, Held S, Brand-Miller J. Dietary sialic acid supplementation improves learning and memory in piglets. Am J Clin Nutr. 2007;85:561–569. doi: 10.1093/ajcn/85.2.561. [DOI] [PubMed] [Google Scholar]


