Abstract
The structural analysis of sulfated carbohydrates such as glycosaminoglycans (GAGs) has been a longstanding challenge for the field of mass spectrometry. The dissociation of sulfated carbohydrates by collisionally activated dissociation (CAD) or infrared multiphoton dissociation (IRMPD), which activate ions via vibrational excitation, typically result in few cleavages and abundant SO3 loss for highly sulfated GAGs such as heparin and heparan sulfate, hampering efforts to determine sites of modification. The recent application of electron activation techniques, specifically electron capture dissociation (ECD) and electron detachment dissociation (EDD), provides a marked improvement for the mass spectrometry characterization of GAGs. In this work, we compare ECD, EDD, and IRMPD for the dissociation of the highly sulfated carbohydrate sucrose octasulfate (SOS). Both positive and negative multiply-charged ions are investigated. ECD, EDD, and IRMPD of SOS produce abundant and reproducible fragmentation. The product ions produced by ECD are quite different than those produced by IRMPD of SOS positive ions, suggesting different dissociation mechanisms as a result of electronic versus vibrational excitation. The product ions produced by EDD and IRMPD of SOS negative ions also differ from each other. Evidence for SO3 rearrangement exists in the negative ion IRMPD data, complicating the assignment of product ions.
INTRODUCTION
The structural characterization of sulfated carbohydrates such as glycosaminoglycans (GAGs) has been a longstanding problem for mass spectrometry. Sulfate half-ester modifications in carbohydrates are labile and difficult to characterize by tandem mass spectrometry. A number of mass spectrometry and tandem mass spectrometry techniques have been developed for the analysis of this class of molecules.1–23 The challenge of determining sites of modification in GAGs by tandem mass spectrometry is to produce abundant glycosidic and cross-ring fragmentation without loss of the labile sulfate group, a challenge similar to determining sites of post translational modification on proteins. The development of electron capture dissociation (ECD)24, and its negative ion complement electron detachment dissociation (EDD)25, has greatly increased the analytical utility of tandem mass spectrometry for characterizing labile modifications in biomolecules.
Recently, we have reported the utility and application of EDD for the structural analysis of GAGs.26 EDD has been shown to be a powerful tool for determining the sites of modification of GAGs ranging in size from tetrasaccharides to decasaccharides.27 EDD can also distinguish iduronic acid from glucuronic acid in GAG tetrasaccharides based on the presence of key product ions.28 ECD has been shown to be useful for determining sites of post-translational modification in peptides and proteins, including sulfation.29–34 However, ECD requires multiply-charged positive precursor ions, which are often difficult to produce from highly acidic molecules such as GAGs. In order to form multiply-charged positive ions suitable for analysis by ECD, carbohydrates have been complexed with divalent metal ions.35 However, multiply-charged positive ions can also be produced with monovalent cations such as sodium. In this work we make a comparison of ECD and EDD for the model sulfated disaccharide, sucrose octasulfate (SOS), which can form both positive and negative multiply-charged ions. In addition, we compare these data with those obtained by infrared multiphoton dissociation (IRMPD) of the same precursors.
MATERIALS AND METHODS
Pharmaceutical purity sucrose octasulfate (sodium salt) was a gift from Bukh Meditec (Farum, Denmark). Experiments were performed with a 9.4 T Bruker Apex IV QhFTMS (Billerica, MA) fitted with an Apollo II dual source, a 25 W CO2 laser (Synrad model J48-2, Mukilteo, WA) for IRMPD, and an indirectly heated hollow cathode for generating electrons for ECD and EDD. For positive ion analyses, SOS was diluted to a concentration of 1 mg/mL in 50:50 methanol:H2O (Sigma, St. Louis, MO). For negative ion analyses, SOS was diluted to a concentration of 0.025 mg/mL in 50:50 methanol:H2O (Sigma, St. Louis, MO). All samples were analyzed using ESI at an infusion rate of 2 μL/min. For ECD, EDD, and IRMPD experiments, multiply-charged precursor ions were selected in the external quadrupole and stored in the external hexapole for 1 – 6 seconds before injection into the FTMS analyzer. For ECD, the multiply-charged precursor ions were irradiated for 0.05 seconds with the cathode set to −1.5 V, the ECD lens was set to 15 V, and the heater current was set to 1.5 A. For EDD, the multiply-charged precursor ions were irradiated for 1 second with the cathode set to −19 V, the ECD Lens set to −19±0.5 V, and the heater current set to 1.5 A. For IRMPD experiments, conditions were similar to the ECD/EDD experiments but the electron pulse was replaced with the laser pulse. For IRMPD, ions were irradiated for 0.01 – 0.2 seconds with beam attenuation set to pass from 40 – 60% of full power. Ions were excited with an RF frequency chirp that covered the range m/z 100 – 2000. 24 acquisitions were coadded for each mass spectrum. 512K points were acquired at a 2.4 MHz digitization rate, padded with one zero fill, and apodized using a sinebell window. For the work presented here, fragmentation of the tetrasaccharides is presented using the Domon and Costello annotation.36
RESULTS AND DISCUSSION
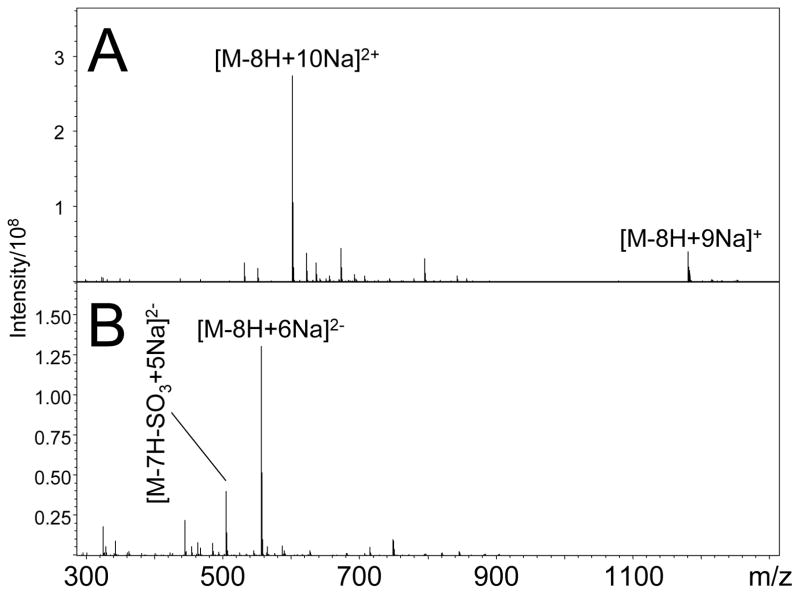
SOS contains eight acidic sulfate half-esters. While this highly acidic molecule readily forms multiply-charged negative ions,7 the formation of positive ions requires cationization, for example by using sodium as a counter ion for the sulfate groups. With all eight sulfate groups ion cationized by sodium ions, the doubly-charged species of SOS, [M-8H+10Na]2+, is observed as shown in Figure 1A. Using a more dilute sample, SOS forms the multiply-charged negative ion [M-8H+6Na]2−, as shown in Figure 1B. The use of sodiated SOS allows the production of both multiply-charged positive and negative ions for tandem mass spectrometry experiments.
Figure 1.
ESI-FTICR mass spectra of SOS in (A) positive ion mode and (B) negative ion mode. Sodium allows abundant multiply-charged precursor ions to be produced by both positive and negative ionization.
IRMPD and ECD of SOS Positive Ions
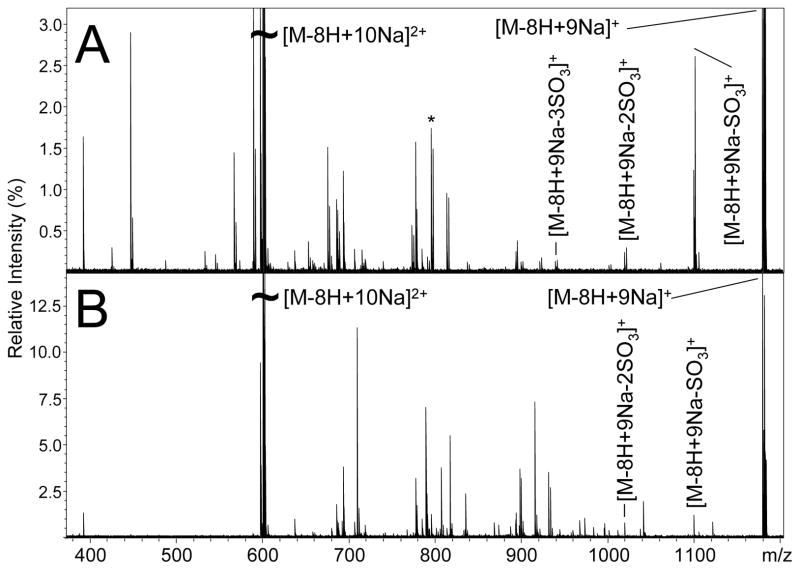
IRMPD of the [M-8H+10Na]2+ precursor ion of SOS produces the mass spectrum shown in Figure 2A (peak list and intensities available in supplemental data). IRMPD produces only singly-charged even-electron product ions, as shown in Figure 2A. The most abundant product is the ion at m/z 1180.626, resulting from loss of Na+ from the precursor to yield [M-8H+9Na]+. The peaks at m/z 1100.659, 1020.701, and 940.749 differ from the [M-8H+9Na]+ product ion by multiples of the exact mass of SO3, 79.956 u, indicating loss of up to 3 equivalents of SO3.
Figure 2.
Tandem mass spectra of the [M-8H+10Na]2+ precursor ion of SOS produced by (A) IRMPD and (B) ECD.
Other peaks in the IRMPD mass spectrum are difficult to assign, and do not seem to correspond to common glycosidic or cross-ring cleavage products. The IRMPD mass spectrum was internally calibrated from the assignable peaks mentioned above to provide mass accuracy better than 2 ppm. Many products in the IRMPD mass spectrum cannot be assigned even with accurate mass data. In an attempt to identify the observed products, the m/z value were calculated for cross-ring cleavages that have been observed in tandem mass spectra of glycosaminoglycan oligosaccharides, and the values were compared to the data from the IRMPD mass spectrum, but none of these calculated products were observed. For example, the peak at m/z 796.704 (indicated by the asterisk over the peak in Figure 2A) cannot be assigned as the 0.3X1-SO3 cleavage (theoretical m/z = 796.731) due to the large mass error of 35 ppm, well outside the mass accuracy of 2 ppm expected for an internal calibration. Similarly, the products at m/z 590.716, 568.734, and 546.751 were tentatively identified as B1/Y1, B1/Y1-Na, and B1/Y1-2Na, respectively, prior to internal calibration. However, attempts to use any of these products for internal calibration resulted in large mass calibration errors indicating that these are not arising from the expected glycosidic cleavages. Despite the small number of identified products, a number of patterns exist in the IRMPD data. Many of the product ions in the IRMPD mass spectrum differ by the exact mass of SO3, resulting from the sequential loss of this labile group. Also, a number of peaks in the IRMPD mass spectrum differ by 21.982 u, implying Na/H heterogeneity in the product ions. These products are unusual because all ionizable hydrogen atoms have been replaced by sodium atoms in solution. Therefore, these peaks indicate that Na/H exchange occurs at carbon-hydrogen bonds during fragmentation.
The ECD mass spectrum of the [M-8H+10Na]2+ precursor ion of SOS is shown in Figure 2B (peak list and intensities available in supplemental data). Predominantly singly-charged even-electron product ions are observed, but three odd-electron singly-charged products are also observed. Similar to IRMPD of the same precursor ion, the [M-8H+9Na]+ ion is the most abundant product, and is accompanied by peaks resulting from the loss of up to two SO3 moieties. Interestingly, the charge-reduced precursor ion ([M-8H+10Na]+•) is not observed. The ECD mass spectrum was internally calibrated on the precursor and confidently assigned product ions (e.g. the precursor ion, charge reduced species, and the charge reduced species minus SO3) and resulted in mass accuracies ≤0.5 ppm. However, aside from the product ions used for internal calibration, no other products in the ECD mass spectrum could be assigned using accurate mass measurement. For example, the abundant product ion at m/z 710.665 falls close in mass to a 0,2X1 product, but can be discounted as this product due to the large difference between measured and calculated values (calculated m/z = 710.793), which differ by ~180 ppm.
Many of the peaks in the ECD mass spectrum are not observed in the IRMPD mass spectrum. For example, aside from the [M-8H+9Na]+ and its satellites resulting from SO3 loss, only 3 other product ions are common to both mass spectra. Differences are also observed in product ions accompanied by SO3 loss and Na/H heterogeneity. For example, abundant SO3 loss accompanies many peaks in the IRMPD mass spectrum, but only two products in the ECD mass spectrum have accompanying peaks from SO3 loss. Also, while abundant Na/H heterogeneity is observed in the IRMPD mass spectrum, in the form of peaks with mass differences of 21.982 u, this mass spacing between product ions is not observed in the ECD mass spectrum. It is important to note that while many of the ECD product ions cannot be assigned to common glycosidic or cross-ring cleavages, the ECD mass spectra are very reproducible and produce identical tandem mass spectra for data acquired months apart. This suggests that the ECD fragmentation of SOS is not random, but rather occurs by some specific mechanisms that are yet unreported for saccharides.
IRMPD and EDD of SOS Negative Ions
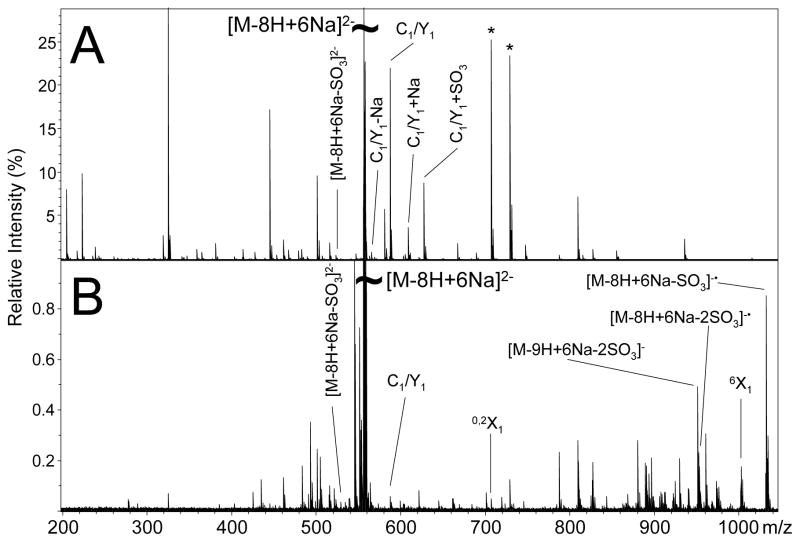
IRMPD of the [M-8H+6Na]2− precursor ion of SOS produces the mass spectrum shown in Figure 3A (peak list and intensities available in supplemental data). Predominantly singly-charged product ions are observed, and no odd-electron products are observed. The only doubly-charged product ion that is observed is [M-8H+6Na-SO3]2−, which occurs with low abundance. Aside from loss of SO3 from the precursor ion, the only peak that can be assigned to expected cleavages is the isobaric C1/Y1 glycosidic cleavage product at m/z 586.811. This product ion is accompanied by product ions that differ by the addition or loss of sodium (m/z 608.794 and 564.829, respectively), and a product that differs by the addition of SO3 at m/z 666.769. This latter peak is unusual in that it indicates the possibility of SO3 rearrangement occurring as a result of ion activation and subsequent fragmentation. Such SO3 migrations have been reported before for singly-charged chondroitin sulfate anions,19 and may be a cause of the difficulty in assigning products.
Figure 3.
Tandem mass spectra of the [M-8H+6Na]2− precursor ion of SOS obtained by (A) IRMPD and (B) EDD.
Neither the isobaric B1/Y1 glycosidic cleavage, nor any products ions differing by Na/H heterogeneity or SO3 loss accompanying the B1/Y1 glycosidic cleavage, are observed in the IRMPD spectrum of the dianion. In contrast to IRMPD of the [M-8H+10Na]2+ precursor ion of SOS, IRMPD of the [M-8H+6Na]2− precursor ion produces many low abundance product ions. Very few product ions differ by 79.956 u, suggesting that SO3 loss is not a significant process for negative ions of SOS. This latter observation is consistent with findings for GAG anions in which ionizable protons have been replaced by sodium.37 Similar to the IRMPD of the [M-8H+10Na]2+ precursor ion of SOS, IRMPD of the [M-8H+6Na]2− precursor ion produces a number of product ions separated by 21.982 u. For example, the products at m/z 706.761 and m/z 728.744, indicated by the asterisk over the peaks in Figure 3A are a result of Na/H heterogeneity in the IRMPD mass spectrum. The Na/H heterogeneity in the negative ion IRMPD mass spectrum indicates sodium replacing hydrogen in a carbon-hydrogen bond, similar to the trend observed in the positive ion IRMPD mass spectrum of SOS. The reduced number of product ions and product ions accompanied by the loss of SO3 or sodium suggests that the negative ion form of SOS is more stable than the positive ion and therefore is less likely to undergo fragmentation by vibrational excitation.
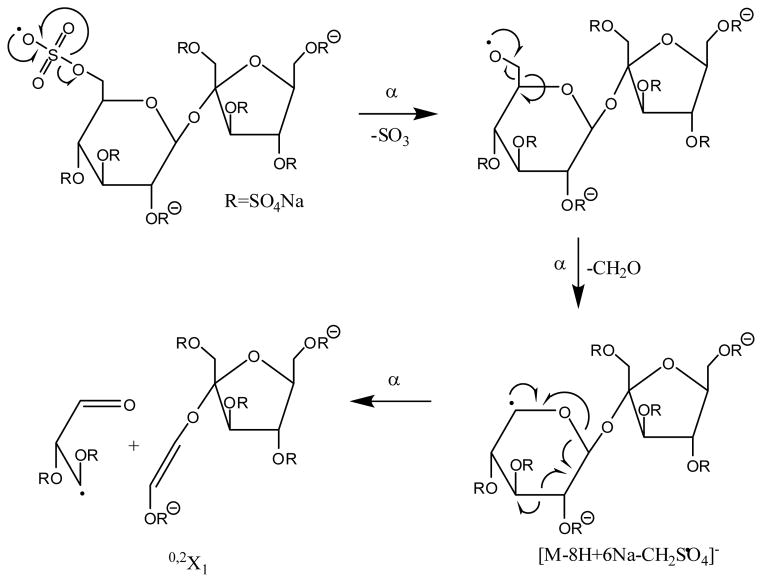
EDD of the [M-8H+6Na]2− product ion of SOS is shown in Figure 3B (peak list and intensities available in supplemental data). Abundant fragmentation is observed in the form of even- and odd-electron ions. No charge-reduced species is observed, but the charge-reduced species minus one or two SO3 molecules are observed at m/z 1031.692 and 951.732, respectively. Unlike IRMPD of the [M-8H+6Na]2− precursor ion of SOS, a number of product ions can be assigned in the EDD mass spectrum other than the charge-reduced species. For example, the peak at m/z 586.810 can the isobaric C1/Y1 glycosidic cleavage. However, unlike the negative ion IRMPD spectrum, the C1/Y1 glycosidic cleavage is not accompanied by product ions that differ by the mass of sodium or SO3. We have previously proposed that the initial formation of the radical site during EDD occurs at a site of negative charge.26 For SOS, the radical site will form at one of the eight sulfate groups. The peak at m/z 1001.682 corresponds to the loss of CH2SO4 from the precursor ion, a product that may form due to the loss of the C6 carbon and sulfate group from radical rearrangement, as proposed in Scheme 1. Further fragmentation of this product will yield the 0,2X1 cleavage at m/z 706.762, also shown in Scheme 1. Comparison of product ions observed in the EDD and negative ion IRMPD mass spectra indicate that very few product ions are common to both mass spectra, similar to the observation for the positive ion tandem mass spectra.
scheme 1.
CONCLUSIONS
ECD, EDD, and IRMPD have been used to dissociate the highly sulfated molecule SOS. Despite the abundant and reproducible fragmentation resulting from these dissociation methods, very few product ions can be assigned to expected glycosidic or cross-ring cleavages. However, a number of interesting features are produced by these dissociation methods. For example, Na/H heterogeneity with nonionizable hydrogen atoms is observed in both positive and negative ion IRMPD and ECD tandem mass spectra, but not in the EDD mass spectra. There is also evidence of SO3 migration in the IRMPD mass spectrum of the doubly-charged anion of SOS. Because of the abundance of unidentified product ions differing by the exact mass of SO3 for all dissociation methods, it is possible that significant SO3 rearrangement is occurring during dissociation.
Supplementary Material
References
- 1.Budnik BA, Haselmann KF, Elkin YN, Gorbach VI, Zubarev RA. Applications of electron-ion dissociation reactions for analysis of polycationic chitooligosaccharides in Fourier transform mass spectrometry. Anal Chem. 2003;75:5994–6001. doi: 10.1021/ac034477f. [DOI] [PubMed] [Google Scholar]
- 2.Carr SA, Reinhold VN. Structural characterization of sulfated glycosaminoglycans by fast atom bombardment mass-spectrometry - application to chondroitin sulfate. J Carbohydr Chem. 1984;3:381–401. doi: 10.1080/07328308408057904. [DOI] [PubMed] [Google Scholar]
- 3.Chi LL, Amster J, Linhardt RJ. Mass spectrometry for the analysis of highly charged sulfated carbohydrates. Curr Anal Chem. 2005;1:223–240. doi: 10.2174/157341105774573929. [DOI] [PMC free article] [PubMed] [Google Scholar]
- 4.Dai Y, Whittal RM, Bridges CA, Isogai Y, Hindsgaul O, Li L. Matrix-assisted laser desorption ionization mass spectrometry for the analysis of monosulfated oligosaccharides. Carbohydr Res. 1997;304:1–9. doi: 10.1016/S0008-6215(97)00195-X. [DOI] [PubMed] [Google Scholar]
- 5.Juhasz P, Biemann K. Utility of non-covalent complexes in the matrix-assisted laser desorption ionization mass spectrometry of heparin-derived oligosaccharides. Carbohydr Res. 1995;270:131–147. doi: 10.1016/0008-6215(94)00012-5. [DOI] [PubMed] [Google Scholar]
- 6.Miller MJC, Costello CE, Malmstrom A, Zaia J. A tandem mass spectrometric approach to determination of chondroitin/dermatan sulfate oligosaccharide glycoforms. Glycobiology. 2006;16:502–513. doi: 10.1093/glycob/cwj093. [DOI] [PMC free article] [PubMed] [Google Scholar]
- 7.Naggar EF, Costello CE, Zaia J. Competing fragmentation processes in tandem mass spectrometry of heparin-like glycosaminoglycans. J Am Soc Mass Spectrom. 2004;15:1534–1544. doi: 10.1016/j.jasms.2004.06.019. [DOI] [PubMed] [Google Scholar]
- 8.Reinhold VN, Carr SA, Green BN, Petitou M, Choay J, Sinay P. Structural characterization of sulfated glycosaminoglycans by fast-atom-bombardment mass-spectrometry - application to heparin fragments prepared by chemical synthesis. Carbohydr Res. 1987;161:305–313. doi: 10.1016/S0008-6215(00)90088-0. [DOI] [PubMed] [Google Scholar]
- 9.Saad OM, Leary JA. Compositional analysis and quantification of heparin and heparan sulfate by electrospray ionization ion trap mass spectrometry. Anal Chem. 2003;75:2985–2995. doi: 10.1021/ac0340455. [DOI] [PubMed] [Google Scholar]
- 10.Saad OM, Leary JA. Delineating mechanisms of dissociation for isomeric heparin disaccharides using isotope labeling and ion trap tandem mass spectrometry. J Am Soc Mass Spectrom. 2004;15:1274–1286. doi: 10.1016/j.jasms.2004.05.008. [DOI] [PubMed] [Google Scholar]
- 11.Saad OM, Leary JA. Heparin sequencing using enzymatic digestion and ESI-MS with host: A heparin/HS oligosaccharide sequencing tool. Anal Chem. 2005;77:5902–5911. doi: 10.1021/ac050793d. [DOI] [PubMed] [Google Scholar]
- 12.Takagaki K, Kojima K, Majima M, Nakamura T, Kato I, Endo M. Ion-spray mass-spectrometric analysis of glycosaminoglycan oligosaccharides. Glycoconjugate J. 1992;9:174–179. doi: 10.1007/BF00731162. [DOI] [PubMed] [Google Scholar]
- 13.Viseux N, De Hoffmann E, Domon B. Structural assignment of permethylated oligosaccharide subunits using sequential tandem mass spectrometry. Anal Chem. 1998;70:4951–4959. doi: 10.1021/ac980443+. [DOI] [PubMed] [Google Scholar]
- 14.Zaia J, Costello CE. Tandem mass spectrometry of sulfated heparin-like glycosaminoglycan oligosaccharides. Anal Chem. 2003;75:2445–2455. doi: 10.1021/ac0263418. [DOI] [PubMed] [Google Scholar]
- 15.Zaia J, Li XQ, Chan SY, Costello CE. Tandem mass spectrometric strategies for determination of sulfation positions and uronic acid epimerization in chondroitin sulfate oligosaccharides. J Am Soc Mass Spectrom. 2003;14:1270–1281. doi: 10.1016/S1044-0305(03)00541-5. [DOI] [PubMed] [Google Scholar]
- 16.Zaia J, Mcclellan JE, Costello CE. Tandem mass spectrometric determination of the 4S/6S sulfation sequence in chondroitin sulfate oligosaccharides. Anal Chem. 2001;73:6030–6039. doi: 10.1021/ac015577t. [DOI] [PubMed] [Google Scholar]
- 17.Zamfir A, Seidler DG, Kresse H, Peter-Katalinic J. Structural characterization of chondroitin/dermatan sulfate oligosaccharides from bovine aorta by capillary electrophoresis and electrospray ionization quadrupole time-of-flight tandem mass spectrometry. Rapid Commun Mass Spectrom. 2002;16:2015–2024. doi: 10.1002/rcm.820. [DOI] [PubMed] [Google Scholar]
- 18.Zhang Z, Xie J, Liu J, Linhardt RJ. Tandem MS can distinguish hyaluronic acid from N-acetylheparosan. J Am Soc Mass Spectrom. 2008;19:82–90. doi: 10.1016/j.jasms.2007.10.012. [DOI] [PMC free article] [PubMed] [Google Scholar]
- 19.Mcclellan JE, Costello CE, O’connor PB, Zaia J. Influence of charge state on product ion mass spectra and the determination of 4S/6S sulfation sequence of chondroitin sulfate oligosaccharides. Anal Chem. 2002;74:3760–3771. doi: 10.1021/ac025506+. [DOI] [PubMed] [Google Scholar]
- 20.Desaire H, Leary JA. Detection and quantification of the sulfated disaccharides in chondroitin sulfate by electrospray tandem mass spectrometry. J Am Soc Mass Spectrom. 2000;11:916–920. doi: 10.1016/S1044-0305(00)00168-9. [DOI] [PubMed] [Google Scholar]
- 21.Desaire H, Sirich TL, Leary JA. Evidence of block and randomly sequenced chondroitin polysaccharides: Sequential enzymatic digestion and quantification using ion trap tandem mass spectrometry. Anal Chem. 2001;73:3513–3520. doi: 10.1021/ac010385j. [DOI] [PubMed] [Google Scholar]
- 22.Laremore TN, Murugesan S, Park TJ, Avci FY, Zagorevski DV, Linhardt RJ. Matrix-assisted laser desorption/ionization mass spectrometric analysis of uncomplexed highly sulfated oligosaccharides using ionic liquid matrices. Anal Chem. 2006;78:1774–1779. doi: 10.1021/ac051121q. [DOI] [PMC free article] [PubMed] [Google Scholar]
- 23.Laremore TN, Zhang FM, Linhardt RJ. Ionic liquid matrix for direct UV-MALDI-TOF-MS analysis of dermatan sulfate and chondroitin sulfate oligosaccharides. Anal Chem. 2007;79:1604–1610. doi: 10.1021/ac061688m. [DOI] [PMC free article] [PubMed] [Google Scholar]
- 24.Zubarev RA, Kelleher NL, Mclafferty FW. Electron capture dissociation of multiply charged protein cations. A nonergodic process. J Am Chem Soc. 1998;120:3265–3266. doi: 10.1021/ja973478k. [DOI] [Google Scholar]
- 25.Budnik BA, Haselmann KF, Zubarev RA. Electron detachment dissociation of peptide di-anions: An electron-hole recombination phenomenon. Chem Phys Lett. 2001;342:299–302. doi: 10.1016/S0009-2614(01)00501-2. [DOI] [Google Scholar]
- 26.Wolff JJ, Amster IJ, Chi L, Linhardt RJ. Electron detachment dissociation of glycosaminoglycan tetrasaccharides. J Am Soc Mass Spectrom. 2007;18:234–244. doi: 10.1016/j.jasms.2006.09.020. [DOI] [PMC free article] [PubMed] [Google Scholar]
- 27.Wolff JJ, Laremore TN, Busch AM, Linhardt RJ, Amster IJ. Electron detachment dissociation of dermatan sulfate oligosaccharides. J Am Soc Mass Spectrom. 2008;19:294–304. doi: 10.1016/j.jasms.2007.10.007. [DOI] [PMC free article] [PubMed] [Google Scholar]
- 28.Wolff JJ, Chi LL, Linhardt RJ, Amster IJ. Distinguishing glucuronic from iduronic acid in glycosaminoglycan tetrasaccharides by using electron detachment dissociation. Anal Chem. 2007;79:2015–2022. doi: 10.1021/ac061636x. [DOI] [PMC free article] [PubMed] [Google Scholar]
- 29.Hakansson K, Cooper HJ, Emmett MR, Costello CE, Marshall AG, Nilsson CL. Electron capture dissociation and infrared multiphoton dissociation MS/MS of an N-glycosylated tryptic peptide to yield complementary sequence information. Anal Chem. 2001;73:4530–4536. doi: 10.1021/ac0103470. [DOI] [PubMed] [Google Scholar]
- 30.Kelleher NL, Zubarev RA, Bush K, Furie B, Furie BC, Mclafferty FW, Walsh CT. Localization of labile posttranslational modifications by electron capture dissociation: The case of γ-carboxyglutamic acid. Anal Chem. 1999;71:4250–4253. doi: 10.1021/ac990684x. [DOI] [PubMed] [Google Scholar]
- 31.Kjeldsen F, Haselmann KF, Budnik BA, Sorensen ES, Zubarev RA. Complete characterization of posttranslational modification sites in the bovine milk protein PP3 by tandem mass spectrometry with electron capture dissociation as the last stage. Anal Chem. 2003;75:2355–2361. doi: 10.1021/ac026295b. [DOI] [PubMed] [Google Scholar]
- 32.Haselmann KF, Budnik BA, Olsen JV, Nielsen ML, Reis CA, Clausen H, Johnsen AH, Zubarev RA. Advantages of external accumulation for electron capture dissociation in Fourier transform mass spectrometry. Anal Chem. 2001;73:2998–3005. doi: 10.1021/ac0015523. [DOI] [PubMed] [Google Scholar]
- 33.Liu H, Hakansson K. Electron capture dissociation of tyrosine O-sulfated peptides complexed with divalent metal cations. Anal Chem. 2006;78:7570–7576. doi: 10.1021/ac061352c. [DOI] [PubMed] [Google Scholar]
- 34.Medzihradszky KF, Guan S, Maltby DA, Burlingame AL. Sulfopeptide fragmentation in electron-capture and electron-transfer dissociation. J Am Soc Mass Spectrom. 2007;18:1617–1624. doi: 10.1016/j.jasms.2007.06.002. [DOI] [PubMed] [Google Scholar]
- 35.Adamson JT, Hakansson K. Electron capture dissociation of oligosaccharides ionized with alkali, alkaline earth, and transition metals. Anal Chem. 2007;79:2901–2910. doi: 10.1021/ac0621423. [DOI] [PubMed] [Google Scholar]
- 36.Domon B, Costello CE. A systematic nomenclature for carbohydrate fragmentations in FAB-MS/MS spectra of glycoconjugates. Glycoconjugate J. 1988;5:397–409. doi: 10.1007/BF01049915. [DOI] [Google Scholar]
- 37.Wolff JJ, Laremore TN, Busch AM, Linhardt RJ, Amster IJ. Influence of charge state and sodium cationization on the electron detachment dissociation and infrared multiphoton dissociation of glycosaminoglycan oligosaccharides. J Am Soc Mass Spectrom. 2008;19:790–798. doi: 10.1016/j.jasms.2008.03.010. [DOI] [PMC free article] [PubMed] [Google Scholar]
Associated Data
This section collects any data citations, data availability statements, or supplementary materials included in this article.


